


Abstract
The length of stay (LOS) after transcatheter aortic valve implantation (TAVI) remains extremely variable whereas early discharge has been shown to be feasible and safe. The study objective was to evaluate the efficacy and safety of an intervention aimed at reducing LOS after transfemoral TAVI.
FAST-TAVI II is a prospective, multicentre, cluster, randomized, controlled study including patients with severe symptomatic aortic stenosis, who had transfemoral TAVI. The intervention consisted in a dedicated training programme to implement 10 quality of care measures to reduce LOS with an implementation phase of eight weeks. The primary endpoint was the proportion of patients discharged early within 3 days. Secondary endpoints included: LOS, 30-day mortality and 30-day incidence of readmission for cardiovascular events.
During the study period, 969 patients were enrolled in the intervention group and 860 patients in the control group. Mean age was 81.9 ± 6.6 years and mean EuroSCORE II was 4.4 ± 4.5%. Early discharge was achieved in 563 (58.1%) patients in the intervention group vs. 364 (42.3%) patients in the control group (P < .0001). Median LOS was significantly reduced in the intervention group compared to the control group [3 (IQR: 3) vs. 4 days (IQR: 3), P < .0001]. Thirty-day mortality was low and similar in the two groups (0.5% vs. 0.9%, P = .30), as were 30-day readmissions (4.6% vs. 2.8%, P = .28).
The intervention was simple and fast to implement, and was effective and safe to reduce LOS and increase the proportion of patients discharged early after TAVI (NCT04503655).
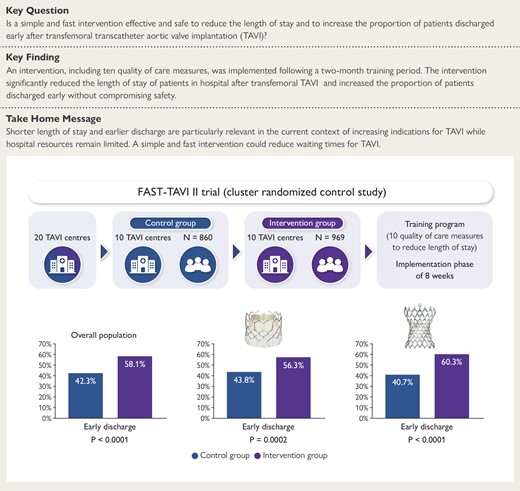
This prospective, multicentre, cluster, randomized controlled study included patients with severe symptomatic aortic stenosis who had transfemoral transcatheter aortic valve implantation in 20 French centres. Ten centres were allocated to the intervention group, which consisted in a dedicated training programme including 10 quality of care measures to reduce length of stay with an implementation phase of eight weeks. The other 10 centres received no training and carried on as usual (control group). The proportion of patients discharged early was significantly higher in the intervention group than in the control group in the overall population as well as in patients who received a balloon or a self-expandable prosthesis.
See the editorial comment for this article ‘Shortening in-hospital stay after transcatheter aortic valve implantation: a déjà vu in percutaneous interventions’, by J. Mehilli, https://doi.org/10.1093/eurheartj/ehae096.
Introduction
Transcatheter aortic valve implantation (TAVI) is increasingly used in the management of patients with severe aortic stenosis. Initially limited to inoperable and intermediate/high-risk patients, the indications for TAVI have recently been extended to patients over 75 years regardless of the level of risk when a femoral approach is feasible.1,2
Currently, there are no recommendations regarding the duration of in-hospital monitoring and practices are extremely heterogeneous.3,4 Since 2012, our group has proposed and shown the safety of a « minimalist » approach to simplify the procedure, to reduce the length of stay (LOS) of patients in hospital, and to increase the proportion of patients discharged early (i.e. within 3 days) after transfemoral TAVI.5–7 Similar results were reported later by other teams.8–11
Extended unjustified hospitalization can expose patients to potential iatrogenic complications and increase healthcare costs. In addition, shorter hospital LOS and earlier discharge are particularly relevant given the extension of TAVI indications and the limited resources available.
The objective of the study was to evaluate the efficacy and safety of a dedicated training programme to reduce LOS and to increase the proportion of patients discharged early after TAVI.
Methods
Study design
This prospective, multicentre, cluster, randomized, controlled, study included patients with severe symptomatic aortic stenosis who had transfemoral TAVI in 20 French centres. The 20 participating sites and investigators are listed in the supplementary material online. Ten centres were allocated to the intervention group, which consisted in a dedicated training programme including 10 quality of care (QoC) measures to reduce LOS with an implementation phase of eight weeks. The other 10 centres received no training and carried on as usual (control group). Randomization was computer-generated and carried out all at once after all participating centres had been identified. Centres were randomized using a 1:1 ratio after a stratification on the proportion of patients discharged early before the start of the study and the annual number of transfemoral TAVI in each centre in 2020, with strata being defined by the median value (greater or less than) of each stratification variable in the sample. Block randomization was used in each stratum to ensure a balanced number of centres in both groups.
The study was approved by the ethics committee (CPP Est IV, Strasbourg, France) in July 2020. All patients provided written informed consent before enrolment, and the study was conducted in accordance with the rules of Good Clinical Practice (GCP), and with the ethical principles established in the Declaration of Helsinki. The trial is registered in clinicaltrials.gov under the number NCT04503655. Each centre had to include a minimum of 75 consecutive patients with a maximum of 100 patients.
Inclusion criteria were patients older than 18 years with severe symptomatic aortic stenosis scheduled for transfemoral TAVI.
Exclusion criteria were patients deprived of liberty by administrative or judicial decision or placed under judicial safeguard/guardianship or curatorship, patients unable to understand the information note or to give consent (psychiatric or cognitive disorders), and pregnant, parturient, breast-feeding women or a proven lack of contraception in women of childbearing age with no known sterility.
Procedure
After randomization, a leadership team was identified in each of the 10 centres randomized to the intervention. The intervention consisted in the implementation of 10 QoC measures (Table 1), including five logistical measures and five preventive measures to reduce LOS after transfemoral TAVI. Logistical measures were: education of patients, education of medical teams, daily monitoring of patients, anticipation of post-TAVI transthoracic echocardiography, and early mobilization. Preventive measures were: a decision tree for the management of conduction disturbances as proposed by Rodés-Cabau et al.,12 echo-guided or angio-guided femoral puncture, echographic or angiographic control of femoral closure, prevention of bleeding, and prevention of acute kidney injury. All centres in the intervention group were trained via videoconference to implement these measures. The intervention was spread over an eight-week period during which each centre introduced the QoC measures in their routine practice. Follow-up calls were organized between the study training team and each centre every four weeks to offer assistance with regard to the progress of implementation. The 10 QoC measures were self-reported by each centre and rated from 0% to 100% before the start of the study, after the end of the eight weeks, and every four weeks until the end of inclusion in the intervention group only. Enrolment started in the two groups in January 2021.
FAST-TAVI II quality of care measures
| FAST-TAVI II quality of care measures | Implementation description |
|---|---|
| The patient and if possible a family member are informed of early discharge home after the procedure in the absence of complications. |
| At least one meeting before the start of the study to inform staff involved in procedural and post-procedural care of patients with severe aortic stenosis. |
| Visit of the patient 4 to 6 h after the procedure and daily visit until discharge. |
| TTE is scheduled on the same day or the day after the procedure. |
| A decision tree is required according to local practices or by default the one proposed by Rodes-Cabau J et al. (J Am Coll Cardiol 2019;74:1086–106). |
| Echo-guided or angio-guided femoral puncture is required to reduce vascular complications. |
| Echographic or angiographic control is required at the end of the procedure to confirm the correct closure of the access site and immediate management of vascular complications even minor. |
| Early mobilization by a nurse 4–6 h after the procedure in the absence of haemorrhagic or vascular complications. |
| Stop oral anticoagulant therapy at least 48 h before the procedure; prescription of single antiplatelet therapy in patients without indication of oral anticoagulant alone or VKA/DOAC alone in patients without recent percutaneous coronary intervention; contraindication of a loading dose of clopidogrel before TAVI. |
| Stop nephrotoxic drugs 48 h before the procedure, hydrate the patient before and after the procedure and limit the amount of contrast, especially in patients with chronic renal failure. |
LOS, length of stay; TAVI, transcatheter aortic valve implantation; TTE, transthoracic echocardiography; VKA/DOAC, vitamin k antagonist/direct oral anticoagulant.
With the exception of these 10 measures, the procedures were carried out according to the centres’ usual practices, particularly for the choice of prosthesis and the need or not to perform pre- or post-dilatation.
Outcomes
The primary study endpoint was the proportion of patients discharged within 3 days of the TAVI procedure. A discharge that included a transfer to another hospital or a rehabilitation centre was not considered early regardless of LOS. Patients who lived in nursing homes before the procedure and who were discharged directly into the same nursing homes were considered discharged at home.
Secondary endpoints were hospital LOS after the procedure, 30-day mortality and 30-day readmission for cardiovascular events, implementation of the 10 QoC measures, main reasons for not being discharged early, and factors associated with the effectiveness of the intervention. LOS was calculated from the TAVI procedure to hospital discharge.
Statistical analysis
Patient characteristics and outcomes were described using mean and standard deviation (SD) for continuous variables, and number and percentage for categorical variables. Outcomes were compared between the two treatment groups using Student’s t-tests for continuous variables and χ² or Fisher’s exact tests for categorical variables as the coefficient of variation in cluster size was 0.17 and no type I error inflation was expected due to the trial’s balanced design. Outcomes were also described by type of transcatheter valve.
A multivariable multilevel logistic regression model with a random intercept at the centre level was carried out to study participant-average treatment effect using participant-level analysis after adjusting on potential confounders. A multilevel model was chosen because of the nested structure of the data associated with cluster randomization.13 The outcome was failure of early discharge. Factors likely to be associated with the endpoint were first identified by expert clinicians and those variables were then tested in a univariate multilevel regression model. Variables below the 0.2 significance threshold or for which there was a strong hypothesis of their association with failure of early discharge were included in the multivariable regression model. To confirm the existence of a random effect at the hospital level, we first ran a null model without any explanatory variables (Model 1). We then introduced patients’ characteristics (Model 2) and then added variables at the cluster level (Model 3). Patients’ characteristics included age, sex, signs of congestive heart failure at admission, history of chronic obstructive pulmonary disease, valve-in-valve procedure, post-implantation conduction disturbances, and maximum post-implantation creatinine level. Hospital characteristics included the proportion of patients meeting the primary endpoint and the number of implanted transfemoral TAVI in the centre in the year before the start of the study, the mean EuroSCORE II of patients and the status of the centre (public or private).
To study changes in the primary endpoint over time, an interrupted time series analysis was also carried out.14 In order to do so, data on the proportion of patients discharged within 3 days of the procedure in the 20 participating centres were extracted from the FRANCE TAVI registry for the 12 months before the start of the study. The endpoint was then calculated for each month of the trial using trial data.
All analyses were carried out using SAS V.9.4. A P-value of <.05 was considered statistically significant. Modelling results were reported using odds ratio (OR) with 95% confidence interval (CI).
Results
Trial population
During the studied period, 1829 patients were included in the study (969 patients in the intervention group and 860 patients in the control group).
The baseline characteristics of the study population are shown in Table 2. Most variables were similar between the two groups except for age (patients were slightly older in the intervention group), and the proportions of patients with chronic obstructive pulmonary disease and peripheral arterial disease (PAD) which were higher in the control group. Moreover, the mean EuroSCORE II was higher in the control group. In contrast, the proportion of frail patients was higher in the intervention group. The severity of aortic stenosis, left ventricular ejection fraction (LVEF), and pulmonary pressures were similar between groups.
Baseline characteristics
| Variables | Overall | Control group | Intervention group |
|---|---|---|---|
| (n = 1829) | (n = 860) | (n = 969) | |
| Age, years | 81.9 ± 6.6 | 81.4 ± 7.1 | 82.3 ± 6.2 |
| Male sex, n (%) | 1023 (55) | 488 (56.7) | 535 (55.2) |
| Diabetes, n (%) | 532 (29.6) | 231 (31.1) | 271 (28.2) |
| Hypertension, n (%) | 1408 (77.0) | 664 (77.2) | 744 (76.8) |
| Dyslipidaemia, n (%) | 948 (51.8) | 431 (50.1) | 517 (53.3) |
| Smoker, n (%) | 81 (4.4) | 44 (5.1) | 37 (3.8) |
| Frailty, n (%) | 336 (19.4) | 112 (14.0) | 224 (23.9) |
| COPD, n (%) | 164 (9.0) | 90 (10.5) | 74 (7.6) |
| PAD, n (%) | 266 (14.8) | 148 (17.6) | 118 (12.3) |
| Stroke, n (%) | 194 (10.8) | 82 (9.8) | 112 (11.6) |
| Pacemaker, n (%) | 139 (7.7) | 61 (7.3) | 78 (8.1) |
| PCI, n (%) | 526 (29.2) | 230 (27.4) | 296 (30.8) |
| CABG, n (%) | 96 (5.3) | 46 (5.5) | 50 (5.2) |
| AF, n (%) | 530 (30.1) | 254 (30.6) | 276 (29.7) |
| EuroSCORE II, % | 4.4 ± 4.5 | 4.8 ± 5.1 | 4.1 ± 3.8 |
| NYHA class, n (%) | |||
| I | 23 (1.4) | 11 (1.4) | 12 (1.4) |
| II | 673 (41.5) | 274 (36.1) | 399 (46.4) |
| III | 840 (5.2) | 428 (56.3) | 412 (47.9) |
| IV | 84 (5.2) | 47 (6.2) | 37 (4.3) |
| Haemoglobin, g/dL | 12.6 ± 1.6 | 12.6 ± 1.6 | 12.6 ± 1.6 |
| Creatinine, µmol/L | 99.6 ± 51.8 | 101.7 ± 55.3 | 97.9 ± 48.9 |
| Mean aortic gradient, mmHg | 48.1 ± 14.6 | 48.3 ± 14.4 | 48.0 ± 14.7 |
| EOA, cm² | 0.75 ± 0.18 | 0.74 ± 0.19 | 0.75 ± 0.18 |
| LVEF, % | 56.5 ± 10.5 | 56.0 ± 11.1 | 57.0 ± 9.8 |
| sPAP, mmHg | 40.5 ± 13.0 | 41.0 ± 12.6 | 40.0 ± 13.3 |
COPD, chronic obstructive pulmonary disease; PAD, peripheral arterial disease; PCI, percutaneous coronary intervention; CABG, coronary artery bypass graft; AF, atrial fibrillation; EOA, effective orifice area; LVEF, left ventricular ejection fraction; sPAP, systolic pulmonary arterial pressure.
Procedural characteristics are shown in Table 3. The vast majority of the procedures was performed using local anaesthesia in the two groups. Valve-in-valve procedures were more frequently performed in the control group. Pre-dilatation was more frequently used in the intervention group whereas post-dilatation was more frequent in the control group. Corevalve (Medtronic Inc., Minneapolis, MN, USA), and Acurate (Boston Scientific, Maple Grove, MN, USA) transcatheter heart valves (THV) were more frequently implanted in the intervention group whereas Sapien (Edwards Lifesciences, Irvine, CA, USA) and Portico (Abbott, IL, USA) THV were more frequently used in the control group. The mean valve diameter was similar in the two groups. Mean annulus and valve diameters for each type of valve are shown in Supplementary data online, Table S1. X-ray time and volume of contrast were higher in the control group. The incidence of paravalvular aortic regurgitation grade > 2 was very low and similar in the two groups.
Procedural characteristics
| Variables | Overall | Control group | Intervention group |
|---|---|---|---|
| (n = 1829) | (n = 860) | (n = 969) | |
| Local anaesthesia, n (%) | 1739 (97.2) | 796 (95.6) | 943 (98.6) |
| Valve-in-valve, n (%) | 121 (6.6) | 78 (9.1) | 43 (4.4) |
| Pre-dilatation, n (%) | 352 (20.0) | 137 (16.6) | 215 (22.9) |
| Type of valve, n (%) | |||
| Sapien | 923 (59.3) | 484 (60.6) | 439 (58.1) |
| Corevalve | 480 (30.9) | 243 (30.4) | 237 (31.4) |
| Acurate | 106 (6.8) | 37 (4.6) | 69 (9.1) |
| Portico | 47 (3.0) | 36 (4.5) | 11 (1.5) |
| Valve diameter, mm | 26.6 ± 2.7 | 26.8 ± 2.7 | 26.6 ± 2.7 |
| Post-dilatation, n (%) | 186 (12.4) | 96 (14.7) | 90 (10.6) |
| X-ray time, min | 15.0 ± 7.4 | 16.0 ± 7.6 | 14.2 ± 7.2 |
| Amount of contrast, mL | 121.4 ± 57.8 | 127.5 ± 63.3 | 116.2 ± 52.1 |
| PVL grade > 2, n (%) | 23 (1.3) | 12 (1.4) | 11 (1.1) |
PVL, paravalvular leak.
In-hospital complications are shown in detail in Table 4. Interestingly, the incidence of complications was similar in the two groups.
In-hospital complications
| Variables | Overall | Control group | Intervention group | P |
|---|---|---|---|---|
| (n = 1829) | (n = 860) | (n = 969) | ||
| Cardiac complications | ||||
| Conduction disturbances, n (%) | 657 (35.9) | 288 (33.5) | 369 (38.1) | .25 |
| Complete AV block, n (%) | 205 (11.2) | 98 (11.4) | 107 (11.0) | .17 |
| LBBB, n (%) | 396 (23.4) | 182 (23.0) | 214 (23.5) | .82 |
| Permanent pacemaker implantation, n (%) | 297 (16.2) | 139 (16.2) | 158 (16.3) | .12 |
| Tamponade, n (%) | 12 (0.7) | 6 (0.7) | 6 (0.6) | .69 |
| Valve migration, n (%) | 8 (0.4) | 4 (0.5) | 4 (0.4) | .71 |
| Cardiac surgery, n (%) | 2 (0.1) | 2 (0.3) | 0 | .14 |
| Second valve, n (%) | 6 (0.3) | 2 (0.2) | 4 (0.4) | .43 |
| Vascular complications | ||||
| Major, n (%) | 28 (1.5) | 14 (1.6) | 14 (1.4) | .43 |
| Minor, n (%) | 109 (6.0) | 64 (7.4) | 45 (4.6) | |
| Covered stent, n (%) | 72 (3.9) | 39 (4.5) | 33 (3.4) | .51 |
| Vascular surgery, n (%) | 24 (1.3) | 14 (1.6) | 10 (1.0) | .84 |
| Neurological complications | ||||
| Stroke, n (%) | 43 (2.4) | 22 (2.6) | 21 (2.2) | .98 |
| Major | 16 (0.9) | 10 (1.2) | 6 (0.6) | .25 |
| Minor | 27 (1.5) | 12 (1.4) | 15 (1.6) | |
| TIA, n (%) | 11 (0.6) | 5 (0.6) | 6 (0.6) | .67 |
| Confusional syndrome, n (%) | 35 (1.9) | 17 (2.0) | 18 (1.9) | .66 |
| Bleeding complications | ||||
| Life-threatening, n (%) | 8 (0.4) | 5 (0.6) | 3 (0.3) | .89 |
| Major, n (%) | 42 (2.3) | 24 (2.8) | 18 (1.9) | |
| Minor, n (%) | 108 (5.9) | 59 (6.9) | 46 (5.1) | |
| Transfusions, n (%) | 71 (3.9) | 34 (4.0) | 37 (3.8) | .07 |
| Kidney complications | ||||
| AKI, n (%) | .18 | |||
| I | 40 (2.2) | 24 (2.8) | 16 (1.7) | |
| II | 9 (0.5) | 4 (0.5) | 5 (0.5) | |
| III | 5 (0.3) | 1 (0.1) | 4 (0.4) | |
| Haemodialysis, n (%) | 3 (0.2) | 1 (0.1) | 2 (0.2) | .59 |
| Infectious complications | ||||
| Pulmonary, n (%) | 16 (0.9) | 7 (0.8) | 9 (0.9) | .71 |
| Urinary, n (%) | 20 (1.1) | 10 (1.2) | 10 (1.0) | .81 |
| Other, n (%) | 33 (1.8) | 18 (2.1) | 15 (1.6) | .27 |
AV, atrioventricular; LBBB, left bundle branch block; TIA, transient ischaemic attack; AKI, acute kidney injury.
Implementation of quality of care measures in the intervention group
The results are shown in Figure 1. Overall, QoC measures were already adopted in 55% of the centres before the start of the study and were gradually implemented to reach 89% of the centres at the end of the study.
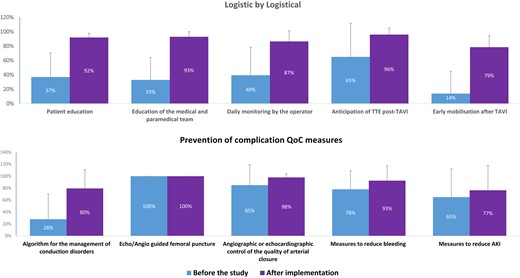
Bar graph of the implementation of logistical and preventive measures to minimize complications before the start of the study and after implementation in the intervention group. AKI, acute kidney injury; TTE, transthoracic echocardiography
Among the 10 QoC measures, logistical measures (patient education, medical team education, daily monitoring of the patient by the operator, and early mobilization) were poorly adopted in the intervention group before the start of the study and were implemented in nearly 90% of cases at the end of the study.
In contrast, preventive measures related to complications (vascular, bleeding and acute kidney injury complications) were frequently already adopted before the start of the study with the exception of a decision tree for management of conduction disturbances in only 28%. The greatest improvement was observed for the adoption of a decision tree to reduce the impact of conduction disorders on LOS.
Outcomes
The results are summarized in Table 5. In-hospital death was very low and similar in the two groups. A very high proportion of patients were discharged home (92.8%) and very few were transferred to a rehabilitation centre.
Discharge modality
| Variables | Overall | Control group | Intervention group | P |
|---|---|---|---|---|
| (n = 1829) | (n = 860) | (n = 969) | ||
| Exit site | ||||
| Home, n (%) | 1697 (92.8) | 784 (91.2) | 913 (94.2) | .08 |
| Rehabilitation, n (%) | 71 (3.9) | 41 (4.8) | 30 (3.1) | |
| Death, n (%) | 9 (0.5) | 6 (0.7) | 3 (0.3) | |
| Other, n (%) | 52 (2.8) | 29 (3.4) | 23 (2.4) | |
| Antithrombotic therapy | ||||
| Aspirin, n (%) | 1194 (65.6) | 550 (64.4) | 644 (66.7) | .31 |
| Clopidogrel, n (%) | 585 (32.1) | 235 (27.5) | 350 (36.2) | <.0001 |
| DAPT, n (%) | 452 (24.8) | 193 (22.6) | 259 (26.8) | .04 |
| OAC, n (%) | 697 (38.3) | 326 (38.2) | 371 (38.4) | .92 |
| Causes of failed early discharge | ||||
| Conduction disturbances, n (%) | 450 (24.6) | 209 (24.3) | 241 (24.8) | <.0001 |
| Vascular complications, n (%) | 110 (6.0) | 59 (6.9) | 51 (5.3) | .76 |
| Bleeding complications, n (%) | 122 (6.7) | 70 (8.1) | 52 (5.4) | .57 |
| Neurological complications, n (%) | 61 (3.3) | 34 (4.0) | 27 (2.8) | .90 |
| Kidney complications, n (%) | 54 (3.0) | 28 (3.3) | 26 (2.7) | .63 |
| Infectious complications, n (%) | 58 (3.2) | 27 (3.1) | 31 (3.2) | .18 |
| Heart failure, n (%) | 37 (2.0) | 17 (2.0) | 20 (2.1) | .26 |
| Myocardial infarction, n (%) | 2 (0.1) | 1 (0.1) | 1 (0.1) | >.99 |
| Autonomy loss, n (%) | 33 (1.8) | 15 (1.7) | 18 (1.9) | .26 |
| Refusal, n (%) | 14 (0.8) | 9 (1.0) | 5 (0.5) | .49 |
| Logistic, n (%) | 26 (1.4) | 7 (0.8) | 19 (2.0) | .003 |
DAPT, dual antiplatelet therapy; OAC, oral anticoagulation.
The proportion of patients discharged early, i.e. within 3 days of the procedure, was significantly higher in the intervention group than in the control group (58.1% vs. 42.3%, P < .0001) (Figure 2A). Consistently, the median LOS was significantly lower in the intervention group than in the control group (see Supplementary data online, Figure S1A).
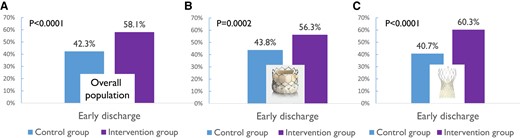
Proportion of patients discharged early in the intervention (purple) and control (blue) groups in the overall population (A) and in patients implanted with a Sapien (B) or a Corevalve (C) transcatheter heart valve
The proportion of patients discharged early remained significantly higher in the intervention group than in the control group for Sapien (56.3% vs. 43.8, P = .002; Figure 2B), Corevalve (60.3% vs. 40.7%, P < .0001; Figure 2C), and Acurate (68.1% vs. 32.4%, P = .0004) THV. The proportion of patients implanted with a Portico valve was too low to draw any firm conclusions. The median LOS was also significantly lower in the intervention group than in the control group for both Sapien [3 (4) vs. 4 (3) days, P = .02] and Corevalve [3 (2) vs. 4 (3), P = .002] THV (see Supplementary data online, Figure S1B and C). In contrast, the difference was not significant for Acurate [3 (3) vs. 4 (3) days, P = .10] and Portico [4 (4) vs. 4 (3.5) days, P = .56] THV.
The main reason for failure of early discharge was related to the occurrence of complications, in particular conduction disturbances requiring extended monitoring. The distribution of the main reasons for failure of early discharge was similar in the two groups (Table 5).
Multivariable analysis of failure of early discharge is shown in Table 6. The intervention independently and significantly reduced the risk of failure of early discharge (OR 0.227, 95% CI 0.053–0.961), after adjusting for sex, age, comorbidities (congestive heart failure at admission, chronic obstructive pulmonary disease, PAD, NYHA, conduction disturbances), characteristics of the intervention (amount of contrast, type of anaesthesia, valve-in-valve) and peak of creatinine after TAVI, as well as centre characteristics.
Multivariable analysis of failure of early discharge
| Variables | OR | 95% CI | P |
|---|---|---|---|
| Intervention | 0.227 | 0.053–0.961 | .0448 |
| Patient characteristics | |||
| Age | 1.017 | 0.997–1.038 | .0878 |
| Female sex | 1.776 | 1.335–2.363 | .0005 |
| Congestive HF at admission | 1.711 | 1.071–2.732 | .0275 |
| COPD | 1.118 | 0.695–1.800 | .6280 |
| PAD | 1.023 | 0.696–1.502 | .9035 |
| NYHA classa | |||
| II | 1.147 | 0.352–3.743 | .8159 |
| III | 1.089 | 0.335–3.534 | .8851 |
| IV | 3.078 | 0.833–11.369 | .0898 |
| Conduction disturbances | 6.327 | 4.712–8.496 | <.0001 |
| General anaesthesia | 1.685 | 0.719–3.948 | .2022 |
| Valve-in-valve | 0.897 | 0.500–1.610 | .7014 |
| Amount of contrast | 1.010 | 1.007–1.013 | <.0001 |
| Creatinine (peak post-TAVI) | 1.005 | 1.003–1.007 | <.0001 |
| Centre characteristics | |||
| Non-university centre | 0.807 | 0.216–3.014 | .7305 |
| % of patients early discharged before the study | 0.938 | 0.859–1.024 | .1369 |
| Centre volume | 0.998 | 0.992–1.005 | .6004 |
| Mean EuroSCORE II | 0.949 | 0.55–1.636 | .8386 |
COPD, chronic obstructive pulmonary disease; HF, heart failure; PAD, peripheral arterial disease; TAVI, transcatheter aortic valve implantation.
aReference class I.
Temporal analysis of early discharge before and after the start of the study in the control and intervention groups is shown in Figure 3. The interrupted time series analysis showed that in the control group (Figure 3A), there was no significant difference in the proportion of patients discharged early in the year before the start of the study. In contrast, immediately after the start of the study, there was a significant increase in the proportion of patients discharged early. However, during the inclusion period, the proportion of patients discharged early significantly decreased. Meanwhile, in the intervention group (Figure 3B), a similar trend was observed in the year before the start of the study (no significant difference in the primary endpoint) and immediately after the start of the study, there was a significant increase in the proportion of patients discharged early. Unlike the control group, the increase remained stable during the inclusion period (no significant increase or decrease during this period).
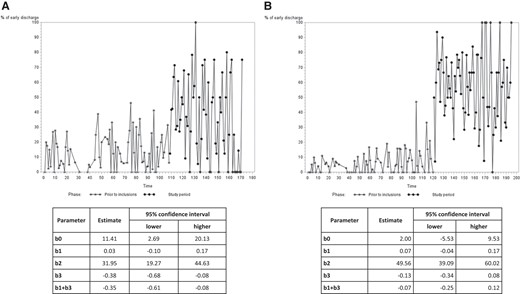
Interrupted time series analysis of the proportion of patients discharged early in the control (A) and intervention (B) groups, in the 12 months before the start of the study and the 12 months after the start of the study. b0, intercept; b1, slope during the pre-intervention period; b2, difference between the pre-intervention and intervention periods after adjusting for the pre-existing trend (b1); b3, comparison between the pre-intervention and intervention slopes; b1 + b3, slope during the intervention period
Thirty-day mortality was not significantly different in the two groups (0.9% in the control group vs. 0.5% in the intervention group, P = .30). Mortality was very low between discharge and 30-day follow-up and similar in the two groups (0.3% in the control group vs. 0.2% in the intervention group, P = .29). Furthermore, the 30-day rehospitalization rate for cardiovascular events was low and not significantly different between the two groups (2.8% in the control group vs. 4.6% in the intervention group, P = .28).
Discussion
The results of our study show that an intervention with a dedicated simple and fast training programme was effective and safe to reduce LOS and to increase the proportion of patients discharged home early after transfemoral TAVI (Structured Graphical Abstract).
Since 2012, our group has proposed a ‘minimalist approach’ (including local anaesthesia without transoesophageal echocardiography guidance) to simplify transfemoral TAVI procedures nowadays widely adopted worldwide.5 Furthermore, in 2015, we reported that early discharge was feasible and safe in almost 80% of cases after transfemoral TAVI in the absence of complications.6,7 Later, the Vancouver 3M and the Italian FAST-TAVI studies reported similar results.8,9
Despite the results of these studies, LOS remains long and heterogeneously distributed among centres.3,4 We also described, in a multicentre prospective observational national trial, LOS and the proportion of patients discharged early after transfemoral TAVI using exclusively local anaesthesia and the Sapien 3 prosthesis between 2017 and 2018 in high volume centres. Median LOS was 5 (3–7) days and varied considerably between centres (from 2 to 7 days). Similar results were obtained for the proportion of patients discharged early.15 Reported reasons for extended hospitalization were mainly complications (in 62.2% of cases) and surprisingly, the investigators reported no apparent reasons in almost one third of cases.15 These results were the basis for the design of the present study. Although the proportion of patients discharged early increased in the two groups, the increase was significantly higher in the intervention group compared to the control group. This finding attests to a spontaneous trend for a decrease in LOS over time, which may be partly related to TAVI performance in patients at lower risk.16 Therefore, assessment of interventions aimed at reducing LOS should be ideally performed and compared to standard of care during the same time period. Interestingly, we also observed that LOS also decreased in the control group during the study. This may reflect a ‘Hawthorne effect’, whereby the decrease of LOS was not related to the intervention but to the fact that the investigators were aware of participating in an experiment in which they were being tested, which results generally in greater motivation. The subsequent decrease in LOS may be explained by the fact that they did not have a training programme to reduce LOS and were not able to maintain their initial results.
Interestingly, similar results were obtained with Sapien and Corevalve THV. Furthermore, the median LOS was similar (3 days) with both of these THV prostheses in the intervention group whereas it was reported that LOS was significantly higher with a self-expandable prosthesis.4 This was mainly attributed to the more frequent incidence of acute and delayed conduction disturbances with a self-expandable THV.17 In our study, by applying similar QoC measures with all THV, and in particular a similar decision tree for the management of conduction disorders for all TVH prostheses, early discharge and LOS were similarly improved for balloon and self-expandable prostheses in the intervention group.
We cannot affirm which QoC measure(s) had the most impact in reducing LOS after TAVI. However, logistical QoC measures (patient education, education of the medical and paramedical teams, daily monitoring by the operator, early mobilization) and the use of an algorithm for the management of conduction disorders were poorly adopted before the study and their almost 90% implementation undoubtedly contributed the most to an increase in early discharge in the intervention group. It is unlikely that the other measures had a significant impact as they were already frequently implemented before the start of the study.
In addition, our findings are consistent with the literature regarding confounding variables. As previously reported the presence of comorbidities and the occurrence of complications were associated with prolonged LOS.4,6,7,15 Women were also less likely to be discharged early. This could be attributed to the fact that certain complications (particularly vascular and bleeding) are more frequent in female patients. Furthermore, it has been reported that female patients referred for the treatment of aortic stenosis are older, have more comorbidities and more severe symptoms, are at higher surgical risk and are more often in a critical preoperative state.18–20
The strategy of early discharge was safe since the rates of death between discharge and 30-day follow-up as well as readmission for cardiovascular events were low and similar in the two groups. These results are in accordance with previous studies which reported a low incidence of 30-day mortality and/or readmission in patients discharged early after transfemoral TAVI.6–11
There are limitations inherent to the present study. First, our study was conducted in one country (France) and further studies are warranted to evaluate the feasibility of our intervention in other countries. Second, the implementation of QoC measures was self-reported and it is therefore possible that it was overestimated by the investigators. Third, we were not able to evaluate which measure(s) contributed the most to this reduction in LOS but it is likely that it was mainly the logistical measures that had an impact because the rate of complications was similar in the two groups. Fourth, secondary access site via radial artery, the proportion of patients who underwent only local anaesthesia or local anaesthesia and sedation, and the access site for a temporary pacemaker were not available in our database.
In conclusion, a simple and fast intervention including 10 logistical and preventive QoC measures to minimize complications can safely and effectively reduce LOS and increase the proportion of patients discharged early after transfemoral TAVI, as assessed in this large cluster randomized trial. The results of our study are of particular importance in the current context of TAVI where the number of indications is increasing considerably while resources remain limited. A shorter hospital LOS and an earlier discharge after TAVI could reduce waiting times for new patients. A gain of 1 day of hospital LOS represents one important step, but continuous efforts should be made to further reduce LOS and to increase the proportion of patients discharged home early after TAVI.
Acknowledgements
The authors are grateful to Nikki Sabourin-Gibbs, CHU Rouen, for her help in editing the manuscript. We would also like to thank Armelle Guidotti (project manager) and Noémie Gibert and Selma Makhlouf (clinical research associates) for their contribution to this study.
Supplementary data
Supplementary data are available at European Heart Journal online.
Declarations
Disclosure of Interest
E.D. is consultant for Edwards Lifesciences. Thib.L. is consultant for Medtronic and Abbott. G.B. has received grants from Edwards Lifesciences, Medtronic, and Abbott. Other authors have no conflict of interest.
Data Availability
Data are available on reasonable request following an embargo phase until main results of the FAST-TAVI II study are published.
Funding
The FAST-TAVI II study was funded by the French Government, managed by the National Research Agency (ANR) under the programme Investissements d’Avenir, with the reference ANR-16-RHUS-0003_STOP-AS. Professors E.D., F.B., CT, and H.E. and Doctor D.B.-G. are members of the FHU CARNAVAL consortium for which a Groupement de Coopération Sanitaire (GCS) G4 grant has been awarded.
Ethical Approval
The study was approved by the ethics committee (CPP Est IV, Strasbourg, France) in July 2020. All patients provided written informed consent before enrolment, and the study was conducted in accordance with the rules of Good Clinical Practice (GCP), and with the ethical principles established in the Declaration of Helsinki.
Pre-registered Clinical Trial Number
The pre-registered clinical trial number is NCT04503655.
References
Author notes
Delphine Beziau-Gasnier and Morgane Michel co-secondary authors.

