


Abstract
Identifying patients with hypertrophic cardiomyopathy (HCM) who are candidates for implantable cardioverter defibrillator (ICD) implantation in primary prevention for sudden cardiac death (SCD) is crucial. The aim of this study was to externally validate the 2022 European Society of Cardiology (ESC) model and other guideline-based ICD class of recommendation (ICD-COR) models and explore the utility of late gadolinium enhancement (LGE) in further risk stratification.
Seven hundred and seventy-four consecutive patients who underwent cardiac magnetic resonance imaging were retrospectively enrolled.
Forty-six (5.9%) patients reached the SCD-related endpoint during 7.4 ± 2.5 years of follow-up. Patients suffering from SCD had higher ESC Risk-SCD score (4.3 ± 2.4% vs. 2.8 ± 2.1%, P < .001) and LGE extent (13.7 ± 9.4% vs. 4.9 ± 6.6%, P < .001). Compared with the 2014 ESC model, the 2022 ESC model showed increased area under the curve (.76 vs. .63), sensitivity (76.1% vs. 43.5%), positive predictive value (16.8% vs. 13.6%), and negative predictive value (98.1% vs. 95.9%). The C-statistics for SCD prediction of 2011 American College of Cardiology (ACC)/American Heart Association (AHA), 2014 ESC, 2020 AHA/ACC, and 2022 ESC models were .68, .64, .76 and .78, respectively. Furthermore, in patients without extensive LGE, LGE ≥5% was responsible for seven-fold SCD risk after multivariable adjustment. Whether in ICD-COR II or ICD-COR III, patients with LGE ≥5% and <15% showed significantly worse prognosis than those with LGE <5% (all P < .001).
The 2022 ESC model performed better than the 2014 ESC model with especially improved sensitivity. LGE enabled further risk stratification based on current guidelines.
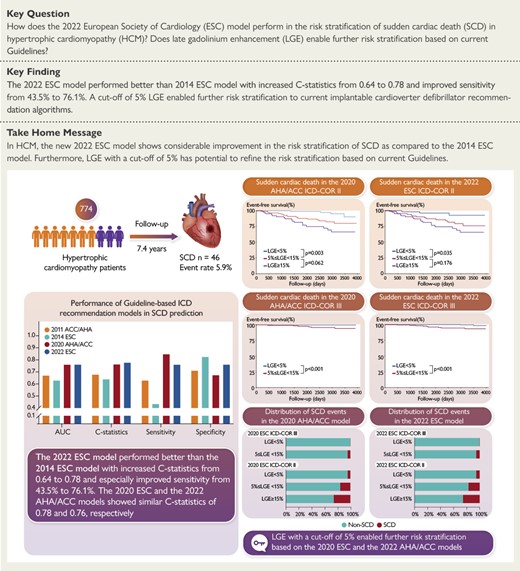
In a sizable Chinese cohort of 774 patients with hypertrophic cardiomyopathy, 46 (5.9%) patients suffered SCD events during a mean follow-up of 7.4 years. The new 2022 ESC model performed better than 2014 ESC model for SCD risk stratification with increased C-statistics from 0.64 to 0.78 and especially improved sensitivity from 43.5% to 76.1%. 2022 ESC model and 2020 AHA/ACC model showed similar overall discrimination performance. LGE with a cut-off of 5% enabled further risk stratification based on current 2022 ESC and 2020 AHA/ACC guidelines.
See the editorial comment for this article ‘Prime time for CMR imaging of arrhythmogenic substrate in hypertrophic cardiomyopathy’, by C. Gräni, https://doi.org/10.1093/eurheartj/ehad686.
Introduction
Hypertrophic cardiomyopathy (HCM), characterized by increased left ventricular (LV) wall thickness unexplained by abnormal loading conditions, is the most common inherited heart disease with a prevalence of .2% to .5% worldwide.1–3 HCM is one of the leading causes of sudden cardiac death (SCD) in young and otherwise healthy individuals.4 The annual rate of SCD or appropriate implantable cardioverter defibrillator (ICD) therapy related to HCM is about .8%, depending on age and risk profile.5 Although lethal SCD is avoidable by ICD implantation, identifying high-risk patients who most likely benefit from ICD implantation for primary prevention of SCD is crucial but challenging.
To fill the gap, the 2011 American College of Cardiology (ACC)/American Heart Association (AHA) guideline proposed an ICD recommendation model for selection of patients. However, this model was reported to be sensitive but not specific with limited power.6 Then, the 2014 European Society of Cardiology (ESC) guideline proposed the HCM Risk-SCD score to estimate individualized 5-year risk as a decision-making tool.2,7 However, recent studies reported that the Risk-SCD model has a relatively low sensitivity and may mis-classify risk, leaving many patients unprotected.8,9 Fortunately, the emergence of new evidence-based risk markers has great potential to refine risk stratification.9–13 Nowadays, the 2020 AHA/ACC guideline and 2022 ESC guideline for ventricular arrhythmia and SCD introduced new risk markers including apical aneurysm, LV ejection fraction (LVEF) < 50%, and extensive late gadolinium enhancement (LGE) to form new algorithms for ICD class of recommendation (ICD-COR).5,14,15 Although the enhanced 2022 ESC model is expected to have a reasonable improvement over the previous version and addresses the issue of insufficient sensitivity, external validation of the new ESC model is warranted.
Additionally, although extensive LGE (≥15% of LV mass) has been recognized as the indication for primary ICD in both 2022 ESC and 2020 AHA/ACC models, the SCD risk in patients with LGE but less than 15% remains under investigated.5,14,15 Considering that LGE represents the abnormal fibrotic arrhythmogenic substrate, we hypothesize that a more detailed delineation of LGE threshold could further stratify the SCD risk in such patients.16 Therefore, this study aims to externally validate the 2022 ESC model in a sizable Chinese HCM cohort, compare the performance between different guideline-based ICD-COR models, and explore the utility of LGE in further risk stratification of SCD based on current guidelines.
Methods
Patient population
The retrospective study consisted of 774 consecutive HCM patients who were ≥18 years of age and underwent cardiac magnetic resonance (CMR) examination at Fuwai Hospital (Beijing, China) between January 2012 and December 2013. The diagnosis of HCM was established with CMR showing a maximal end-diastolic wall thickness of ≥15 mm (or 13–14 mm when present in family members of a patient with HCM or in conjunction with a positive genetic test) anywhere in the left ventricle in the absence of another cause of hypertrophy.15 The following patients were excluded: (1) previous documented cardiac arrest or sustained ventricular tachycardia (n = 11); (2) previous history of septal reduction therapies including surgical septal myectomy and alcohol septal ablation (n = 15); (3) concomitant valvular heart disease (n = 6); (4) concomitant congenital heart disease, including atrial septal defect and sub-aortic membrane (n = 4); (5) previous history of myocardial infarction or significant coronary artery stenosis (n = 32); (6) uncontrolled hypertension (n = 22) and HCM phenocopies (n = 6), including cardiac amyloidosis, Anderson–Fabry disease, and Danon disease based on clinical profile, CMR features, genetic information, and endomyocardial biopsy; (7) poor image quality (n = 16).
Demographic characteristics and medical history were collected from an electronic medical record database. History of non-sustained ventricular tachycardia (NSVT) (≥3 consecutive ventricular beats at a rate of ≥120 bpm and <30 s in duration) and atrial fibrillation (AF) were recorded from medical history, electrocardiograms or 24 h Holter.17 This study was approved by the ethics committee of Fuwai Hospital. Written informed consent was waived because this study was retrospective.
Cardiac magnetic resonance imaging
Gadolinium-based contrast agent-enhanced CMR examinations were performed on a 1.5 T scanner (Magnetom Avanto; Siemens, Erlangen, Germany) with electrocardiographic and respiratory gating. All examinations were performed after routine breath-hold training. The standard CMR protocol mainly consisted of (1) transverse and sagittal black-blood images; (2) balanced steady-state free precession sequences for LV long-axis (two-chamber, three-chamber, and four-chamber views) and short-axis (cover the entire left ventricle) cine images; and (3) 2-dimensional segmented phase-sensitive inversion recovery Turbo FLASH sequences for LGE images in long- and short-axes views matching cine images.
LV structural and functional parameters and LGE quantification were performed on commercially available post-processing software (CVI42, Version 5.14.1, Circle Cardiovascular Imaging Inc., Calgary, Canada). The enhanced myocardium on LGE images was defined as areas with the increased signal intensity of ≥6 standard deviations above the mean of normal myocardium. Six standard deviations were chosen, as it has been previously proved to yield the closest approximation of the extent of LGE identified with visual assessment and is highly reproducible, especially in patients with HCM.9,18,19 LGE extent was defined as the percentage of enhanced myocardium to LV mass. Enhanced myocardium in the insertion point was also considered as LGE and included in the overall extent. All contours were semi-automatically depicted and manually corrected to maintain accuracy and avoid artefacts. All image analyses were performed by two experienced CMR specialists (J.W. and X.C.) blinded to baseline characteristics and clinical outcomes. The image quality was evaluated using a score varying from poor to good (1–3) by two CMR specialists: 1 = blurred image, 2 = fairly satisfactory image, 3 = clear image.20 Blurred images with score of 1 were excluded. Disagreements were resolved by consensus. LV outflow tract gradient was assessed at rest by echocardiography without provocation, and a gradient greater than 30 mmHg was considered as obstruction.
Sudden cardiac death risk and implantable cardioverter defibrillator class of recommendation on current guidelines
We calculated the ESC Risk-SCD score and the ICD-COR for each patient. The Risk-SCD score was calculated using the following formula: 1 − .998(Prognostic Index), where Prognostic index = .15939858 × maximal wall thickness (mm) − .00294271 × maximal wall thickness2 (mm2) + .0259082 × left atrial diameter (mm) + .00446131 × maximal LV outflow tract gradient (mmHg) + .4583082 × family history of SCD + .82639195 × NSVT + .71650361 × unexplained syncope − .01799934 × age at clinical evaluation (years).7 The ICD-COR for SCD primary prevention was assessed for each of the four guidelines, including 2014 ESC, 2022 ESC, 2011 ACC/AHA, and 2020 AHA/ACC guidelines. The ICD-COR was graded into three levels: Class IIa (ICD recommended), Class IIb (ICD may be considered), and Class III (ICD not recommended). Detailed definitions of ICD-COR of the four guidelines are summarized in Supplementary data online, Table S1.2,5,15,17 Abnormal blood pressure response during exercise and sarcomeric mutation were not assessed due to unavailable data.
Clinical follow-up
The primary endpoint was SCD or aborted SCD. SCD was defined as witnessed sudden death or unexpected death within 1 h of new cardiac symptoms or nocturnal deaths in the absence of any progressive cardiac deterioration.21 Aborted SCD was defined as an appropriate ICD shock for ventricular arrhythmia, an episode of ventricular fibrillation or spontaneous sustained ventricular tachycardia causing haemodynamic compromise and requiring cardioversion. Non-sustained ventricular arrhythmias were not considered as aborted SCD. Aborted SCD during follow-up was considered equivalent to SCD.7 All SCD events were adjudicated by physicians blinded to CMR data and confirmed from a combination of medical records, clinical visits, and telephone interviews. Expert electrophysiologists interrogated stored intra-cardiac electrogram data to adjudicate arrhythmias responsible for ICD discharges. ICD shocks were considered appropriate when triggered by ventricular fibrillation or sustained rapid ventricular tachycardia (rate >180/min).14,22,23 The overall survival was defined as the duration between the date of CMR examination and the date of endpoints or last follow-up.
Statistical analysis
Categorical variables were displayed as frequencies (percentages). Continuous variables were displayed as means ± standard deviation or medians (inter-quartile ranges), as appropriate. Normality of distribution was assessed by Kolmogorov–Smirnov test, Q–Q plots, and histogram. Comparisons between two groups were performed using chi-square test, Student’s t-test, and Mann–Whitney U test for categorical, normally distributed, and non-normally distributed continuous variables, respectively. To explore the further risk stratification value of LGE extent, receiver operating characteristic (ROC) curve analysis was used to evaluate the performance of LGE extent for the prediction of SCD. The optimal cut-off point was identified using the Youden index from the ROC curve. An internal validation for the optimal LGE cut-off was performed using bootstrapping with 1000 resamples. C-statistics was calculated for model evaluation. McNemar test was used to compare the sensitivity and specificity of guideline-based models. Comparisons of survival differences between groups were performed using Kaplan–Meier curve along with the log-rank test. Univariable and multivariable Cox proportional hazards regression was performed to identify risk factors for SCD and reported with hazard ratio (HR) and 95% confidence interval (CI). Two multivariable models were built in line with the 2020 AHA/ACC guideline and 2022 ESC guideline. Detailed model validation of the four guidelines and model performance in relation to LGE cut-offs in terms of 5-year follow-up were performed. For sensitivity analysis, the models were also validated in sub-groups of newly diagnosed patients and established patients, respectively. All statistical analyses were conducted using SPSS Statistics (version 24.0, IBM, SPSS Statistics) and R programming language (version 4.2.1, R Foundation for Statistical Computing). A P-value < .05 was considered as statistically significant.
Results
Patient population
A total of 828 patients met the initial inclusion criteria, 54 (6.5%) of whom were lost to follow-up. The baseline characteristics of the 54 patients were similar to the patients enrolled in this cohort (see Supplementary data online, Table S2). The detailed baseline characteristics of the final cohort are shown in Table 1. Among 774 patients, 538 (69.5%) patients were male and the mean age was 48.7 ± 12.4 years. Forty-six (5.9%) patients had a family history of SCD, 107 (13.8%) had unexplained syncope, 72 (9.3%) had NSVT, and 94 (12.1%) were in New York Heart Association Class III/IV. Mean HCM Risk-SCD score was 2.9 ± 2.1%, and median score was 2.3% (1.5%–3.4%).
Baseline characteristics
| All patients (n = 774) | Patients without SCD end point (n = 728) | Patients with SCD end point (n = 46) | P-value | |
|---|---|---|---|---|
| Age (years) | 48.7 ± 12.4 | 48.6 ± 12.4 | 49.0 ± 12.6 | .836 |
| Male sex, n (%) | 538 (69.5) | 501 (68.9) | 37 (80.4) | .097 |
| Body mass index (kg/m2) | 25.5 ± 3.4 | 25.4 ± 3.3 | 25.8 ± 3.9 | .463 |
| Hypertension, n (%) | 279 (36.0) | 256 (35.2) | 23 (50.0) | .042 |
| Diabetes, n (%) | 60 (7.8) | 54 (7.4) | 6 (13.0) | .166 |
| Hyperlipidaemia, n (%) | 211 (27.3) | 196 (26.9) | 15 (32.6) | .401 |
| Family history of SCD, n (%) | 46 (5.9) | 37 (5.1) | 9 (19.6) | < .001 |
| Chest stress, n (%) | 525 (67.8) | 488 (67.0) | 37 (80.4) | .059 |
| Shortness of breath, n (%) | 286 (37.0) | 262 (36.0) | 24 (52.2) | .027 |
| Palpitation, n (%) | 228 (29.5) | 206 (28.3) | 22 (47.8) | .005 |
| Syncope, n (%) | 107 (13.8) | 95 (13.0) | 12 (26.1) | .013 |
| NYHA Class III/IV, n (%) | 94 (12.1) | 79 (10.9) | 15 (32.6) | < .001 |
| Non-sustained VT, n (%) | 72 (9.3) | 58 (8.0) | 14 (30.4) | < .001 |
| Atrial fibrillation, n (%) | 102 (13.2) | 90 (12.5) | 12 (26.1) | .008 |
| 2011 ACC/AHA ICD-COR, n (%) | < .001a | |||
| II | 239 (30.9) | 210 (28.3) | 29 (63.0) | |
| IIa | 234 (30.2) | 205 (23.9) | 29 (63.0) | |
| IIb | 5 (.6) | 5 (.7) | 0 (0) | |
| III | 535 (69.1) | 518 (66.9) | 17 (37.0) | |
| 2014 ESC Risk-SCD score (%) | 2.9 ± 2.1 | 2.8 ± 2.1 | 4.3 ± 2.4 | < .001 |
| ≥6% (IIa), n (%) | 61 (7.9) | 52 (7.1) | 9 (19.6) | |
| ≥4% and <6% (IIb), n (%) | 86 (11.1) | 75 (10.3) | 11 (18.3) | |
| <4% (III), n (%) | 627 (81.0) | 601 (82.6) | 26 (56.5) | |
| 2020 AHA/ACC ICD-COR, n (%) | < .001a | |||
| II | 276 (35.7) | 237 (32.6) | 39 (84.8) | |
| IIa | 224 (28.9) | 192 (26.4) | 32 (69.6) | |
| IIb | 52 (67.2) | 45 (6.2) | 7 (15.2) | |
| III | 498 (64.3) | 491 (67.4) | 7 (15.2) | |
| 2022 ESC ICD-COR, n (%) | < .001a | |||
| II | 208 (26.9) | 173 (23.8) | 35 (76.1) | |
| IIa | 75 (9.7) | 61 (8.4) | 14 (30.4) | |
| IIb | 133 (17.2) | 112 (15.4) | 21 (45.7) | |
| III | 566 (73.1) | 555 (76.2) | 11 (23.9) |
Values are presented as n (%) or mean ± standard deviation. Bold values indicate statistical significance.
SCD, sudden cardiac death; NYHA, New York Heart Association; VT, ventricular tachycardia; ESC, European Society of Cardiology; ICD-COR, implantable cardioverter defibrillator class of recommendation; AHA, American Heart Association; ACC, American College of Cardiology.
aStatistical difference according to the proportion of ICD-COR II patients by chi-square test.
During a mean follow-up period of 7.4 ± 2.5 years (median, 8.17 years), 8 (1.0%) patients received an ICD implantation, and 4 of them had appropriate ICD shocks. A total of 46 (5.9%) patients reached the primary endpoint, of whom 35 (4.5%) patients had SCD, 11 (1.4%) patients had aborted SCD (7 had an episode of ventricular fibrillation or sustained ventricular tachycardia and 4 had appropriate ICD shocks). Patients suffering from SCD were more likely to have a family history of SCD, unexplained syncope, NSVT, AF, New York Heart Association Class III/IV, and higher ESC Risk-SCD scores than patients without SCD (all P < .05). The proportion of ICD-COR II is much higher in patients suffering SCD for all four guidelines (all P < .001). In terms of 5-year follow-up, 31 (4.0%) patients suffered SCD-related events, and patient distribution of ICD-COR in four guideline-based models is shown in Supplementary data online, Table S3.
Cardiac magnetic resonance characteristics
Patients suffering from SCD had higher left atrial diameter (44 ± 9 vs. 39 ± 8 mm, P < .001), LV end-diastolic diameter (51 ± 11 vs. 48 ± 6 mm, P = .02), MWT (25 ± 7 vs. 21 ± 6 mm, P < .001), LV mass index (106.8 ± 56.3 vs. 80.8 ± 34.4 g/m2, P = .003), LV end-diastolic volume index (84.7 ± 44.5 vs. 66.8 ± 17.1 mL/m2, P = .009), and lower LVEF (56.2 ± 17.3 vs. 67.1 ± 8.6%, P < .001) than patients without SCD. Also, SCD patients were more likely to have a higher prevalence of positive LGE (93.5% vs. 59.5%, P < .001) and larger LGE extent (13.7 ± 9.4% vs. 4.9 ± 6.6%, P < .001). Apical aneurysm was observed in six patients, and one of them suffered SCD. All of the six patients were LGE positive with a mean LGE extent of 14.0%. The patient suffering from SCD had an LGE extent of 16.9%, and the others had LGE extent of 4.2%, 5.8%, 9.0%, 23.1%, and 25.0%, respectively. Detailed CMR characteristics are shown in Table 2.
Cardiac magnetic resonance imaging characteristics
| All patients (n = 774) | Patients without SCD end points (n = 728) | Patients with SCD end points (n = 46) | P-value | |
|---|---|---|---|---|
| Left atrial diameter (mm) | 39 ± 8 | 39 ± 8 | 44 ± 9 | < .001 |
| LV end-diastolic diameter (mm) | 48 ± 6 | 48 ± 6 | 51 ± 11 | .020 |
| Maximal wall thickness (mm) | 21 ± 6 | 21 ± 6 | 25 ± 7 | < .001 |
| Maximal wall thickness ≥30 mm | 66 (8.5) | 59 (8.1) | 7 (15.2) | .094 |
| LV mass index (g/m2) | 82.3 ± 36.6 | 80.8 ± 34.4 | 106.8 ± 56.3 | .003 |
| LV EDV index (mL/m2) | 67.9 ± 20.2 | 66.8 ± 17.1 | 84.7 ± 44.5 | .009 |
| LV ESV index (mL/m2) | 23.5 ± 15.7 | 22.4 ± 12.1 | 41.6 ± 39.0 | .002 |
| Stroke volume (mL) | 79.8 ± 20.9 | 79.9 ± 20.3 | 78.2 ± 28.7 | .700 |
| Cardiac index (L/min/m2) | 3.0 ± .9 | 3.0 ± .8 | 3.2 ± 1.4 | .493 |
| LV ejection fraction (%) | 66.5 ± 9.7 | 67.1 ± 8.6 | 56.2 ± 17.3 | < .001 |
| LV ejection fraction <50% | 37 (4.8) | 22 (3.0) | 15 (32.6) | < .001 |
| LVOT gradient (mmHg) | 36 ± 40 18 [8–64] | 36 ± 40 10 [8–64] | 40 ± 46 10 [7–67] | .563 |
| LVOT obstruction, n (%) | 305 (39.4) | 287 (39.4) | 18 (39.1) | .969 |
| Moderate to severe MR, n (%) | 129 (16.7) | 118 (16.2) | 11 (23.9) | .174 |
| Apical aneurysm | 6 (.8) | 5 (.7) | 1 (2.2) | .265 |
| LGE presence, n (%) | 476 (61.5) | 433 (59.5) | 43 (93.5) | < .001 |
| LGE (%) | 5.5 ± 7.1 3.8 [0–7.7] | 4.9 ± 6.6 3.2 [0–7.1] | 13.7 ± 9.4 10.4 [6.7–19.6] | < .001 |
| 0% ≤ LGE < 5% | 457 (59.0) | 452 (58.4) | 5 (10.9) | |
| 5%≤ LGE < 10% | 192 (24.8) | 175 (24.0) | 17 (37.0) | |
| 10% ≤ LGE < 15% | 59 (7.6) | 52 (7.1) | 7 (15.2) | |
| LGE ≥ 15% | 66 (8.5) | 49 (6.7) | 17 (37.0) |
Values are represented as n (%), mean ± standard deviation, or median (inter-quartile range). Bold values indicate statistical significance.
LV, left ventricular; EDV, end-diastolic volume; ESV, end-systolic volume; LVOT, left ventricular outflow tract; MR, mitral regurgitation; LGE, late gadolinium enhancement.
Clinical and magnetic resonance imaging risk factors based on guidelines for sudden cardiac death
The univariable associations between clinical and CMR variables as well as guideline-based ICD-COR with primary endpoint are shown in Supplementary data online, Table S4. When making ICD-COR III as a reference variable, ICD-COR II was associated with an 11-fold and 12-fold increased risk for SCD in 2022 ESC and 2020 AHA/ACC models, respectively; however, only four-fold and five-fold increased risk in 2014 ESC and 2011 ACC/AHA models, respectively.
Then, two models based on guidelines were tested in our cohort (Table 3). Model 1 consisted of Risk-SCD score and three risk factors in line with 2022 ESC guideline: Risk-SCD score (HR 1.19, 95% CI 1.10–1.29, P < .001), LVEF <50% (HR 11.76, 95% CI 5.47–25.27, P < .001), and LGE ≥15% (HR 2.88, 95% CI 1.39–6.00, P = .005) were significantly associated with SCD. Model 2 consisted of seven SCD risk factors in line with 2020 AHA/ACC guideline: unexplained syncope (HR 2.65, 95% CI 1.34–5.26, P = .005), LVEF <50% (HR 8.30, 95% CI 3.61–19.06, P < .001), NSVT (HR 3.08, 95% CI 1.60–5.94, P = .001), and LGE ≥15% (HR 2.75, 95% CI 1.27–5.96, P = .011) were significantly associated with SCD.
Multivariable Cox regression analysis for guideline-based risk factors in predicting SCD-related events
| All patients (N = 774) | Patients without extensive LGE (N = 708) | ||||
|---|---|---|---|---|---|
| Model | HR (95% CI) | P-value | Model | HR (95% CI) | P-value |
| Model 1 with 2022 ESC risk factors | Model 1 with 2022 ESC risk factors | ||||
| ESC Risk-SCD score | 1.19 (1.10–1.29) | < .001 | ESC Risk-SCD score | 1.23 (1.10–1.37) | < .001 |
| Apical aneurysm | 2.58 (.34–19.71) | .360 | Apical aneurysm | .00 (.00-inf) | .978 |
| LVEF <50% | 11.76 (5.47–25.27) | < .001 | LVEF <50% | 12.71 (5.00–32.28) | < .001 |
| LGE ≥15% | 2.88 (1.39–6.00) | .005 | LGE ≥5% | 7.07 (2.66–18.77) | < .001 |
| Model 2 with 2020 AHA/ACC risk factors | Model 2 with 2020 AHA/ACC risk factors | ||||
| Family history of SCD | 1.65 (.72–3.80) | .238 | Family history of SCD | 2.03 (.64–6.47) | .232 |
| MWT ≥30 mm | 1.74 (.75–4.02) | .195 | MWT ≥30 mm | 1.82 (.66–5.03) | .247 |
| Unexplained syncope | 2.65 (1.34–5.26) | .005 | Unexplained syncope | 3.62 (1.60–8.22) | .002 |
| Apical aneurysm | 2.04 (.26–15.89) | .497 | Apical aneurysm | .0 (.00-inf) | .980 |
| LVEF <50% | 8.30 (3.61–19.06) | < .001 | LVEF <50% | 11.10 (3.61–34.12) | < .001 |
| Non-sustained VT | 3.08 (1.60–5.94) | .001 | NSVT | 2.45 (.99–6.05) | .052 |
| LGE ≥15% | 2.75 (1.27–5.96) | .011 | LGE ≥5% | 6.19 (2.27–16.89) | < .001 |
Bold values indicate statistical significance. SCD, sudden cardiac death; LGE, late gadolinium enhancement; HR, hazard ratio; CI, confidence interval; ESC, European Society of Cardiology; LVEF, left ventricular ejection fraction; AHA, American Heart Association; ACC, American College of Cardiology; MWT, maximal wall thickness; VT, ventricular tachycardia.
Validation and comparison of different guideline-based models
The event-free survival differences in patients with different ICD-COR are shown in Figure 1. In 2014 ESC, 2020 AHA/ACC, and 2022 ESC models, ICD-COR III patients had significantly better event-free survival than ICD-COR IIb patients (all P < .001). However, there was no significant difference regarding SCD-free survival between patients with ICD-COR IIa and IIb. In view of this, ICD-COR IIa and IIb were merged into ICD-COR II in the following analysis. Significant survival differences among the three groups were also observed in four guideline-based models in terms of 5-year follow-up (all P < .001) (see Supplementary data online, Figure S1).
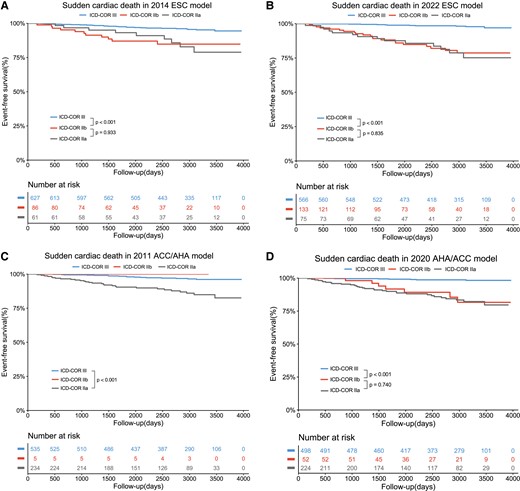
Kaplan–Meier analysis with log-rank test for SCD events by different ICD-COR in 2014 ESC model (A), 2022 ESC model (B), 2011 ACC/AHA model (C), and 2020 AHA/ACC model. ESC, European Society of Cardiology; ACC, American College of Cardiology; AHA, American Heart Association; ICD, implantable cardioverter defibrillator; COR, class of recommendation.
The prediction performances of the four guideline-based models are shown in Figure 2 and Table 4. Compared with 2014 ESC model, 2022 ESC model showed increased AUC (.76 vs. .63), C-statistics (.78 vs. .64), sensitivity (76.1% vs. 43.5%), positive predictive value (PPV) (16.8% vs. 13.6%), and negative predictive value (NPV) (98.1% vs. 95.9%). The overall discrimination performance was similar between the 2022 ESC and 2020 AHA/ACC models (AUC .76 vs. .76, C-statistics .78 vs. .76). However, 2022 ESC model showed higher specificity (76.2% vs. 67.4%, P < .001); 2020 AHA/ACC model showed relatively higher sensitivity, despite the difference failing to reach statistical significance (84.8% vs. 76.1%, P = .219). In terms of 5-year follow-up, the C-statistics of 2011 ACC/AHA, 2014 ESC, 2020 AHA/ACC, and 2022 ESC models were .696, .640, .768, and .784, respectively. Detailed model performance for 5-year follow-up is shown in Supplementary data online, Table S5.
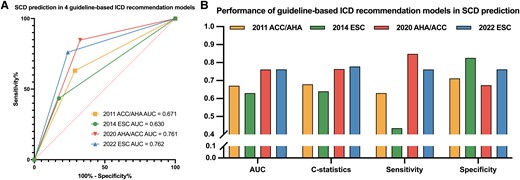
Model evaluation for four guideline-based ICD recommendation models for the prediction of SCD. 2022 ESC model showed better performance for SCD prediction than 2014 ESC model with higher AUC and C-statistics, especially improved sensitivity and slightly decreased specificity (A, B). Overall performance was similar between 2022 ESC model and 2020 AHA/ACC model, while the former was more specific, and the latter was more sensitive (B). SCD, sudden cardiac death; ICD, implantable cardioverter defibrillator; AUC, area under the curve; ESC, European Society of Cardiology; ACC, American College of Cardiology; AHA, American Heart Association.
Performance of guideline-based ICD recommendation models in predicting SCD events
| Model | Patients with ICD-COR II, n (%) | AUC | C-index | Sensitivity (%) | Specificity (%) | PPV (%) | NPV (%) |
|---|---|---|---|---|---|---|---|
| 2011 ACC/AHA | 239 (30.9) | .67 | .68 | 63.0 | 71.2 | 12.1 | 96.8 |
| 2014 ESC | 147 (19.0) | .63 | .64 | 43.5 | 82.6 | 13.6 | 95.9 |
| 2020 AHA/ACC | 276 (35.7) | .76 | .76 | 84.8 | 67.4 | 14.1 | 98.6 |
| 2022 ESC | 208 (26.9) | .76 | .78 | 76.1 | 76.2 | 16.8 | 98.1 |
AUC, area under curve; PPV, positive predictive value; NPV, negative predictive value. ESC, European Society of Cardiology; ACC, American College of Cardiology; AHA, American Heart Association; ICD-COR, implantable cardioverter defibrillator class of recommendation.
Further sudden cardiac death risk stratification of late gadolinium enhancement based on 2020 AHA/ACC and 2022 ESC guidelines
From the ROC curve of LGE extent for SCD prediction (Figure 3), the cut-off of 5.78% showed the highest Youden index with a sensitivity of 84.8% and a specificity of 67.2%. Internal validation by 1000 times Bootstrap resampling revealed that the mean LGE value of the optimal cut-off was 5.43 ± 1.52%, and the median was 5.66% (3.55%–5.81%). Therefore, considering the above findings and clinical practicality, the integer 5% was determined as the optimal cut-off. Additionally, the 5% LGE cut-off showed the highest AUC and C-statistics compared with other cut-offs, including 0%, 10%, and 15% (see Supplementary data online, Table S6). Then, instead of LGE ≥15%, a dichotomous variable of LGE ≥5% was used to construct the two models based on updated AHA/ACC and ESC guidelines in patients with non-extensive LGE, as shown in Table 3. In model 1, LGE ≥5% is responsible for a seven-fold risk of SCD. In model 2, LGE ≥5% is responsible for a six-fold risk of SCD. In Kaplan–Meier analysis, patients with 0% < LGE < 5% had similar event-free survival to patients with LGE = 0% (P = .76); patients with 5% ≤ LGE < 10% had worse event-free survival than patients with 0% < LGE <5% (P = .002); patients with 10% ≤ LGE < 15% had similar event-free survival to 5% ≤ LGE < 10% patients (P = .42); and patients with LGE ≥15% had worse event-free survival than 10%≤ LGE <15% patients (P = .03) (Figure 3).
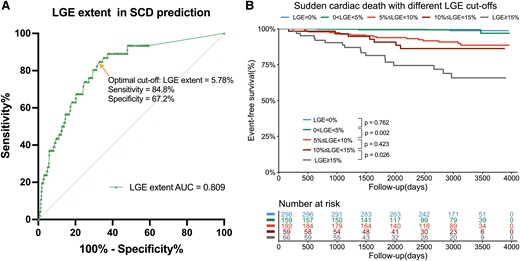
Further risk stratification value of LGE extent for SCD. ROC and Youden index analysis showed the optimal cut-off for LGE was 5.78% of LV mass for the prediction of SCD with a sensitivity of 84.8% and specificity of 67.2% (A). Kaplan–Meier analysis with log-rank test for SCD-related events between groups with different LGE extent. LGE, late gadolinium enhancement; SCD, sudden cardiac death; LV, left ventricular.
To simplify, five groups with different LGE extent were divided into three groups (LGE <5%, 5% ≤ LGE < 15%, and LGE ≥15%) in the following analysis. Next, the utilities of LGE in further risk stratification over to 2020 AHA/ACC and 2022 ESC models are displayed in Figure 4. In patients with 2022 ESC ICD-COR II, patients with LGE <5% had more favourable outcomes than patients with 5% ≤ LGE < 15% (P = .035), as well as in patients with 2022 ESC ICD-COR III (P < .001). Similarly, as compared with 5% ≤ LGE < 15% patients, LGE <5% patients also exhibited more favourable outcomes for SCD in 2020 AHA/ACC ICD-COR II (P = .003) and ICD-COR III (P < .001). Furthermore, when combined with LGE 5% cut-off, the C-statistics for 2020 AHA/ACC and 2022 ESC models increased from .764 to .840 and from .778 to .847, respectively. In terms of 5-year follow-up, a 5% cut-off also enabled further risk stratification (see Supplementary data online, Figure S2). In ICD-COR III, patients with 5% ≤ LGE < 15% showed significantly worse prognosis than patients with LGE <5% (all P < .05). In ICD-COR II, significantly survival differences were also observed between patients with different LGE extent (all P < .05). When combined with LGE 5% cut-off, the C-statistics for 2020 AHA/ACC and 2022 ESC models increased from .768 to .844 and from .784 to .855, respectively.
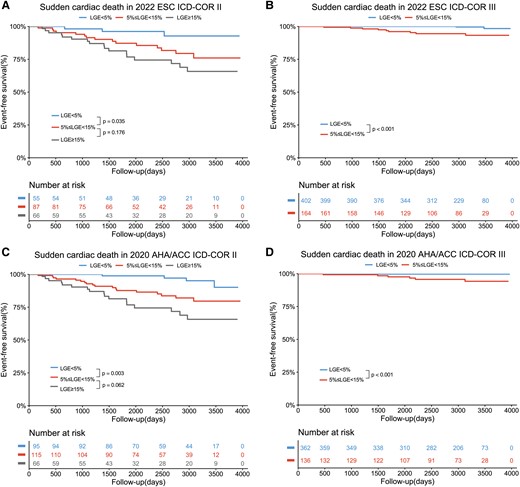
LGE with the cut-off of 5% enabled further risk stratification of sudden cardiac death over up to the ICD recommendation algorithm by 2022 ESC (A, B) and 2020 AHA/ACC guidelines (C, D). ESC, European Society of Cardiology; ACC, American College of Cardiology; AHA, American Heart Association; ICD, implantable cardioverter defibrillator; COR, class of recommendation.
Detailed patient numbers and incidence rates of SCD for each sub-group are shown in Figure 5 and Supplementary data online, Figure S3. Importantly, ICD-COR III patients with LGE <5% had extremely low SCD incidence in both 2022 ESC model (.5%) and 2020 AHA/ACC model (.3%). However, the SCD incidence in ICD-COR III patients with 5% ≤ LGE < 15% increased to 5.5%, the same incidence as in ICD-COR II patients with LGE <5% in 2022 ESC model. In 2022 ESC ICD-COR II, the SCD incidences in patients with LGE <5%, 5% ≤ LGE < 15%, and LGE ≥15% were 5.5%, 17.2%, and 25.8%, respectively.
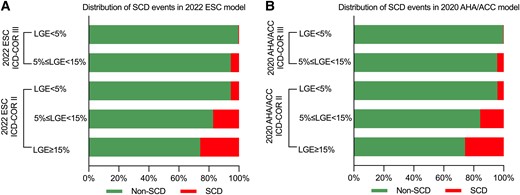
Distribution histogram of SCD events according to 2022 ESC (A) and 2020 AHA/ACC (B) models and different LGE extent. SCD, sudden cardiac death; ESC, European Society of Cardiology; AHA, American Heart Association; ACC, American College of Cardiology; LGE, late gadolinium enhancement.
Sensitivity analysis
In 343 newly diagnosed patients, the C-statistics for 2011 ACC/AHA, 2014 ESC, 2020 AHA/ACC, and 2022 ESC models for SCD prediction were .633, .676, .791, and .809, respectively. In 431 established patients, the C-statistics for 2011 ACC/AHA, 2014 ESC, 2020 AHA/ACC, and 2022 ESC models for SCD prediction were .729, .610, .746, and .754, respectively. 2022 ESC model showed higher sensitivity than 2014 ESC model, whether in newly diagnosed patients (73.3% vs. 45.5%) or in established patients (75.0% vs. 41.7%). Details on model performance are shown in Supplementary data online, Table S7. In Kaplan–Meier analysis, there were significant survival differences among ICD-COR IIa, IIb, and III groups, whether in newly diagnosed patients or established patients (all P < .05) (see Supplementary data online, Figures S4 and S5).
Discussion
In this study, we externally validated the performance of the new 2022 ESC model and other guideline-based models for SCD risk stratification in a Chinese cohort and further explored the utility of LGE in further risk stratification based on current guidelines. Compared with 2014 ESC model, the new 2022 ESC model showed comprehensively improved performance in SCD risk stratification with especially increased sensitivity. The overall discrimination performance was similar between 2022 ESC and 2020 AHA/ACC models. Notably, compared with ICD-COR III, ICD-COR II was responsible for the 11-fold risk of SCD according to 2022 ESC model. Additionally, we found that LGE with a cut-off of 5% enabled further risk stratification for SCD, whether in ICD-COR III or ICD-COR II patients based on current guidelines. In particular, ICD-COR III patients with LGE <5% had an extremely low incidence of SCD. Besides, LGE ≥5% was responsible for the seven-fold risk of SCD in patients with non-extensive LGE (Structured Graphical Abstract).
Improvement of new 2022 ESC model
The HCM Risk-SCD score was proposed in 2014 by O’Mahony et al.7 It has been advocated as a rigid mathematical model worldwide and provides individualized estimates for the probability of SCD using readily collected clinical parameters.4 Although the 2014 ESC model discriminates better between patients with high or low SCD risk than the risk stratification models proposed by older clinical guidelines, its sensitivity and overall performance remain to be raised to a higher level.8,24,25 Nowadays, with the emergence of new evidence-based markers, including extensive LGE, LV systolic dysfunction, and apical aneurysm, the new 2022 ESC model with updated ICD-COR algorithm was proposed by 2022 ESC guideline.5
In our data, the new 2022 ESC model performed much better than 2014 ESC model, as evidenced by the increase in C-statistics and AUC. In particular, the sensitivity was improved from 43.5% to 76.1% with merely slightly decreased specificity. Also, both PPV and NPV were increased. As the predictive values depend on the prevalence of the endpoint in the study population, and because the prevalence of our SCD endpoint is relatively low (5.9%), the NPV will be higher, and the PPV will be lower. Importantly, the increased predictive values indicated that more high-risk patients would correctly receive an appropriate ICD therapy without leaving too many low-risk patients exposed to unnecessary implantation and long-term complications of ICD. The great improvement in SCD prediction attributed to the new markers highlights the utility of high-risk imaging features in SCD risk stratification. Furthermore, 2022 ESC model showed similar overall discrimination performance with slightly higher C-statistics and higher specificity compared with 2020 AHA/ACC model, while the latter was more sensitive. This finding was consistent with a previous study reporting that primary prevention ICDs were more frequently implanted, accompanied by a lower rate of appropriate ICD therapy in HCM patients in the US than those in non-US sites.26 Additionally, the higher sensitivity of 2020 AHA/ACC model was also reported by a previous study by Qi et al.27 They demonstrated that 2020 AHA/ACC model showed higher C-statistics than 2022 ESC model (.68 vs. .65) during a relatively short median follow-up of 43 months; whereas, the ESC model had the highest C-statistics of .78 based on our cohort with a median follow-up of 8.17 years. However, no risk stratification model could predict all SCD incidents. Despite the discrepancy, both of the two well-established models were expected to complement clinical reasoning and should be taken into consideration when making decisions about prophylactic ICD together with each fully informed patient and their family members.
Another important finding is that there was no survival difference between ICD-COR IIa and IIb patients in all four guideline-based models, although ICD-COR IIa and IIb patients had worse prognosis than ICD-COR III patients, as expected. Therefore, both ICD-COR IIa and IIb patients should be carefully monitored.
LGE threshold and further risk stratification
Although LGE presence is associated with higher SCD risk, it may be inadequate to serve as a reasonable criterion for ICD placement in clinical practice due to its high prevalence of ∼60% and consequently low PPV. Nowadays, LGE ≥15% was the first cut-off supported by solid evidence and subsequently introduced in the 2022 ESC and 2020 AHA/ACC guidelines.9,10 In our data, LGE ≥15% was associated with a three-fold SCD risk after adjustment for other risk factors. However, given that only patients with extensive LGE were regarded as appropriate candidates by current guidelines, patients with LGE <15% would be theoretically regarded as low-risk and left unprotected without ICDs. A further cut-off is warranted to refine risk stratification. As observed in our study, LGE =0% and LGE <5% patients had similar and favourable prognosis. Besides, the optimal LGE cut-off was 5.78% with a sensitivity of 84.8% and specificity of 67.2%. Thus, the cut-off of 5% was chosen to investigate further risk stratification. Then we found that, in patients without extensive LGE, LGE ≥5% of LV mass was responsible for a seven-fold risk for SCD events compared with patients with no LGE or LGE <5%, suggesting that the risk of malignant arrhythmia significantly increases once the amount of fibrosis exceeds 5%. This finding aligned with a previous study by Greulich et al., who also advocated that patients with >5% LGE should be carefully monitored and might be adequate candidates for primary prevention ICD.28 Additionally, patients in their cohort had a low 5-year risk for SCD with a median Risk-SCD score of 1.84%, indicating the prognostic utility of a 5% cut-off in low-risk patients.
However, focusing solely on LGE itself is one-sided and may result in deviation from clinical practice. Therefore, we attempted to exploit the additional risk stratification value of the 5% cut-off for LGE based on current guidelines. For 2022 ESC guideline, the SCD incidence in ICD-COR III patients with LGE <5% was only .5%, which is extremely low, highlighting the NPV of LGE <5%. Yet the SCD incidence increased to 5.5% in patients with ICD-COR III but LGE ≥5%, while these patients would be regarded as low-risk and unprotected by ICDs. Besides, in ICD-COR II, the SCD incidence increased sequentially in patients with LGE <5% (5.5%), 5%≤ LGE <15% (17.2%), and LGE ≥15% (25.8%), reflecting the further risk stratification value of LGE in high-risk patients requiring primary prevention ICD. Similar results were also found in the 2020 AHA/ACC model. Thus, we suggested that the fibrosis burden of more than 5% may be responsible for a significant increase in SCD risk in HCM. Additionally, patients with ICD-COR III but LGE ≥5% even had the same SCD incidence of 5.5% as patients with ICD-COR II but LGE <5%. In brief, whether or not patients were considered as appropriate candidates for ICD placement by current guidelines, the cut-off of 5% for LGE might provide additional relevant information and have the potential to enhance the shared decision-making process.
Limitations
This is a retrospective observational study in a Chinese tertiary referral centre. There might be potential selection bias and the patient population might not represent the general HCM population worldwide. However, based on the platform of the National Center of Cardiovascular Diseases, our cohort is more representative of the Chinese or Asian population, which could be a compensation to this field given that most guideline-related studies focus on populations in North America, Europe, etc. The referral process in China is not as strict as North American or European countries, and Chinese patients can freely choose local hospitals or tertiary hospitals based on their own demand. Such a relatively flexible referral system may reduce the referral bias of our study to some extent. Sarcomeric mutation and abnormal blood pressure during exercise are two of criteria for ICD recommendation in 2022 ESC guideline and 2011 ACC/AHA guideline, while these two markers were not available in our study, leaving ICD-COR underestimated in some patients. Nonetheless, a recent comment reported that these two markers currently lack solid evidence to prove their independent association with SCD.4 Further studies are required to address this issue. LV outflow tract gradient was only assessed at rest by echocardiography without provocation, which may result in an overall underestimation of the Risk-SCD score in the entire population. Besides, patients with previous malignant ventricular arrhythmia were excluded due to less ambiguity in the decision-making of ICD placement for SCD secondary prevention. In this way, we can focus on the primary prevention of SCD. In addition, the small number of patients with apical aneurysms limited its statistical power. Last, we did not include T1 mapping and extracellular volume fraction since few patients received mapping examinations for the limited technical conditions 10 years ago. Future studies are needed to explore the utility of CMR mapping in long-term prognosis.
Conclusion
The new 2022 ESC model showed better performance for SCD risk stratification with especially improved sensitivity than 2014 ESC model. The overall discrimination performance was similar between 2022 ESC and 2020 AHA/ACC models. Moreover, a cut-off of 5% LGE provided further risk stratification over to the current ICD recommendation algorithms. In particular, ICD-COR III patients with LGE <5% had an extremely low incidence of SCD. Besides, LGE ≥5% was responsible for the seven-fold risk of SCD in patients with non-extensive LGE. The benefits and risks of ICD implantation should be carefully evaluated in patients with LGE ≥5%.
Acknowledgements
The authors would like to thank all the colleagues at MR Center, Fuwai Hospital, and Dr Jiayu Feng for his assistance in the statistical analysis
Supplementary data
Supplementary data are available at European Heart Journal online.
Declarations
Disclosure of Interest
All authors declare no conflict of interest for this contribution.
Data Availability
The data that support the findings of this study are available from the corresponding author upon reasonable request.
Funding
This study was supported by the National Key Research and Development Program of China (Nos. 2021YFF0501400 and 2021YFF0501404), the Key Project of National Natural Science Foundation of China (No. 81930044), and the China International Medical Foundation (No. Z-2014-07-2101).
Ethical Approval
Ethical approval was not required.
Pre-registered Clinical Trial Number
None supplied.
References
Author notes
Jiaxin Wang and Shujuan Yang contributed equally to this study.

