


Abstract
The authors investigated the impact of smoking and its cessation after percutaneous coronary intervention (PCI) on cardiovascular outcomes.
Using a nationwide database from the Korean National Health Insurance System, 74 471 patients undergoing PCI between 2009 and 2016 were classified as non-, ex-, or current smokers, depending on smoking status at the first health check-up within 1 year after PCI. The primary outcome was major adverse cardiovascular and cerebrovascular event (MACCE), a composite of all-cause death, myocardial infarction, coronary revascularization, and stroke.
During 4.0 years of follow-up, current smokers had a 19.8% higher rate of MACCE than non-smokers [adjusted hazard ratio (aHR) 1.198; 95% confidence interval (CI) 1.137–1.263], and ex-smokers tended to have a comparable rate with that of non-smokers (aHR 1.036; 95% CI .992–1.081). For 31 887 patients with both pre- and post-PCI health check-up data, the effects of smoking cessation were analysed. Among quitters who stopped smoking after PCI, quitters with cumulative smoking exposure of <20 pack-years (PYs) tended to have a comparable rate of MACCE with that of persistent non-smokers. However, the rate in quitters with cumulative exposure of ≥20 PYs was comparable with that of persistent smokers [aHR (95% CI) for <10 PY, 1.182 (.971–1.438); 10–20 PYs 1.114 (.963–1.290); 20–30 PYs 1.206 (1.054–1.380); ≥ 30 PYs 1.227 (1.113–1.352); persistent smokers 1.223 (1.126–1.328), compared with persistent non-smokers, respectively, P for interaction <.001].
Smoking is associated with a higher risk of adverse outcomes in patients undergoing PCI. Quitters after PCI with <20 PYs were associated with a risk comparable with that of non-smokers.
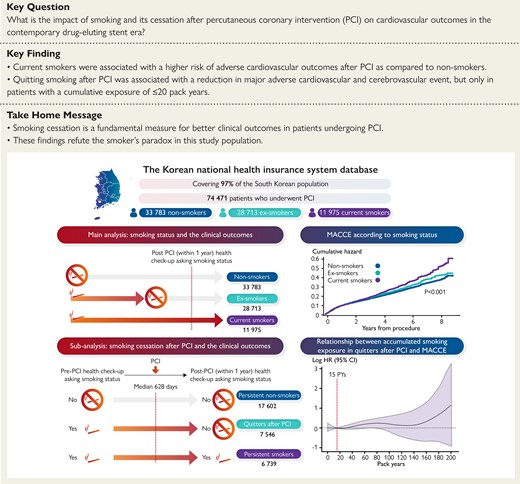
Left upper: a scheme for main analysis of smoking status and clinical outcomes. Left lower: a scheme for sub-analysis of smoking cessation after PCI and clinical outcomes. Right upper: MACCE according to smoking status. Right lower: relationship between accumulated smoking exposure in quitters after PCI and MACCE. CI, confidence interval; HR, hazard ratio; MACCE, major adverse cardiovascular and cerebrovascular event; PCI, percutaneous coronary intervention; PY, pack-year.
See the editorial comment for this article ‘Where there is smoke there is risk: is there an irreversible threshold?’, by X. Garcia-Moll, https://doi.org/10.1093/eurheartj/ehad685.
Introduction
Tobacco smoking kills more than 8 million people a year worldwide, and second-hand smoking of non-smokers accounts for 15% of these deaths.1 Among adults aged 30–44 years who died from ischaemic heart disease, 38% of the deaths were attributed to tobacco.2 Tobacco consumption exposes smokers to harmful substances, including nicotine, carbon monoxide (CO), and free radicals.3 These substances considerably impact endothelial function, atherogenesis, and thrombosis. Smoking is one of the worst addictive habits and a modifiable and preventable risk factor for cardiovascular disease (CVD).4 Smoking cessation is a fundamental preventive measure, but it is easily overlooked in contrast to other risk factors, such as hypertension (HTN), diabetes mellitus (DM), and dyslipidaemia.5–7
Although several previous studies have investigated the impact of smoking on the clinical outcomes of patients undergoing coronary revascularization,8–11 there has been no large-scale population-based study on this subject, particularly in the contemporary drug-eluting stent (DES) era. Furthermore, because changes in smoking habits before and after the procedure were not counted in most previous studies, the impact of smoking cessation after percutaneous coronary intervention (PCI) has not been fully investigated.
We aimed to reveal the effects of smoking status before and after PCI on long-term clinical outcomes using a large-scale population database from the Korean National Health Insurance System (NHIS).
Methods
Data source and study subjects
We analysed data from the Korean NHIS database. The NHIS comprises several data sub-sets for people’s health information in the Republic of Korea, including qualifications, claims, health check-ups, and death information. This database provides baseline demographics, diagnostic codes for diseases, use of inpatient and outpatient services, medication prescription information, and mortality data. The NHIS is a single insurer in the Republic of Korea and covers 97% of the Korean population. All Koreans enrolled in the NHIS are encouraged to undergo regular health check-ups at least every 2 years. Among the 360 379 patients who underwent PCI between 1 January 2009 and 31 December 2016, 88 413 patients underwent regular health check-ups within 1 year after the index PCI. To avoid confounding by pre-existing diseases, those who had a history of stroke [International Classification of Diseases, Tenth revision (ICD-10) I63, I64] within 1 year of the index PCI (n = 8247) or patients who underwent redo PCI before the first regular health check-up (n = 2777) were excluded. After excluding patients with missing data regarding tobacco consumption (n = 2918), the study population consisted of 74 471 individuals (Figure 1). These 74 471 patients were classified into non-, ex-, or current smokers according to smoking status at the first health examination within 1 year after the index PCI. Baseline characteristics of the total, enrolled, and excluded populations are presented in Supplementary data online, Table S1. The follow-up period was from the first regular health check-up after revascularization to the date of major adverse cardiovascular and cerebrovascular event (MACCE) or death or to 31 December 2017 in the absence of clinical events. To determine the effects of smoking cessation after PCI, we analysed the data from 31 887 patients whose pre- and post-PCI health check-up data (median duration between the two health check-ups: 628 days, interquartile range 390–740 days) were available, excluding patients who stopped smoking before the index PCI and patients who newly started smoking after the index PCI. We excluded these patients because in this analysis we sought to elucidate the clinical outcomes of quitters who stopped smoking after PCI, compared with a pure control group who had never smoked. This study was conducted in accordance with the Declaration of Helsinki and was approved by the Institutional Review Board of Seoul National University Hospital.
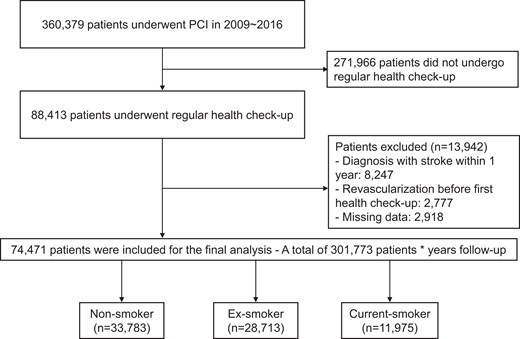
Study flow chart. PCI, percutaneous coronary intervention.
Measurements and definitions
Smoking and smoking cessation were the exposure variables of this study. The potential confounders were age, sex, HTN, DM, dyslipidaemia, body mass index (BMI), social income, regular exercise, alcohol drinking status, myocardial infarction (MI), heart failure, and medications (aspirin, clopidogrel, potent P2Y12 inhibitors, and statin). Information on current smoking status and alcohol consumption was obtained using a self-reported questionnaire. The questionnaire provided the following information: (i) categorical data about smoking status (non-smoker, ex-smoker, and current smoker) and (ii) smoking exposure (<10 cigarettes per day, between 10 and 19 cigarettes per day, and ≥ 20 cigarettes per day). A person’s accumulated exposure to tobacco was quantified in pack-years (PYs), calculated by multiplying the number of cigarettes smoked per day by the number of years of smoking maintenance. If the patient was an ex-smoker, previous smoking exposure was measured using PYs. Alcohol consumption status was classified as non-drinker, within-the-guideline drinker, or above-the-guideline drinker. Above-the-guideline drinking was defined as more than one standard drink daily (8 g of alcohol) in women and two drinks (16 g of alcohol) in men. Those who did not meet the above criteria were classified as within-the-guideline drinkers. Body mass index was calculated as the body weight in kilograms divided by the square of body height in meters. Patients were categorized as per BMI to have low weight (BMI <18.5 kg/m2), normal weight (18.5 to <23 kg/m2), overweight (23.0 kg/m2 to <25.0 kg/m2), mild obesity (25.0 kg/m2 to <30.0 kg/m2), and morbid obesity (≥30.0 kg/m2). Regular exercise was defined as either exercising ≥5 times a week with moderate intensity or ≥3 times a week with high intensity.
Outcomes
The primary outcome was MACCE, a composite of all-cause death, MI, coronary revascularization, and stroke. The secondary outcomes were the individual elements of the MACCE. Myocardial infarction was defined using a combination of ICD-10 codes I21 or I22 and procedural codes for coronary revascularization. Coronary revascularization was defined using procedural codes for coronary revascularization and coronary artery bypass graft surgery. Stroke was defined using the combination of ICD-10 codes I63 or I64 with hospitalization and claims for relevant imaging studies, such as brain computed tomography and magnetic resonance imaging. The outcomes were stratified by smoking status (non-, ex-, or current smokers) or by smoking cessation after the index PCI (persistent non-smokers, quitters after PCI, or persistent smokers).
Statistical analysis
All numerical data are expressed as mean ± standard deviation for continuous variables and percentages for categorical variables. The incidence rate of each outcome was calculated as the number of events divided by the follow-up duration (per 1000 person-years). The first event was counted if the combined endpoints occurred in a patient. Cumulative hazard curves according to smoking status were established by the Nelson–Aalen estimation method.12 Multivariable Cox proportional hazards regression analyses adjusting for age, sex, HTN, DM, dyslipidaemia, BMI, social income, regular exercise, alcohol drinking status, MI, heart failure, and medications (aspirin, clopidogrel, potent P2Y12 inhibitors, and statin) were performed to estimate adjusted hazard ratios (aHRs) and the corresponding 95% confidence intervals (CIs) for the association between smoking status and clinical outcomes. To reduce the impact of potential confounding factors, we also used an inverse probability-weighted (IPW) Cox regression with a robust variance estimator. The probability was calculated using a multinomial logistic regression model with age, sex, HTN, DM, dyslipidaemia, BMI, social income, regular exercise, alcohol drinking status, MI, heart failure, and medications. Maximum absolute standardized difference (ASD) of <10% was considered a satisfactory covariate balance (see Supplementary data online, Table S2). To identify the dose relationship between accumulated smoking exposure and the occurrence of the primary outcome after smoking cessation, the patient groups were classified with an inter-group difference of 10 PYs. The persistent non-smoker group was regarded as the reference group. Restricted cubic splines were constructed to evaluate the non-linear relationship between PYs of quitters and the clinical outcomes. In the sub-group analysis, the aHRs and 95% CIs of the ex- or current smoker group were compared with those of the non-smoker group. A two-sided value of P < .05 was considered significant for all probability values. Statistical analyses were performed using SAS version 9.4 (SAS Institute, Cary, NC, USA).
Results
Baseline characteristics of the study population
In total, 74 471 patients were included in the analysis. The database showed that 97.8% of patients undergoing PCI between 2009 and 2016 received DES. According to the self-reported smoking status at the first health check-up after the index PCI, the patients were classified into the following three groups: 33 783 (45.4%) non-smokers, 28 713 (38.5%) ex-smokers, and 11 975 (16.1%) current smokers. The mean age of the study cohort was 62.5 ± 10.6 years, and 56 423 patients (75.8%) were men. The baseline characteristics of each group are presented in Table 1. Non-smokers were older, were more likely to be female, and had a higher prevalence of HTN. Ex-smokers had a lower prevalence of DM and were less likely to have a lower income. Current smokers were younger, had a higher prevalence of DM, and were more likely to have lower incomes. They also had higher fasting glucose, total cholesterol, and triglyceride levels. A higher proportion of ex-smokers exercised regularly, whereas a lower proportion of current smokers did. Despite frequent exercise, ex-smokers had a higher obesity (BMI ≥25 kg/m2) rate and larger waist circumference.
Baseline characteristics
| Total (n = 74 471) | Non-smokers (n = 33 783) | Ex-smokers (n = 28 713) | Current smokers (n = 11 975) | P value | |
|---|---|---|---|---|---|
| Age, years | 62.5 ± 10.6 | 66.0 ± 9.9 | 60.1 ± 10.4 | 58.1 ± 10.0 | <.001 |
| Age | <.001 | ||||
| ≤39 | 1070 (1.4) | 178 (.5) | 569 (2.0) | 323 (2.7) | |
| 40–64 | 40 992 (55.1) | 14 047 (41.6) | 18 358 (63.9) | 8587 (71.7) | |
| ≥65 | 32 409 (43.5) | 19 558 (57.9) | 9786 (34.1) | 3065 (25.6) | |
| Male | 56 423 (75.8) | 16 705 (49.5) | 28 235 (98.3) | 11 483 (95.9) | <.001 |
| Hypertension | 64 301 (86.3) | 29 788 (88.2) | 24 417 (85.0) | 10 096 (84.3) | <.001 |
| Diabetes mellitus | 25 951 (34.9) | 12 167 (36.0) | 9361 (32.6) | 4423 (36.9) | <.001 |
| Dyslipidaemia | 69 783 (93.7) | 31 488 (93.2) | 27 062 (94.3) | 11 233 (93.8) | <.001 |
| Heart failure | 5089 (6.8) | 2617 (7.8) | 1757 (6.1) | 715 (6.0) | <.001 |
| Diagnosed with MI | 28 366 (38.1) | 10 712 (31.7) | 12 204 (42.5) | 5450 (45.5) | <.001 |
| Alcohol drinking status | <.001 | ||||
| Non-drinker | 51 712 (69.4) | 28 773 (85.2) | 16 742 (58.3) | 6197 (51.8) | |
| Within-the-guideline drinkers | 20 037 (26.9) | 4593 (13.6) | 10 648 (37.1) | 4796 (40.1) | |
| Above-the-guideline drinkers | 2722 (3.7) | 417 (1.2) | 1323 (4.6) | 982 (8.2) | |
| Regular exercise | 17 442 (23.4) | 6910 (20.5) | 8291 (28.9) | 2241 (18.7) | <.001 |
| Low income (lower quintile) | 12 420 (16.7) | 5699 (16.9) | 4274 (14.9) | 2447 (20.4) | <.001 |
| BMI, kg/m2 | <.001 | ||||
| Underweight (<18.5) | 994 (1.3) | 512 (1.5) | 271 (.9) | 211 (1.8) | |
| Normal weight (18.5–22.9) | 18 971 (25.5) | 9179 (27.2) | 6511 (22.7) | 3281 (27.4) | |
| Overweight (23.0–24.9) | 20 525 (27.6) | 9359 (27.7) | 8054 (28.1) | 3112 (26.0) | |
| Obese (25.0–29.9) | 30 383 (40.8) | 13 210 (39.1) | 12 496 (43.5) | 4677 (39.1) | |
| Morbidly obese (≥30.0) | 3598 (4.8) | 1523 (4.5) | 1381 (4.8) | 694 (5.8) | |
| Height, cm | 163.5 ± 8.8 | 159.0 ± 9.2 | 167.4 ± 6.2 | 167.0 ± 6.7 | <.001 |
| Weight, kg | 66.5 ± 11.1 | 62.5 ± 10.6 | 70.1 ± 10.1 | 69.1 ± 11.3 | <.001 |
| Waist circumference, cm | 85.5 ± 8.0 | 84.2 ± 8.2 | 86.8 ± 7.6 | 86.3 ± 8.1 | <.001 |
| Laboratory findings | |||||
| Haemoglobin, g/dL | 13.8 ± 1.6 | 13.3 ± 1.6 | 14.2 ± 1.4 | 14.5 ± 1.5 | <.001 |
| Fasting glucose, mg/dL | 111.2 ± 35.1 | 110.9 ± 35.6 | 110.7 ± 33.2 | 113.6 ± 38.2 | <.001 |
| Total cholesterol, mg/dL | 150.0 ± 35.2 | 151.7 ± 35.7 | 146.6 ± 33.1 | 153.1 ± 37.9 | <.001 |
| Triglyceride, mg/dL, median (IQR) | 116.6 (116.2, 117.0) | 111.4 (110.8, 111.9) | 116.4 (115.7, 117.1) | 133.1 (131.8, 134.4) | <.001 |
| Blood pressure | |||||
| Systolic blood pressure, mmHg | 125.9 ± 15.7 | 127.6 ± 16.3 | 124.8 ± 14.9 | 123.5 ± 15.0 | <.001 |
| Diastolic blood pressure, mmHg | 76.3 ± 10.0 | 76.4 ± 10.2 | 76.2 ± 9.8 | 76.1 ± 10.0 | .002 |
| Medications at 1 month after procedure | |||||
| Aspirin | 73 254 (98.4) | 33 210 (98.3) | 28 323 (98.6) | 11 721 (97.9) | <.001 |
| Clopidogrel | 69 574 (93.4) | 31 950 (94.6) | 26 682 (92.9) | 10 942 (91.4) | <.001 |
| Statin | 72 245 (97.0) | 32 673 (96.7) | 27 985 (97.5) | 11 587 (96.8) | <.001 |
Figures are numbers (percentage) of patients for categorical variables or mean ± standard deviation for continuous variables, unless stated otherwise.
BMI, body mass index; IQR, interquartile range; MI, myocardial infarction.
Smoking status and clinical outcomes
During a median follow-up of 4.0 years, the incidence of MACCE was 19.3% (n = 14 408), including 4340 (5.8%) deaths, 1605 (2.2%) MI, 2189 (2.9%) strokes, and 9452 (12.7%) revascularization. Multivariable-adjusted Cox proportional hazards analysis demonstrated that current smokers were significantly associated with a higher rate of MACCE (aHR 1.198; 95% CI 1.137–1.263), and ex-smokers tended to have a comparable rate of MACCE with that of non-smokers (aHR 1.036; 95% CI .992–1.081). Inverse probability-weighted analysis showed a similar tendency with a borderline higher rate of MACCE in ex-smokers compared with non-smokers (aHR 1.084; 95% CI 1.047–1.123) (Table 2). Nelson–Aalen plot for cumulative hazard estimate of MACCE according to smoking status also showed a similar tendency (Figure 2). The above results were mainly driven by a significantly higher rate of all-cause death in current smokers than non-smokers (aHR 1.606; 95% CI 1.465–1.760) (Table 2). In addition, other outcomes, such as MI, stroke, and revascularization, showed similar trends (Table 2).
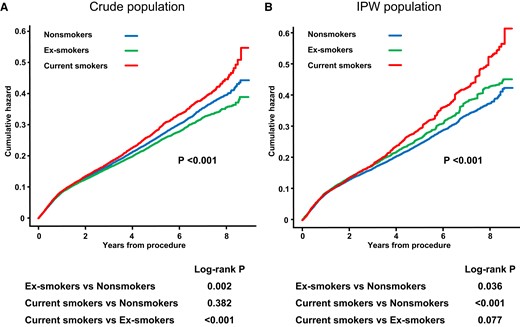
Nelson–Aalen plots for cumulative hazard estimate of MACCE according to smoking status in crude population (A) and in IPW population (B). MACCE, major adverse cardiovascular and cerebrovascular event; IPW, inverse probability-weighted.
Hazard ratios and 95% confidence intervals of MACCE, all-cause mortality, myocardial infarction, stroke, and revascularization by smoking status
| Events (n) | Follow-up duration (person-years) | Incidence rate (per 1000 person-years) | Unadjusted HR (95% CI) | Multivariable model 1 HR (95% CI) | Multivariable model 2 HR (95% CI) | IPW-adjusted HR (95% CI) | |
|---|---|---|---|---|---|---|---|
| MACCE | |||||||
| Non-smokers | 6713 | 124 017 | 54.130 | 1 (ref) | 1 (ref) | 1 (ref) | 1 (ref) |
| Ex-smokers | 5217 | 102 482 | 50.907 | .936 (.902–.970) | 1.035 (.991–1.080) | 1.036 (.992–1.081) | 1.084 (1.047–1.123) |
| Current smokers | 2478 | 42 157 | 58.781 | 1.078 (1.030–1.129) | 1.226 (1.164–1.292) | 1.198 (1.137–1.263) | 1.191 (1.138–1.245) |
| Death | |||||||
| Non-smokers | 2177 | 139 304 | 15.628 | 1 (ref) | 1 (ref) | 1 (ref) | 1 (ref) |
| Ex-smokers | 1382 | 114 914 | 12.026 | .774 (.723–.828) | 1.090 (1.008–1.178) | 1.080 (.999–1.168) | 1.354 (1.271–1.441) |
| Current smokers | 781 | 47 554 | 16.423 | 1.060 (.977–1.150) | 1.658 (1.513–1.817) | 1.606 (1.465–1.760) | 1.660 (1.540–1.790) |
| Myocardial infarction | |||||||
| Non-smokers | 612 | 137 805 | 4.441 | 1 (ref) | 1 (ref) | 1 (ref) | 1 (ref) |
| Ex-smokers | 626 | 113 226 | 5.529 | 1.242 (1.111–1.389) | 1.216 (1.065–1.388) | 1.155 (1.011–1.318) | 1.099 (.983–1.228) |
| Current smokers | 367 | 46 668 | 7.864 | 1.768 (1.554–2.013) | 1.721 (1.482–1.998) | 1.560 (1.343–1.812) | 1.557 (1.367–1.772) |
| Stroke | |||||||
| Non-smokers | 1197 | 136 648 | 8.760 | 1 (ref) | 1 (ref) | 1 (ref) | 1 (ref) |
| Ex-smokers | 660 | 113 422 | 5.819 | .665 (.605–.731) | .960 (.857–1.074) | .954 (.852–1.068) | .949 (.866–1.041) |
| Current smokers | 332 | 46 885 | 7.081 | .810 (.717–.915) | 1.263 (1.101–1.449) | 1.225 (1.068–1.406) | 1.176 (1.049–1.317) |
| Revascularization | |||||||
| Non-smokers | 4159 | 126 221 | 32.950 | 1 (ref) | 1 (ref) | 1 (ref) | 1 (ref) |
| Ex-smokers | 3663 | 103 738 | 35.310 | 1.060 (1.014–1.108) | 1.019 (.966–1.074) | 1.028 (.975–1.084) | 1.018 (.975–1.064) |
| Current smokers | 1630 | 42 706 | 38.168 | 1.142 (1.078–1.209) | 1.090 (1.022–1.163) | 1.078 (1.010–1.150) | 1.043 (.985–1.105) |
CI, confidence interval; HR, hazard ratio; IPW, inverse probability-weighted; MACCE, major adverse cardiovascular and cerebrovascular events.
Multivariable model 1: HRs are adjusted for age, sex, hypertension, diabetes mellitus, dyslipidaemia, body mass index, social income, regular exercise, and alcohol drinking status.
Multivariable model 2: HRs are adjusted for age, sex, hypertension, diabetes mellitus, dyslipidaemia, body mass index, social income, regular exercise, alcohol drinking status, myocardial infarction, heart failure, aspirin, clopidogrel, potent P2Y12 inhibitors, and statin.
IPW model: weights are calculated by age, sex, hypertension, diabetes mellitus, dyslipidaemia, body mass index, social income, regular exercise, alcohol drinking status, myocardial infarction, heart failure, aspirin, clopidogrel, potent P2Y12 inhibitors, and statin.
The effects of smoking cessation on clinical outcomes after percutaneous coronary intervention
To clarify the impact of smoking cessation after PCI, among the patients whose pre- and post-PCI health check-up data were available, we analysed the data of 31 887 patients consisting of those who quit smoking after the index PCI, as well as persistent non-smokers and persistent smokers as comparators. Although the baseline characteristics between these patients and the whole study population were statistically different, the absolute differences were small except for sex (see Supplementary data online, Table S3). Among 31 887 patients, 17 602 persistent non-smokers maintained the non-smoking status until the first health check-up after PCI, 7546 stopped smoking after PCI, and 6739 persistent smokers maintained smoking habits after PCI. Of note, when quitters were categorized by every 10 PYs of a cumulative smoking exposures, those with <20 PYs tended to have a comparable rate of MACCE with that of persistent non-smokers (Table 3). In contrast, quitters with an accumulated exposure of ≥20 PYs were associated with a significantly higher rate of MACCE than persistent non-smokers. The rate was similar to persistent smokers (quitters with 20–30 PYs vs. persistent non-smokers; aHR 1.206; 95% CI 1.054–1.380; quitters with ≥30 PYs vs. persistent non-smokers; aHR 1.227; 95% CI 1.113–1.352; persistent smokers vs. persistent non-smokers; aHR 1.223; 95% CI 1.126–1.328). As an explorative analysis, the cubic spline curve analysis showed that the rate of MACCE tended to increase beyond 15 PYs, which was consistent with the above findings (see Supplementary data online, Figure S1).
Incidence of MACCE according to smoking cessation
| Smoking status Pre-PCI/post-PCI | n | Events (n) | Follow-up duration (person-years) | Incidence rate (per 1000 person-years) | Unadjusted HR (95% CI) | Multivariable model 1 HR (95% CI) | Multivariable model 2 HR (95% CI) |
|---|---|---|---|---|---|---|---|
| Persistent non-smokers | 17 602 | 2858 | 56 922 | 50.209 | 1 (ref) | 1 (ref) | 1 (ref) |
| Quitters after PCI | |||||||
| <10 PYs | 757 | 111 | 2434 | 45.605 | .907 (.750–1.096) | 1.193 (.981–1.451) | 1.182 (.971–1.438) |
| 10–20 PYs | 1594 | 222 | 5144 | 43.160 | .859 (.750–.985) | 1.138 (.984–1.316) | 1.114 (.963–1.290) |
| 20–30 PYs | 1786 | 276 | 5920 | 46.619 | .935 (.826–1.058) | 1.213 (1.061–1.387) | 1.206 (1.054–1.380) |
| ≥30 PYs | 3409 | 631 | 11 136 | 56.664 | 1.131 (1.037–1.233) | 1.238 (1.124–1.364) | 1.227 (1.113–1.352) |
| Persistent smokers | 6739 | 1178 | 21 229 | 55.489 | 1.100 (1.028–1.177) | 1.249 (1.151–1.356) | 1.223 (1.126–1.328) |
| P for interaction | .009 | <.001 | <.001 | ||||
CI, confidence interval; HR, hazard ratio; MACCE, major adverse cardiovascular and cerebrovascular events; PCI, percutaneous coronary intervention; PYs, pack-years.
Multivariable model 1: HRs are adjusted for age, sex, hypertension, diabetes mellitus, dyslipidaemia, body mass index, social income, regular exercise, and alcohol drinking status.
Multivariable model 2: HRs are adjusted for age, sex, hypertension, diabetes mellitus, dyslipidaemia, body mass index, social income, regular exercise, alcohol drinking status, myocardial infarction, heart failure, aspirin, clopidogrel, potent P2Y12 inhibitors, and statin.
When comparing the rate of MACCE in quitters after PCI as a whole with that in persistent smokers as a reference group, we found a numerically lower rate of MACCE in quitters, but this difference was not statistically significant (see Supplementary data online, Table S4). Additionally, when we categorized the patients by their PYs and compared the rate of MACCE in quitters with that in persistent smokers within each group, we observed a trend that quitting in patients <20 PYs was associated with a reduced rate of MACCE, compared with persistent smokers with corresponding PYs. However, this finding was also not statistically significant (see Supplementary data online, Table S5).
We also analysed the data of patients who started or resumed smoking after the index PCI or had quit smoking before the pre-PCI health check-up to provide a full picture for the impact of smoking habits before and after PCI (see Supplementary data online, Table S6). There was no statistically significant difference in the incidence of MACCE between ex-smokers who had quit before the pre-PCI health check-up and new smokers who started smoking after PCI, compared with persistent non-smokers. In contrast, quitters before the pre-PCI health check-up who resumed smoking after PCI were associated with a significantly higher rate of MACCE than persistent non-smokers.
The sub-group analysis of major adverse cardiovascular and cerebrovascular event
Sub-group analysis demonstrated that a lower rate of MACCE in non-smokers was consistently observed across the various sub-groups (Figure 3). Interestingly, the harmful effects of smoking were incrementally prominent with aging. In addition, the adverse outcomes in smokers were more remarkable in patients without risk factors such as HTN, DM, and MI at presentation, compared with non-smokers in each sub-group.
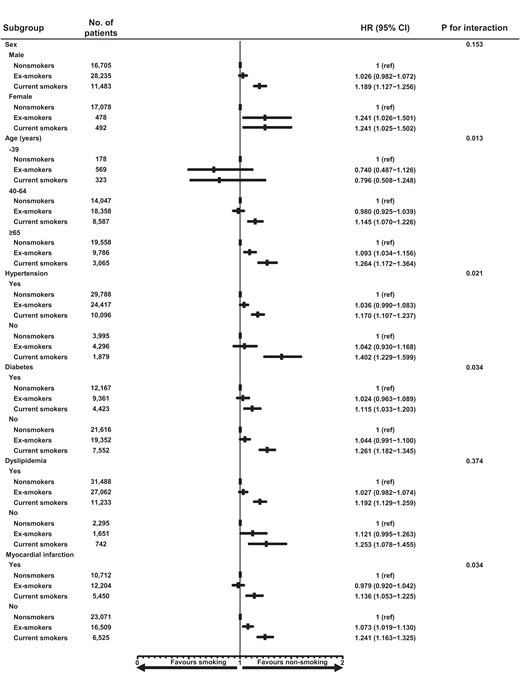
Sub-group analysis for MACCE. MACCE, major adverse cardiovascular and cerebrovascular event.
Analyses in myocardial infarction patients
Of 74 471 patients included in the study, 28 366 (38.1%) presented with MI at the index PCI. Among these patients, the numbers of non-smokers, ex-smokers, and current smokers were 10 712 (37.8%), 12 204 (43.0%), and 5450 (19.2%), respectively (see Supplementary data online, Table S7). Analyses on this population showed similar results to those performed on the whole study population, with higher a MACCE rate in current smokers compared with non-smokers (aHR 1.151; 95% CI 1.061–1.249) (see Supplementary data online, Tables S8 and Table S9,Supplementary data online, Figures S2 and S3). The impact of smoking cessation on better clinical outcomes in this population was not prominent (see Supplementary data online, Table S10). The sensitivity analyses using persistent smokers as the control group, with or without stratification by patients’ PYs, and the analysis of patients who started or resumed smoking after PCI or had quit smoking before the pre-PCI health check-up showed trends similar to those observed in the whole study population for MI patients (see Supplementary data online, Tables S11–S13).
Discussion
The risk of smoking after coronary revascularization has been reported previously.8–10 However, in most previous studies, smoking status was collected only at baseline, making the assessment of the impact of smoking cessation difficult. Moreover, most studies were performed in the pre-PCI or bare-metal stent era. Thus, the effect of smoking on clinical outcomes in the DES era has not yet been fully elucidated.
To our knowledge, our current study is the largest on the impact of smoking and its cessation on cardiovascular outcomes in patients undergoing PCI in the contemporary DES era. The main findings of the current study are as follows: (i) non-smokers showed a significantly lower rate of MACCE after PCI than current smokers, which was mainly driven by a lower rate of all-cause death; (ii) ex-smokers tended to have a comparable rate of MACCE with that of non-smokers; and (iii) quitters after PCI who smoked <20 PYs would be associated with a comparable rate of MACCE with that of persistent non-smokers (Structured Graphical Abstract).
Harmful mechanisms of smoking
Smoking affects various aspects of vascular outcomes. Smoking causes endothelial dysfunction, as demonstrated by the impaired flow-mediated dilatation in smokers.13,14 Smoking also affects lipid profiles in a dose-dependent manner, leading to elevated total cholesterol and triglyceride and decreased high-density lipoprotein cholesterol.15 Smokers show a high level of inflammation16 that is strongly associated with atherogenesis.17 Smoking also causes a prothrombotic status due to increased thrombotic factors and decreased fibrinolytic activity.18 Furthermore, smoking enhances monocyte adhesion to endothelial cells, resulting in elevated matrix metalloproteinase (MMP) expression. Matrix metalloproteinase subsequently induce plaque vulnerability and its potential rupture.19 These harmful effects of smoking are mediated by tobacco constituents, including nicotine, CO, and oxidant gases.3 These substances activate sympathetic tone, reduce oxygen supply, and induce inflammation and hypercoagulability.19,20
Harmful impact of smoking on cardiovascular outcomes
The cardiovascular risk associated with smoking has been documented in many previous studies. Regarding patients with coronary artery disease (CAD), a cohort study reported significantly worse 10-year survival in smokers than non-smokers (77% vs. 82%).21 A recent registry including patients with stable CAD also showed a significantly higher rate of all-cause mortality within 5 years in current smokers [hazard ratio (HR) 1.96] and ex-smokers (HR 1.37) than in non-smokers.22 Regarding patients with ST-elevation MI, recent individual patient data pooled from 10 randomized trials involving 2564 patients demonstrated that smokers had a higher rate of death or heart failure hospitalization (HR 1.49) than non-smokers.23 For patients undergoing PCI, a patient-level pooled analysis including 24 354 patients based on 18 randomized trials found that smoking was a strong independent predictor of all-cause death (HR 1.86).24 Five-year follow-up data from the Synergy between PCI with Taxus and Cardiac Surgery (SYNTAX) trial revealed worse clinical outcomes due to a higher MI incidence in smokers undergoing revascularization for complex CAD.11 Our current study is the largest on this subject, including 74 471 patients, based on the nationwide claims and health check-up database covering the vast majority of the Korean population. This large population-based study confirmed the harmful impact of smoking on clinical outcomes of patients after PCI in the contemporary DES era. Interestingly, in our study population, among the patient undergoing PCI, non-smokers were on average 8 years younger than current smokers. Similarly, among the patients undergoing PCI for MI, non-smokers were on average 9 years younger than current smokers. This stark contrast indirectly suggests the harmful impact of smoking on atherosclerosis.
Notably, many previous studies have documented that smoking is associated with a better prognosis in patients with MI.25–27 This finding coined the term of the smoker’s paradox. It has been postulated that smoking may reduce the infarct size by preconditioning the myocardium.28 In addition, smoking may enhance the efficacy of clopidogrel by inducing cytochrome P450 isoenzyme 1A2, a key enzyme involved in the first activation step of clopidogrel.29 However, recent studies have disputed the smoker’s paradox in patients with MI,23,30 stable CAD,22 or those undergoing PCI, especially after adjusting for favourable baseline characteristics of smokers.24 Our current study aligns with the above studies, refuting the smoker’s paradox. In particular, analyses performed in patients who presented with MI at the index PCI demonstrated that current smokers were associated with worse clinical outcomes, compared with non-smokers in this population, too. However, the effects of smoking cessation in MI patients were not so prominent as much as those in the whole study population. This may be attributed to insufficient numbers of study population and events in this sub-subgroup analysis or to potentially irreversible damage to the myocardium caused by the synergistic effects of infarction and smoking.
The impact of smoking cessation on cardiovascular outcomes
We found two interesting findings regarding the impact of smoking cessation. First, patients with a heavy smoking history of ≥20 PYs may not benefit from smoking cessation after PCI. One previous cohort study reported that among ex-smokers with >15 years of cessation, those with a heavy smoking history of ≥32 PYs had a higher rate of incident heart failure than never smokers (HR 1.45) but a similar rate to that of current smokers (HR .97).31 Another study showed that ex-smokers with a mean smoking history of 20–25 PYs were still associated with a significant increase in the progression of atherosclerosis over 3 years, as assessed by the intimal–medial thickness of the carotid artery on ultrasound.32 In the Atherosclerosis Risk in Communities (ARIC) study including 13 355 participants, ex-smokers with a duration of smoking <20 years showed a cardiovascular risk comparable with that of non-smokers, whereas those with a duration of smoking ≥20 years showed a significantly higher risk over a median follow-up of 26 years.33 Taken together with our findings, some adverse effects of smoking could be irreversible beyond a certain threshold of cumulative exposure.
Second, for patients with a smoking history <20 PYs, the harmful effects of smoking were reduced within a relatively short interval (median 628 days between pre- and post-PCI health check-ups) after smoking cessation. The Nurses’ Health Study cohort showed that the risk of smoking on mortality among ex-smokers decreased nearly to that of never smokers 10–14 years after quitting.34 Notably, ex-smokers already had a 24% reduction in the rate of cardiovascular death within 2 years of smoking cessation. A systematic review including 20 studies revealed a 36% reduction in the crude relative mortality rate for patients with coronary heart disease who quit smoking compared with those who continued smoking.35 Most of the included studies had a mean follow-up duration of 3–7 years, and the shortest had a follow-up duration of 2 years. Among patients with left ventricular dysfunction after MI, smoking quitters at the 6-month follow-up were associated with a significantly lower rate of all-cause mortality during a median follow-up of 42 months.36 Importantly, unadjusted Kaplan–Meier curves for all-cause mortality between quitters and persistent smokers diverged early, within a few months of follow-up. A recent Atherosclerosis Risk In Communities (ARIC) study demonstrated a lower risk of cardiovascular outcomes within 5 years of smoking cessation.33 Interestingly, it took 10–30 years or more for the risk of ex-smokers to normalize to that of never smokers, depending on outcome measures. Mechanistically, the relatively quick reversal of the harmful effects of smoking by quitting could be explained, in part, by the early improvement of endothelial function. One study that assessed the impact of smoking on endothelial function using flow-mediated dilation of the brachial artery demonstrated that ex-smokers experienced a significant improvement in endothelial function 1 year after smoking cessation.37
Intriguingly, in our study, a rate of MACCE in quitters after PCI was only numerically lower than that of persistent smokers as a reference group, but this difference was not statistically significant. This was observed regardless of whether the comparison was conducted for the entire group or after categorization based on their PYs. We suspect that these comparisons could be statistically under-powered due to the limited numbers of patients in each group, especially following the categorization. Additionally, we may speculate that the cumulative amount of smoking exposure could exert a greater impact on clinical outcomes than smoking cessation itself. However, this speculation also suggests the importance of smoking cessation before reaching the threshold of irreversible smoking-related damages.
Study limitations
Our study has some limitations. First, the status and amount of smoking were referenced using self-reported questionnaires, and it may be difficult to ensure that the questionnaires objectively reflect the true status of the patients. However, it is worth noting that a previous cohort study reported a high correlation between self-reported smoking status and biochemical measures of smoking such as CO and cotinine.38 Nevertheless, we cannot rule out a possibility that the smoking status of some patients may have changed after the health check-ups. Second, despite multivariable analysis and IPW adjustments, unmeasured confounders could exist because of the inherent nature of non-randomized data. For example, duration of anti-platelet agents or adherence to dual anti-platelet therapy was not available in our database and thus could not be included in our analyses. Third, although we believe that our study, based on the nationwide claims and health check-up database, holds the unique strength of representing patients undergoing PCI, our findings could not be generalized to all races. Fourth, we used PYs to estimate the amount of smoking. However, this measurement cannot differentiate the impact of long-term smoking at low doses from short-term smoking at high doses. Fifth, among a total of 360 379 patients, 74 471 patients whose regular health check-up data were available were included according to the criteria presented in the Methods. Although we believe that the enrolled population was largely representative of the total population undergoing PCI, this selection process may introduce an inevitable selection bias. Sixth, to determine the impact of smoking cessation after PCI, a sub-population of a total of 31 887 patients was analysed. The baseline characteristics between this sub-population and the whole study population were statistically different, raising potential concerns regarding selection bias for this analysis. However, the absolute differences between the two groups were small except for sex. Although we believe that the sub-population for smoking cessation analysis was largely representative of the whole study population, further studies may be needed to generalize our findings. Particularly, in a previous study, smoking was found to be a more substantial risk factor for MI and was associated with a significantly higher risk of adverse outcomes after PCI in females compared with males.39 This may be due to differences in the absorption and pathophysiological effects of tobacco toxins between the sexes.40 It is worth noting that women accounted for <5% of both the ex-smokers and current smokers included in our analysis, thereby limiting the generalizability of our study findings to the female population. Consequently, further research is warranted to explore potential sex differences in the impact of smoking cessation. Seventh, the Korean NHIS database does not provide information regarding exposure to second-hand smoke. Thus, we could not examine the impact of second-hand smoke on our outcomes. Finally, in the sub-group analysis, the adverse outcomes associated with smoking were incrementally prominent with aging. Notably, the harmful impact of smoking was not statistically significant in the younger patients under 40, and smoking seemed to be paradoxically protective in this sub-group. We hypothesize that older patients may have longer cumulative exposure to tobacco with irreversible damage or that the aging process may make people more susceptible to the harmful effects of smoking. However, because the study population under 40 was small, this finding could not be confirmed and further studies are warranted. Furthermore, it should also be noted that smoking exposure and age may be related and unknown risk factors that could not be adjusted using the available variables may mediate the relationship between age under 40 and clinical outcomes. Therefore, the analyses stratified by age should be interpreted with caution as they potentially introduce the issue of collider-stratification bias.41
Conclusion
Based on a nationwide big population database, our study revealed that smoking is significantly associated with a higher risk of adverse cardiovascular events in patients after PCI in the modern DES era. In addition, smoking cessation after PCI in patients who smoked <20 PYs was associated with a reduction of the harmful effects of smoking. Smoking cessation as early as possible would be recommended as a fundamental measure of better clinical outcomes for patients undergoing PCI.
Supplementary data
Supplementary data are available at European Heart Journal online.
Declarations
Disclosure of Interest
All authors declare no conflict of interest for this contribution.
Data Availability
Data sharing is not possible because of legislation from the Korean government. Additional data are available through approval and oversight by the Korean National Health Insurance Service.
Funding
This study was funded by Chong Kun Dang Inc. (Seoul National University Hospital funding number: 0620190200) (Seoul, Republic of Korea). The funding agency had no role in study design, analysis, interpretation of data, the writing of the manuscript, or in the decision to submit the article for publication.
Ethical Approval
This study was approved by the Institutional Review Board of Seoul National University Hospital.
Pre-registered Clinical Trial Number
Not supplied.
References
Author notes
You-Jeong Ki and Kyungdo Han contributed equally to the study.

