


Abstract
Type of funding sources: None.
Heart failure (HF) is a heterogeneous disease with complex structural and electrophysiological derangements of the heart. Attempts to classify HF from the electrophysiological perspective are lacking.
To use electrocardiographic (ECG) data for phenotypic classification of patients with HF.
In this retrospective cohort study, all adult patients hospitalized for HF during 2010-2016 at a tertiary center were included. Automated measurements of the first ECG obtained during the index admission were recorded. K-means clustering using premorbid conditions and selected ECG measurements were used to classify the cohort into four mutually exclusive clusters. The primary (all-cause and cardiovascular mortality) and secondary (ventricular arrhythmia (VA)) outcomes were compared between clusters using Cox regression analysis.
In total, 2849 patients (1363 males, age 75.1 ± 13.4 years) were included. Over a mean follow-up period of 5.37 ± 4.10 years, all-cause and cardiovascular mortality occurred in 2071 (72.7%) and 600 (21.1%) patients respectively, while VA occurred in 110 patients (3.9%). Cluster 1 was characterised by a low heart rate and low ventricular activation time (VAT). Cluster 2 was characterised by old age, low absolute QRS area, and high QTc and QT dispersion. Cluster 3 was characterised by young age, and left ventricular hypertrophy (LVH), and few had history of VA. Cluster 4 was characterised by wide QRS, hypertension, ischaemic heart disease, high VAT, and high absolute T wave area. Cluster 4 had the highest and cluster 1 the lowest risks of all-cause (hazard ratio (HR) 2.96 [1.09, 1.50], p = 0.003; Figure A) and cardiovascular mortality (HR 2.90 [1.15, 2.11], p = 0.004; Figure B). Meanwhile, cluster 2 had the highest risk of VA (HR 2.23 [1.09, 3.85], p = 0.025; Figure C) while clusters 1 and 3 similarly had the lowest risks.
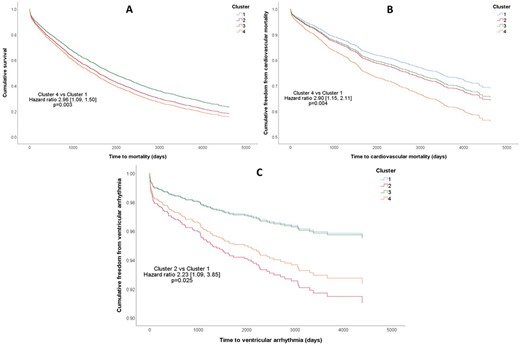
Abstract Figures A, B, and C

