


Abstract
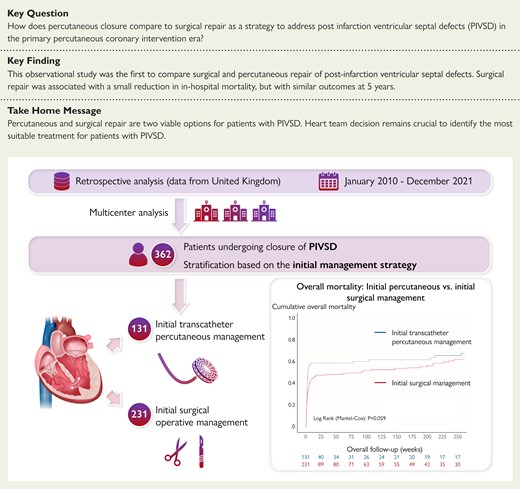
Post-infarction ventricular septal defect (PIVSD) is a mechanical complication of acute myocardial infarction (AMI) with a poor prognosis. Surgical repair is the mainstay of treatment, although percutaneous closure is increasingly undertaken.
Patients treated with surgical or percutaneous repair of PIVSD (2010–2021) were identified at 16 UK centres. Case note review was undertaken. The primary outcome was long-term mortality. Patient groups were allocated based upon initial management (percutaneous or surgical). Three-hundred sixty-two patients received 416 procedures (131 percutaneous, 231 surgery). 16.1% of percutaneous patients subsequently had surgery. 7.8% of surgical patients subsequently had percutaneous treatment. Times from AMI to treatment were similar [percutaneous 9 (6–14) vs. surgical 9 (4–22) days, P = 0.18]. Surgical patients were more likely to have cardiogenic shock (62.8% vs. 51.9%, P = 0.044). Percutaneous patients were substantially older [72 (64–77) vs. 67 (61–73) years, P < 0.001] and more likely to be discussed in a heart team setting. There was no difference in long-term mortality between patients (61.1% vs. 53.7%, P = 0.17). In-hospital mortality was lower in the surgical group (55.0% vs. 44.2%, P = 0.048) with no difference in mortality after hospital discharge (P = 0.65). Cardiogenic shock [adjusted hazard ratio (aHR) 1.97 (95% confidence interval 1.37–2.84), P < 0.001), percutaneous approach [aHR 1.44 (1.01–2.05), P = 0.042], and number of vessels with coronary artery disease [aHR 1.22 (1.01–1.47), P = 0.043] were independently associated with long-term mortality.
Surgical and percutaneous repair are viable options for management of PIVSD. There was no difference in post-discharge long-term mortality between patients, although in-hospital mortality was lower for surgery.
See the editorial comment for this article ‘Management of post-infarction ventricular septal defects: are we moving forward?’, by Fernando Alfonso et al., https://doi.org/10.1093/eurheartj/ehac532.
Introduction
Post-infarction ventricular septal defect (PIVSD) or ventricular septal rupture is an uncommon but life-threatening complication of acute myocardial infarction (AMI). Recording of patients with PIVSD is rarely systematic, although the frequency in the primary percutaneous coronary intervention (PCI) era has been estimated as around 0.2% of patients presenting with AMI.1 PIVSD exposes the heart to the double insult of a large territory infarction, and a sudden onset left to right cardiac shunt. The pulmonary vasculature is exposed to systemic pressures. Mortality with medical therapy alone is >94% at one month.2 PIVSD are often complex in nature, rarely circular or discrete, and they are often serpiginous with intramyocardial dissection and are challenging to treat with any modality. Surgical patch repair has been the mainstay of treatment for many years. Surgery has been associated with a substantial improvement in survival compared to medical therapy, but mortality remains high at up to 42% in large database studies.3,4
Percutaneous, transcatheter techniques for the treatment of PIVSD were first described in 1988,5 and have been seen increasingly in clinical practice over recent years. Multiple case series have been reported. All of these have been small, even when multiple institutions have combined their data.6–14 The largest was a UK wide series that included 58 procedures performed between 1997 and 2012.15 In-hospital mortality was 34% in this series, with 7.5% of patients needing subsequent surgical intervention. There is no substantial head-to-head data to compare surgical repair with percutaneous treatment.
This retrospective observational study aimed to gather all UK data on PIVSD repair since 2010, when primary PCI was available throughout the country, to reflect a modern and clinically relevant cohort of patients. The study intended to compare both in-hospital and long-term mortality and describe both surgical and percutaneous repair as undertaken at present.
Methods
Data
The study was a retrospective data analysis after detailed case notes review in centres providing specialized management of patients with PIVSD in the UK. All centres identified as able to perform both percutaneous and surgical closure in the UK were approached, and 16 hospital centres contributed to the data registry. These hospitals together with procedural volumes are listed in Supplementary material online, Table S1. Two further centres had not performed any percutaneous procedures, and therefore they were not included in the study.
Patients were identified in each centre by means of local database searches within the institution. This included records kept for the National Cardiac Surgery Audit, hospital coding data, structural heart team records, and individual interventional cardiologists’ records. Each case identified then underwent thorough case note review to confirm that it was a PIVSD case, and data could be obtained for all the required fields. All review was undertaken locally. Anonymized data were transferred to the national dataset. Data were collected regarding patient demographics, comorbidities, AMI characteristics, preprocedural clinical condition, main echocardiographic findings, procedural measures, procedural success and complications, in-hospital outcomes, and post-discharge mortality. UK hospital electronic medical records have robust mortality tracking linked the Office of National Statistics. Procedural success was defined as absence of any immediate or direct procedural failure, requiring subsequent re-do procedure (percutaneous or surgical) or directly affecting patient’s prognosis, with at least partial reduction of the leak. Cardiogenic shock was defined as systolic blood pressure <90 mmHg, or the need for inotropes or mechanical support to maintain blood pressure—this did not include intra-aortic balloon pump (IABP) placed exclusively to facilitate repair. Coronary artery disease was defined as >70% stenosis in one of the three major epicardial coronary arteries. Left and right ventricular (RV) function was defined based on procedural transoesophageal echocardiography (TOE), or last echocardiographic examination before repair. Defect size was taken from whichever imaging modality was utilized to record it. Techniques for percutaneous closure and surgical repair are well reviewed elsewhere.4,16,17
Study design and population
All patients undergoing closure of PIVSD between January 2010 and December 2021 were included, grouped by initial management strategy for the analysis. Initial management strategy was defined as either percutaneous or surgical operative management. Patients undergoing hybrid procedures where a percutaneous device was placed through a sternotomy were considered surgical cases. Patients undergoing multiple procedures were also included in the analyses based on their initial management strategy (i.e. first procedure) in an ‘intention to treat’ fashion. Patients who had been planned for treatment but did not survive long enough to receive it are not captured in the dataset as data were unavailable. A total of 362 patients from the original dataset were included in the analysis, undergoing 131 initial transcatheter percutaneous procedures and 230 initial surgical operations. A flow chart of patient selection is shown in Figure 1.
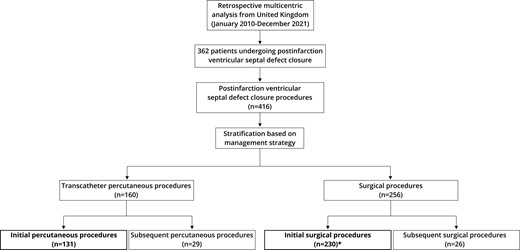
Flow chart of patient selection. *Single patient from the analysis had surgical repair of post-infarction ventricular septal defect in 2007 and re-presented in the time-period of the study requiring redo treatment (initially percutaneous, then surgical).
Outcomes
The primary outcome was long-term all-cause mortality (at 5 years). Survival to discharge was also recorded regardless of time in hospital. It was recognized that adjusting for all confounding factors and selection bias between groups would be difficult and thus a landmark analysis of survival after hospital discharge was also performed. Other measured outcomes included procedural success and in-hospital complications (stroke, repeat intervention, new renal replacement therapy, pneumonia, and cardiac tamponade). In addition, factors associated with initial transcatheter percutaneous management were assessed.
Statistical analyses
Statistical Package for the Social Sciences (SPSS) (IBM Corp, Armonk, NY; version 25) was used for statistical analysis. Data were presented using medians (interquartile range) for continuous non-parametric data and as counts (percentages) for categorical data. By convention in this manuscript data are presented as percutaneous vs. surgical. Quantitative data were analysed with Mann–Whitney U tests, and categorical data with Chi-squared tests. The cumulative incidence of mortality was estimated using the Kaplan–Meier approach and the Mantel-Cox log-rank test. Landmark analysis was undertaken including only patients that survived up to hospital discharge, with censorship at 5 years of follow-up. Cox logistic regression analysis was performed to determine the factors associated with in-hospital and post-discharge mortality in the univariate and multivariable model (enter algorithm), expressed as adjusted hazard ratio (aHR) with 95% confidence intervals (CI). Cox multivariable regression models were adjusted for the following variables: type of management, centre volume (number of procedures), patients with multiple procedures, time from AMI to ventricular septal defect repair, age, sex, diabetes mellitus, arterial hypertension, PCI to infarct-related artery, creatinine, number of diseased coronary arteries, New York Heart Association class, presence of cardiogenic shock and RV dysfunction. These covariates were used due to their clinical relevance and potential association with the outcomes. Reported aHR values correspond to 10-unit increase/decrease of creatinine, and 1-unit increase/decrease for other continuous variables. Binomial multivariate logistic regression analysis was used to determine the factors associated with initial percutaneous management, and expressed as adjusted odds ratio with 95% CI. The results of the risk analyses are expressed as aHR or odds ratio with corresponding 95% CI. All tests are listed under corresponding tables. A two-sided P-value of <0.05 was considered statistically significant.
The study was approved by the institutional review board at Liverpool Heart and Chest Hospital (Ref. No ID388). Patient consent was not required for anonymized notes review as this was considered a retrospective service evaluation.
Results
Between January 2010 and December 2021, 362 patients were treated with surgical or percutaneous closure for PIVSD. Of these, 231 underwent surgical closure as the initial repair, and 131 received percutaneous repair. Figure 2 shows the volume per year for each strategy. Table 1 shows the baseline patient characteristics of both groups. Overall patients in the percutaneous closure group were older [72 (64–77) vs. 67 (61–73) years, P < 0.001] and had a higher body mass index [28 (25–31) vs. 26 (24–30) kg/m2, P = 0.01]. They were also more likely to have had a documented heart team decision. Surgical patients were likely to have larger defects [18 (14–22) vs. 20 (15–27) mm, P < 0.001], were more likely to be in cardiogenic shock (51.9% vs. 62.8%, P = 0.044), and were also more likely to have mechanical circulatory support placed prior to the repair (Table 1). There was no difference between groups in median time from AMI to repair [9 (6–14) vs. 9 (4–22) days, P = 0.179].
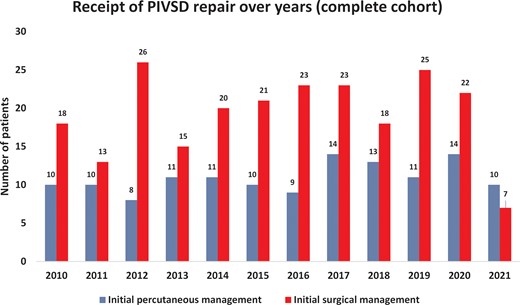
Procedural volume over time. Single patient from the analysis had surgical repair of post-infarction ventricular septal defect in 2007 and re-presented in the time-period of the study (year 2014) requiring redo treatment (initially percutaneous, then surgical).
Patient characteristics
| Characteristics | Initial percutaneous management (N = 131; 36.2%) | Initial surgical management (N = 231; 63.8%) | P-value |
|---|---|---|---|
| Age (years), median (IQR) | 72 (64–77) | 67 (61–73) | <0.001a |
| Female sex, % | 35.1 | 28.1 | 0.167b |
| Body mass (kg), median (IQR) | 81 (70–90) | 78 (67–89) | 0.019a |
| Body height (cm), median (IQR) | 171 (162–177) | 170 (164–175) | 0.932a |
| Body mass index (kg/m2), median (IQR) | 28 (25–31) | 26 (24–30) | 0.010a |
| Comorbidities, % | |||
| Hypertension | 46.6 | 55.0 | 0.124b |
| Diabetes mellitus | 19.8 | 16.0 | 0.356b |
| Chronic lung disease | 9.2 | 10.8 | 0.616b |
| Prior or current smoking | 42.0 | 61.0 | <0.001b |
| Hypercholesterolaemia | 30.5 | 37.7 | 0.172b |
| Prior cerebrovascular incident (thromboembolic or haemorrhagic) | 3.1 | 3.5 | 0.834b |
| Creatinine (mg/dL), median (IQR) | 1.2 (0.9–1.6) | 1.3 (1.0–1.8) | 0.707a |
| AMI characteristics, % | |||
| Territory of myocardial infarction | 0.023b | ||
| Anterior | 43.5 | 32.2 | |
| Inferior | 55.7 | 63.0 | |
| Lateral | 0.8 | 0.4 | |
| Posterior | 0.0 | 4.3 | |
| Vessels with coronary artery disease | 0.437b | ||
| 0 | 0.0 | 0.9 | |
| 1 | 47.1 | 39.0 | |
| 2 | 30.3 | 36.8 | |
| 3 | 21.0 | 22.5 | |
| 4 | 1.7 | 0.9 | |
| Initial AMI treatment, % | 0.413b | ||
| None | 56.2 | 58.8 | |
| PCI | 41.5 | 38.2 | |
| CABG | 0.8 | 0.0 | |
| Thrombolysis | 1.5 | 3.1 | |
| PCI to infarct-related artery, % | 41.5 | 38.7 | 0.596b |
| NYHA class (worst prior to repair), % | 0.457b | ||
| 1 | 3.1 | 4.8 | |
| 2 | 17.1 | 12.2 | |
| 3 | 32.6 | 30.1 | |
| 4 | 47.3 | 52.8 | |
| Cardiogenic shockc, % | 51.9 | 62.8 | 0.044b |
| Dialysis/filtration (prior to repair), % | 6.1 | 10.8 | 0.134b |
| Mechanical circulatory support (prior to repair), % | 0.050b | ||
| None | 32.8 | 22.9 | |
| Intra-aortic balloon pump | 66.4 | 74.0 | |
| Impella device | 0.8 | 0.0 | |
| Extracorporeal membrane oxygenation | 0.0 | 2.2 | |
| Intra-aortic balloon pump + extracorporeal membrane oxygenation | 0.0 | 0.9 | |
| Multidisciplinary team discussion, % | <0.001b | ||
| None | 15.3 | 51.9 | |
| Documented informal discussion | 38.2 | 25.5 | |
| Formal heart team review | 46.6 | 22.5 | |
| MSCT planning, % | 38.2 | 5.6 | <0.001b |
| Time from AMI to presentationd(days), median (IQR) | 2 (0–7) | 2 (0–7) | 0.850a |
| Time from AMI to VSD repaird (days), median (IQR) | 9 (6–14) | 9 (4–22) | 0.179a |
| Defect sizee (mm), median (IQR) | 18 (14–22) | 20 (15–27) | <0.001a |
| Defect site, % | 0.192b | ||
| Anterior | 21.1 | 18.8 | |
| Inferior | 53.9 | 64.2 | |
| Apical | 25.0 | 16.2 | |
| Mid septum | 0.0 | 0.4 | |
| Other | 0.0 | 0.4 | |
| LV systolic function (on procedural TOE or last echo before repair) | 0.165b | ||
| Normal (EF >50%) | 33.8 | 26.6 | |
| Moderate (EF 31–49%) | 43.8 | 54.1 | |
| Severe (EF <30%) | 22.3 | 19.2 | |
| RV function (on procedural TOE or last echo before repair) | 0.007b | ||
| Normal (EF >50%) | 32.8 | 18.1 | |
| Dilated RV | 16.4 | 21.2 | |
| Dilated RV with impaired function | 50.8 | 60.6 |
Mann–Whitney U test.
Chi-squared test.
Defined as systolic blood pressure <90 mmHg or need for inotropes or need for mechanical support (does not include intra-aortic balloon pump placed exclusively to facilitate repair).
May be best estimate.
6.1% of the percutaneous cohort and 13.4% of the surgical cohort were recorded as ‘Large’.
AMI, acute myocardial infarction; CABG, coronary artery bypass grafting; EF, ejection fraction; IQR, interquartile range; LV, left ventricle; NYHA, New York Heart Association; PCI, percutaneous coronary intervention; RV, right ventricle; TOE, transoesophageal echocardiography; VSD, ventricular septal defect.
The characteristics of both initial surgical and initial percutaneous procedures are shown in Table 2. Percutaneous procedures were largely carried out under general anaesthesia. In this cohort, TOE and fluoroscopy were the mainstay of procedural imaging, although 38.2% had computed tomography planning before the procedure. Of note, no intracardiac echocardiography (ICE) was used for percutaneous repair. The most common venous access was via the jugular vein (57.8%) with the femoral artery (91.5%) the most common arterial route. Use of an arteriovenous (AV) loop to support delivery of the device was common (84.7%). Most patients had a just a single attempt to place a device (73.8%). A single device was successfully deployed in 84.7% of cases. The Amplatzer Post Infarct Muscular VSD Occluder (Abbott Vascular, Santa Clara, CA) was the most frequently used device (64.1%) with a selection of other devices used ‘off label’ as seen in Table 2. A small number of Occlutech Perimembranous VSD devices (Occlutech, Helsingborg, Sweden) were used with UK approval. Given the complexity, procedures were long with a median time of 140 (100–204) minutes, and there was at least partial reduction in flow across the PIVSD in 88.8% of cases. Surgical cases were relatively long with a median cardiopulmonary bypass time of 155 (119–213) minutes. Only two thirds of surgical cases achieved complete resolution on imaging at the end of the case. Around half of cases had a concomitant coronary artery bypass graft. Other procedures were rare, although it is noted that two surgical procedures after initial percutaneous repair included repair of the tricuspid apparatus.
Procedural characteristics
| Characteristics | Percutaneous management |
|---|---|
| Previous closure, % | 0.0 |
| General anaesthesia, % | 93.1 |
| Imaging support, % | |
| Fluoroscopy only | 3.9 |
| TTE | 3.1 |
| TOE | 93.0 |
| ICE | 0.0 |
| Arterial access, % | |
| None | 1.6 |
| Femoral | 91.5 |
| Radial | 3.9 |
| Axillary | 1.6 |
| Brachial | 0.8 |
| Radial and femoral | 0.8 |
| Venous access, % | |
| None | 5.5 |
| Femoral | 35.9 |
| Jugular | 57.8 |
| Both | 0.8 |
| Inotropic support, % | 45.0 |
| AV loop, % | 84.7 |
| Balloon sizing, % | 11.5 |
| Largest device size (mm), median (IQR) | 24 (20, 24) |
| Number of device placement attempts, % | |
| 0 | 4.0 |
| 1 | 73.8 |
| 2 | 17.5 |
| 3 | 3.2 |
| 4 | 1.6 |
| Number of successful device placement attempts, % | |
| 0 | 13.7 |
| 1 | 84.7 |
| 2 | 0.8 |
| 3 | 0.0 |
| 4 | 0.8 |
| First successful attempt, device type, % | |
| Unsuccessful | 9.2 |
| Amplatzer™ P.I. Muscular VSD Occluder | 64.1 |
| Amplatzer™ Muscular VSD Occluder | 12.2 |
| Amplatzer™ Atrial Septal Occluder | 6.9 |
| Amplatzer™ Vascular Plug II | 0.8 |
| Amplatzer™ Cribriform Occluder | 1.5 |
| Amplatzer™ PFO Occluder | 1.5 |
| Occlutech™ Perimembranous VSD Occluder | 3.8 |
| Second successful attempt, device type, % | |
| Amplatzer™ Atrial Septal Occluder | 0.8 |
| Third successful attempt, device type, % | |
| Amplatzer™ Vascular Plug II | 0.8 |
| Immediate shunt reduction, % | |
| No reduction | 11.2 |
| Partial reduction | 69.6 |
| Complete reduction | 19.2 |
| Procedure duration (minutes), median (IQR) | 140 (100–204) |
| Fluoroscopy time (minutes), median (IQR) | 30 (19–44) |
| Surgical management | |
| Previous attempt, % | 0.0 |
| Intraoperative transoesophageal echocardiography, % | 100.0 |
| Intraoperative intra-aortic balloon pump, % | 77.1 |
| Concomitant CABG, % | 51.9 |
| Concomitant valve procedure, % | |
| None | 92.6 |
| Mitral valve procedure | 4.8 |
| Tricuspid valve procedure | 1.3 |
| Aortic valve procedure | 1.3 |
| Concomitant VAD placement, % | |
| No | 97.0 |
| Yes | 1.7 |
| Weaned to extracorporeal membrane oxygenation | 1.3 |
| Surgical technique, % | |
| Patch | 93.4 |
| Oversewing/exclusion | 4.8 |
| Percutaneous device placed | 0.4 |
| Patch and Exclusion | 1.3 |
| Immediate shunt reduction, % | |
| No reduction | 1.8 |
| Partial reduction | 31.7 |
| Complete reduction | 66.5 |
| Cardiopulmonary bypass time (min), median (IQR) | 155 (119–213) |
| Aortic cross clamp time (min), median (IQR) | 104 (76–143) |
AV, arteriovenous; CABG, coronary artery bypass graft; ICE, intracardiac echocardiography; IQR, interquartile range; TOE, transoesophageal echocardiography; TTE, transthoracic echocardiography; VAD, ventricular assist device.
There was significant crossover in both directions after the initial procedure, although for the purposes of statistical analysis patient remained in the group according to initial treatment. Supplementary material online, Figure S1 shows the pathway of patients through multiple attempts at repair. 13.0% of all patients required an additional procedure (surgical or percutaneous). In the surgical group, 0.8% of patients required a further surgical repair, whilst 7.4% underwent a subsequent percutaneous closure. 1.7% of surgical patients needed more than two procedures. In the percutaneous group, 6.1% subsequently needed a further percutaneous procedure, whilst 15.3% underwent a surgical repair afterwards. 1.5% needed more than two procedures. A single surgical patient went on to have cardiac transplantation. This patient was still alive at 5-year follow-up.
Immediate procedural success after the first procedure was higher in the surgical group (79.4% vs. 88.3%, P = 0.02). Table 3 shows complications associated with the procedure. Surgical repair was associated with more post procedural stroke and pneumonia than percutaneous treatment. Overall, in-hospital mortality for all patients was 48.1%. Unadjusted in-hospital mortality was higher in the percutaneous cohort (55.0% vs. 44.2%, P = 0.048). There was no difference in overall mortality at 5 years (61.1% vs. 53.7%, P = 0.17). Landmark analysis from hospital discharge shows no difference in mortality at 5 years (P = 0.65) (Figure 3).
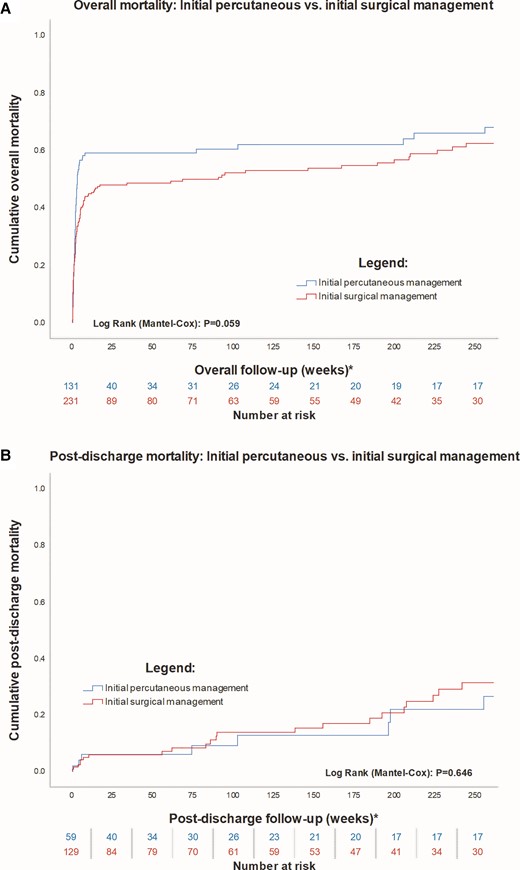
Long-term mortality. A Shows a Kaplan–Meier curve of mortality up to 5 years. B Is a landmark analysis from hospital discharge, indicating no difference between groups after discharge. Both panels are censored at 5 years.
Complications following initial procedure
| Complication, % | Initial percutaneous management (N = 131; 36.2%) | Initial surgical management (N = 231; 63.8%) | P-valuea |
|---|---|---|---|
| Stroke, % | 0.8 | 5.6 | 0.021 |
| Device embolization, % | 7.6 | n/a | / |
| Surgical patch dehiscence, % | / | ||
| No patch dehiscence | n/a | 82.3 | |
| Partial patch dehiscence | n/a | 13.4 | |
| Complete patch dehiscence | n/a | 4.3 | |
| Any repeat intervention, % | <0.001 | ||
| None | 78.6 | 90.9 | |
| Percutaneous closure | 5.4 | 6.5 | |
| Surgical closure | 15.3 | 0.9 | |
| Both percutaneous and surgical closure | 0.8 | 1.3 | |
| Cardiac transplantation | 0.0 | 0.4 | |
| Reason for repeat intervention, % | <0.001 | ||
| No repeat intervention | 78.6 | 90.9 | |
| Failed percutaneous attempt | 7.6 | 0.0 | |
| New VSD | 0.0 | 0.4 | |
| Enlarged old VSD | 3.1 | 0.9 | |
| Device embolization | 3.8 | 0.0 | |
| Patch dehiscence | 0.0 | 7.9 | |
| Renal replacement therapy, % | <0.001 | ||
| No | 86.3 | 56.7 | |
| Yes, new | 9.9 | 35.5 | |
| Yes, ongoing prior to intervention | 3.8 | 7.8 | |
| New pacemaker/ICD, % | 1.5 | 6.9 | 0.023 |
| Pneumonia, % | 8.4 | 23.4 | <0.001 |
| Cardiac tamponade, % | 5.3 | 6.1 | 0.779 |
ICD, implantable cardioverter-defibrillator; VSD, ventricular septal defect.
Cox-regression analysis shows the factors independently associated with long-term mortality (Table 4) and in-hospital mortality (Table 5) and were similar between analyses. The factors independently associated with long-term mortality were cardiogenic shock [aHR 1.97 (1.37–2.84), P < 0.001], initial percutaneous approach [aHR 1.44 (1.01–2.05), P = 0.042], number of vessels with coronary artery disease [aHR 1.22 (1.01–1.47), P = 0.043], earlier initial intervention [aHR 0.99 (0.98–0.99), P = 0.037], and baseline creatinine [aHR 1.03 (1.01–1.05), P = 0.002]. The factors independently associated with in-hospital mortality in the analysis were cardiogenic shock [aHR 2.17 (1.43–3.29), P < 0.001], an initial percutaneous strategy [aHR 1.89 (1.30–2.77), P = 0.001], PCI to the infarct-related artery as the initial management strategy [aHR 1.48 (1.07–2.03), P = 0.016], earlier initial intervention [aHR 0.98 (0.96–0.99), P = 0.021], and baseline creatinine [aHR 1.03 (1.01–1.04), P = 0.005]. Receiving multiple procedures was associated with lower in-hospital mortality [aHR 0.57 (0.33–0.99), P = 0.045]. Diabetes mellitus was the only factor independently associated with mortality in the landmark analysis, with PCI to the infarct-related artery predicting reduced mortality post-discharge (see Supplementary material online, Table S2). Factors independently associated with an initial percutaneous approach were age, centre volume, and defect size (see Supplementary material online, Table S3).
Cox regression analysis for association with overall 5-year mortality (complete cohort)
| Variables | Univariate Cox analysis | Multivariate Cox analysis | ||
|---|---|---|---|---|
| HR (95% CI) | P-value | aHR (95% CI) | P-value | |
| Percutaneous managementa | 1.31 (0.99–1.73) | 0.063 | 1.44 (1.01–2.05) | 0.042 |
| Centre volume | 1.00 (0.99–1.01) | 0.801 | 1.00 (0.99–1.02) | 0.759 |
| Patients with multiple procedures | 0.59 (0.38–0.93) | 0.023 | 0.61 (0.37–1.03) | 0.063 |
| Time from AMI to VSD repair | 0.97 (0.96–0.99) | <0.001 | 0.99 (0.98–0.99) | 0.037 |
| Age | 1.02 (1.01–1.04) | 0.004 | 1.02 (1.00–1.03) | 0.075 |
| Female sex | 0.92 (0.68–1.24) | 0.587 | 0.79 (0.57–1.11) | 0.176 |
| Diabetes mellitus | 1.10 (0.77–1.57) | 0.595 | 0.91 (0.61–1.37) | 0.665 |
| Hypertension | 1.31 (0.99–1.73) | 0.056 | 1.31 (0.97–1.78) | 0.077 |
| PCI to IRA | 1.20 (0.91–1.59) | 0.195 | 1.18 (0.88–1.59) | 0.270 |
| Creatinineb | 1.03 (1.02–1.05) | <0.001 | 1.03 (1.01–1.05) | 0.002 |
| Number of vessels with coronary artery disease | 1.14 (0.96–1.35) | 0.146 | 1.22 (1.01–1.47) | 0.043 |
| NYHA class | 1.35 (1.13–1.62) | 0.001 | 1.13 (0.92–1.37) | 0.241 |
| Cardiogenic shock | 2.25 (1.67–3.04) | <0.001 | 1.97 (1.37–2.84) | <0.001 |
| RV dysfunctionc | 0.94 (0.68–1.30) | 0.694 | 0.88 (0.60–1.29) | 0.522 |
Reference group is surgical management.
Per 10-unit increase.
Reference group is normal RV size and function (ejection fraction >50%).
Enter algorithm was used. HR value corresponds to 1 unit increase/decrease for continuous variables (except creatinine).
aHR, adjusted hazard ratio; AMI, acute myocardial infarction; CI, confidence interval; HR, hazard ratios; IRA, infarct-related artery; NYHA, New York Heart Association; PCI, percutaneous coronary intervention; RV, right ventricle; VSD, ventricular septal defect.
Cox regression analysis for association with in-hospital mortality (complete cohort)
| Variables | Univariate Cox analysis | Multivariate Cox analysis | ||
|---|---|---|---|---|
| HR (95% CI) | P-value | aHR (95% CI) | P-value | |
| Percutaneous managementa | 1.66 (1.22–2.56) | 0.001 | 1.89 (1.30–2.77) | 0.001 |
| Centre volume | 0.99 (0.98–1.01) | 0.369 | 1.00 (0.99–1.02) | 0.985 |
| Patients with multiple procedures | 0.61 (0.38–0.98) | 0.041 | 0.57 (0.33–0.99) | 0.045 |
| Time from AMI to VSD repair | 0.96 (0.94–0.97) | <0.001 | 0.98 (0.96–0.99) | 0.021 |
| Age | 1.02 (1.00–1.04) | 0.013 | 1.01 (0.99–1.03) | 0.387 |
| Female sex | 0.93 (0.67–1.29) | 0.677 | 0.84 (0.59–1.21) | 0.353 |
| Diabetes mellitus | 0.90 (0.60–1.33) | 0.585 | 0.65 (0.41–1.06) | 0.082 |
| Hypertension | 1.32 (0.98–1.79) | 0.067 | 1.28 (0.91–1.79) | 0.151 |
| PCI to IRA | 1.39 (1.03–1.87) | 0.032 | 1.48 (1.07–2.03) | 0.016 |
| Creatinineb | 1.03 (1.01–1.05) | <0.001 | 1.03 (1.01–1.04) | 0.005 |
| Number of vessels with coronary artery disease | 1.10 (0.91–1.32) | 0.329 | 1.17 (0.96–1.44) | 0.127 |
| NYHA class | 1.43 (1.17–1.74) | <0.001 | 1.17 (0.94–1.46) | 0.154 |
| Cardiogenic shock | 2.45 (1.74–2.60) | <0.001 | 2.17 (1.43–3.29) | <0.001 |
| RV dysfunctionc | 0.87 (0.61–1.23) | 0.426 | 0.77 (0.51–1.16) | 0.213 |
Reference group is surgical management.
Per 10-unit increase.
Reference group is normal RV size and function (ejection fraction >50%).
Enter algorithm was used. HR value corresponds to 1 unit increase/decrease for continuous variables (except creatinine).
aHR, adjusted hazard ratios; AMI, acute myocardial infarction; CI, confidence interval; HR, hazard ratios; IRA, infarct-related artery; NYHA, New York Heart Association; PCI, percutaneous coronary intervention; RV, right ventricle; VSD, ventricular septal defect.
Discussion
This study is the first substantive national published data comparing surgical and percutaneous closure of PIVSD. It also includes the largest series of percutaneous closures published to date. There are between 30 000 and 35 000 ST-elevation myocardial infarction (STEMI) reported to the National Institute for Cardiovascular Outcomes Research in the UK each year. An estimate around 0.2% of cases resulting in PIVSD suggests that there may have been around 700 cases of PIVSD in the UK during the time period of the study.18,19 Although this number is speculative, given that the estimate includes cases that were treated palliatively, and cases who died before treatment, it suggests that relatively few treated cases have escaped the analysis.
The study demonstrates that despite advances in technology over the last few decades, mortality from this feared complication remains stubbornly high, regardless of the treatment approach used. There was a small but statistically significant difference in in-hospital mortality between the surgical and percutaneous groups despite more stroke, renal replacement therapy and pneumonia in the surgical group. Reassuringly, once patients reached the threshold for hospital discharge, mortality in both groups was low, confirming that clinical benefits of repair are durable with either treatment (Structured Graphical Abstract).
The regression analysis evaluated possible factors independently associated with both long-term and in-hospital mortality. The results were similar in both instances as the in-hospital mortality represented the bulk of deaths in the cohort. Choice of intervention did prove to be a factor independently associated with mortality with initial surgical repair associated with lower mortality than percutaneous repair. The difference between unadjusted in-hospital mortality was small and given the nature of these patients may reflect unmeasured confounders (including frailty) in the dataset. Many patients were likely to be ineligible for one of the treatment options. Some centres only use percutaneous treatment for patients turned down for surgery, introducing a selection bias which is hard to adjust for statistically. Comparisons between the two groups are further confounded by the significant cross over in both directions between the two groups despite patients remaining in the group of initial treatment according to pre-specified analysis methodology. The authors believe that the two treatment approaches are complementary and given historically reported conservative management mortality rates of 94%,2 the important message is that some form of treatment should be offered if deemed appropriate by the heart team. The authors believe that given the emergence of two broadly complementary management strategies, there is increased importance in selecting appropriate patients in the heart team. The development of a PIVSD pathway permitting systemic assessment of patients in a dedicated multi-disciplinary heart team meeting allows better understanding of the anatomy and its physiological consequences and hence more appropriate selection of patients likely to benefit from treatment. Examples of dedicated PIVSD pathways, multi-disciplinary heart teams and suitable selection criteria have previously been published.4 Evidence for the effectiveness of heart teams has been limited despite adoption into guidelines and is an ongoing research need.
This is the largest dataset of percutaneous procedures published, and it showed mortality for both procedures was substantially lower than medical therapy in historic literature.2 Both procedures are technically demanding, and the availability of experienced operators within a centre may affect the choice of intervention.
Cardiogenic shock at baseline was a strong factor independently associated with mortality, reflecting the adverse prognosis associated with haemodynamic compromise after PIVSD. This is consistent with large observational studies following patients undergoing surgical repair.3,20 PCI to the infarct-related artery was a factor independently associated with mortality, which emphasizes the long-established futility of revascularization of an infarcted territory. Patients with multiple procedures were more likely to survive. A substantial component of this effect is undoubtedly survivorship bias, but some centres will advocate early percutaneous closure to limit the effect of the shunt, followed by definitive surgical or percutaneous closure later if required.21
Surprisingly, age was not a factor independently associated with mortality but was associated with a percutaneous approach which was then associated with increased mortality, perhaps highlighting the difficultly in determining which factors most drive the difference in outcomes. The median age of patients in the percutaneous group was 5 years older than in the surgical group which is a substantial difference. The oldest patients with PIVSD may well have been excluded from this analysis, either by not surviving to their procedure, or being treated palliatively upfront. Finally, RV function was not predictive of outcome in this analysis. RV function has been considered a strong predictor of survival, and this often forms part of clinical discussions around the futility of intervention.22,23 However, assessment of RV function has not formed part of recent database analyses evaluating predictors of mortality after surgical repair.3 In this study echocardiographic assessment of RV function was not associated with mortality. This may again reflect the absence of patients with the most severely impaired RVs, treated palliatively instead. Furthermore, the crude assessment of RV function may not be detailed enough to distinguish between degrees of impairment.
Timing of repair has long been a matter of debate. European guidelines recommend early intervention, whilst observational studies suggest that delayed treatment is associated with increased survival.24 This observational study again shows that late repair is associated with lower mortality. Observational studies of PIVSD are limited by selection and survivorship bias when the timing of repair is considered. Patients who are sicker, or deteriorate faster, may be forced into earlier procedures. Patients who appear haemodynamically stable may be ‘temporized’ but if their clinical situation acutely deteriorates then they may no longer be fit for repair and excluded from the analysis. The authors believe that whilst a brief period of intensive optimization of a couple of days to improve the patient’s clinical state is acceptable, additional delays to allow ‘tissues to firm up’ is unlikely to benefit the individual patient. Whilst the surgical procedure for those who survive to this point is undoubtedly easier, and the patients course smoother, the number of patients who die during this ‘waiting period’ is unfortunately not recorded and can be regarded as a trial of life rather than further optimization. It is likely that the timing for intervention will remain controversial and will be determined by patient circumstances and operator opinion. The development of dedicated PIVSD pathways and multi-disciplinary heart team decision making may help to reduce unnecessary variation in the care that patients receive. Hypotheses regarding timing of intervention will remain difficult to prove in the absence of prospective data, including all individuals assessed as eligible for repair including those who die whilst awaiting an intervention.
As a secondary analysis, factors independently associated with a percutaneous approach were analysed, to understand the rationale for choosing that treatment option (see Supplementary material online, Table S3). Smaller defects and rising age lead to increased chance of percutaneous treatment, perhaps as might be expected. Interestingly, patients treated in centres with lower procedural volume were more likely to have percutaneous closure. This may reflect a greater opportunity for percutaneous treatment in centres where cardiac surgeons are more reluctant to take on cases with such high mortality. The use of the formal heart team review was higher in the percutaneous group. In some cases, informal discussion was documented which may reflect the urgent nature of decision making and the need to act rapidly without convening the full heart team meeting. The heart team is a key component of the management of complex cardiac conditions in modern healthcare and facilitates shared decision making, together with appropriate and considered recommendations to patients. The data provided from this study may facilitate clearer discussion in future heart team meetings.
Randomized trials are unlikely given the low frequency of cases presenting even to large centres and the lack of equipoise between therapies in most cases. However, prospective registries, that include all patients, treated or otherwise, would help with evidence around timing of treatment. Furthermore, there was limited use of mechanical circulatory support beyond IABP. This reflects availability of other technologies in the UK over the past decade, and also uncertainty regarding the correct approach. Case reports and small case series suggest a number of options including Impella (Abiomed, Santa Clara, CA), veno-arterial extra-corporeal membrane oxygenation and ventricular assist devices may have a role.25–31 Only a single patient went on to cardiac transplantation and did survive. Further evidence regarding consideration of early transplant would be welcome.
Limitations
The primary limitation of this study is its retrospective observational nature. However, given the number of UK centres providing data, it is likely to include the vast majority of cases undertaken in the UK over the last decade. The study also avoided the challenges of coding data, and incomplete databases by using detailed case note review. The study naturally only includes patients that underwent at least one procedure. It precludes patients who were selected for a procedure but did not survive to undergo it, and patients considered too unwell or frail to be offered either surgery or percutaneous closure. It is impossible to adjust for all clinical factors, and important confounders such as frailty were not available. It is impossible to know what proportion of patients was truly eligible for both procedures. There will likely be a substantial group of patients deemed too frail for surgery who had percutaneous treatment. All these factors undoubtedly introduce selection bias to the manuscript. In addition, the size of the cohort and the absence of data on important confounders make statistical tests such as propensity score matching inappropriate. Regardless, the study shows that both procedures are viable, with durable long-term outcomes if patients survive to discharge. In addition, whilst several factors identified to predict outcomes were statistically significant, the closeness to unity of some such as Creatinine and Timing makes clinical relevance of the result uncertain.
Conclusion
Mortality remains high for patients presenting with PIVSD, regardless of treatment modality. In this UK wide observational study, both modalities appeared substantially better than the historically reported mortality with medical therapy. There was no difference in long-term mortality between percutaneous and surgical repair; however, surgery was associated with lower unadjusted in-hospital mortality, despite increased risk of stroke, renal replacement therapy, and pneumonia. Shared heart team decision making remains key in the management of this condition.
Supplementary material
Supplementary material is available at European Heart Journal online.
Acknowledgements
The authors acknowledge the large number of operators and other staffs who have contributed to the care of patients with PIVSD in the UK over the past decade, and whose clinical care is reflected in this manuscript.
Funding
There were no sources of funding associated with this study. Dr Giblett is funded through the National Institute for Health Research North-West Coast (NIHR NWC) Research Scholar Programme.
Data availability
The data underlying this article cannot be shared publicly for the privacy of individual patients that participated in the study.
References
Author notes
Conflict of interest: B.R.C. has received speaking fees from Abbott Vascular. P.M. has provided expert testimony and worked as a speaker for Edwards Lifesciences. J.B. has worked as a proctor for Abbott Vascular. M.S.T. has worked as a consultant and received educational grants from Occlutech. He has worked as a consultant and proctor for Abbott Vascular. D.B.N. has worked as a proctor for Abbott Vascular. D.H.-S. has received travel support and worked as a proctor for Abbott Vascular and Boston Scientific; he has received consulting fees and participated in a data and safety monitoring board for Abbott Vascular. M.A.M. has received non-restrictive educational grants from Abbott Vascular and Terumo, and worked as a consultant for Daiichi Sankyo and Terumo. P.A.C. has worked as a proctor for Abbott Vascular, Gore Medical and Occlutech.

