


Abstract
The aim of this study was to explore the association of pregnancy loss (PL) with the incidence of cardiovascular disease (CVD) and examine the extent to which this relation is mediated by subsequent metabolic disorders.
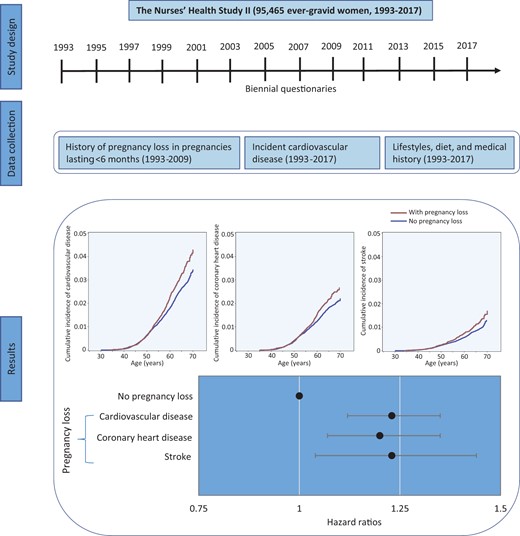
We followed 95 465 ever-gravid women participating in the Nurses’ Health Study II between 1993 and 2017. Cox proportional hazards models were used to estimate the hazard ratios (HRs) of CVD, including coronary heart disease (CHD), and stroke, according to the occurrence of PL. A mediation analysis was conducted to explore the intermediating effect of subsequent type 2 diabetes, hypertension, or hypercholesterolaemia. During 2 205 392 person-years of follow-up (mean 23.10 years), 2225 (2.3%) incident CVD cases were documented. After adjusting for confounding factors, PL was associated with an HR of 1.21 [95% confidence interval (CI) 1.10–1.33] for CVD during follow-up. A similar association was observed for CHD (HR 1.20; 95% CI 1.07–1.35) and stroke (HR 1.23; 95% CI 1.04–1.44). The risk of CVD increased with the number of PLs [HR 1.18 (95% CI 1.06–1.31) for 1 and 1.34 (95% CI 1.13–1.59) for ≥2 times] and was greater for PL occurring early in reproductive lifespan [HR 1.40 (95% CI 1.21–1.62) for age ≤23 years, 1.25 (95% CI 1.09–1.43) for age 24–29 years, and 1.03 (95% CI 0.88–1.19) for age ≥30 years]. Hypertension, hypercholesterolaemia, and type 2 diabetes all explained <1.80% of the association between PL and CVD.
PL was associated with a greater CVD risk, independently of subsequent development of metabolic disorders.
Pregnancy loss was associated with a greater risk of cardiovascular disease, including coronary heart disease and stroke
Results from the Nurses’ Health Study II showed that women with a history of pregnancy loss (PL) had a higher risk of cardiovascular disease (CVD), particularly women who experienced more than one PL and women who experienced their first PL before age 30 years. The relation persisted regardless of the subsequent development of type 2 diabetes, hypertension, or hypercholesterolaemia, suggesting that PL is an independent early marker of cardiovascular morbidity. Our findings emphasize the importance of considering a woman’s reproductive history when evaluating her CVD risk.
Introduction
Cardiovascular disease (CVD), including coronary heart disease (CHD) and stroke, is the leading cause of mortality in both men and women and accounts for one-third of all deaths worldwide.1 However, growing evidence shows that the pathophysiology of CVD in women differs from men,2 suggesting sex differences in the causes of CVD. For instance, women are more likely to develop endothelial dysfunction, microvascular coronary disease, and heart failure with preserved ejection fraction, compared to men who are more likely to suffer from obstructive coronary disease and heart failure with reduced ejection fraction.3 In addition to traditional risk factors that affect both men and women (e.g. elevated blood pressure, diabetes mellitus, elevated cholesterol, tobacco use, obesity, and unhealthy diet), early-life reproductive factors unique to women have also been associated with long-term risk of CVD morbidity and mortality.4–7
Spontaneous pregnancy loss (PL), most of which occur before 20 weeks of gestation, is a common adverse outcome of pregnancy that affects 12–24% of clinically recognized pregnancies.6 A history of PL, particularly recurrent PL, has been linked to a higher risk of CHD, but not stroke, in most previous population studies.8–16 However, the underlying mechanisms behind these associations, which have the potential to identify high-risk women for early screening and intervention, remain unclear. Growing evidence shows that PL is associated with a higher risk of subsequent metabolic disorders, including hyperglycaemia, hypertension, and hypercholesterolaemia,17 all of which are well-known risk factors for CVD.18 Yet, no study has explored whether these metabolic phenotypes mediate the association between PL and CVD risk. Moreover, previous studies reported that the risk of CVD mortality differed according to the number of PL and age at first PL and that the risk of CVD-related metabolic disorders was particularly increased among women who experienced late PL (12–19 gestational weeks).6 , 17 However, it is unclear whether these associations pertain to CVD morbidity. Therefore, we evaluated the association of PL (overall and according to number, age, and gestational age at PL) with the incidence of CVD and examined the extent to which this relation is mediated by subsequent metabolic disorders such as type 2 diabetes, hypertension, or hypercholesterolaemia among US women participating in a large ongoing cohort study, the Nurses’ Health Study II (NHSII).
Methods
Study population
The NHSII is an ongoing prospective cohort established in 1989 by recruiting 116 429 US reproductive-aged female nurses (age range: 25–42 years). All women have been monitored biennially using validated questionnaires that collect information on lifestyle factors, health conditions, and medical histories. The cumulative follow-up rates exceed 90%. This analysis included ever-gravid women (n = 102 607) ascertained either at baseline (1989) or during follow-up through biennial questionnaires (1991–2009). Participants initially reported PL history in 1993, which, thus, served as the analysis baseline. We excluded women who had missing data on birthday (n = 17) or diagnosis date of hypertension or hypercholesterolaemia (n = 2295), had received a diagnosis of CVD prior to 1993 (n = 1122) or metabolic disorders (i.e. type 2 diabetes, hypertension, or hypercholesterolaemia) before first pregnancy(n = 2642), declined to report PL history (n = 14), had died prior to 1993 (n = 124), or never returned follow-up questionnaires (n = 928). After exclusions, 95 465 women were included in the current analysis. The NHSII protocol was approved by the institutional review boards of the Brigham and Women’s Hospital and Harvard T.H. Chan School of Public Health, and those of participating registries as required. Returning completed questionnaires indicated informed consent.
Ascertainment of reproductive history
In the 1993 questionnaire, participants recalled their lifetime history of pregnancies, including the history of PL and induced abortion in pregnancies lasting less than 6 months at different age ranges (<18, 18–20, 21–23, 24–26, 27–29, 30–34, and ≥35 years). In subsequent biennial questionnaires (1995–2009), participants reported pregnancies in the previous 2-year period, including those ending in PL and induced abortion. In 2009, when the majority of participants had reached menopause, participants also recalled their lifetime pregnancies, including the year and gestation length of every pregnancy, as well as pregnancy ending in PL. Among women who completed the 2009 questionnaire, the proportion of women reporting PL in the biennial questionnaires that were identified as such in 2009 were 83.7% (14 712 of 17 279); the proportion of women who did not report PL in the biennial questionnaires that were identified as such in 2009 were 94.4% (43 704 of 46 562). In previous validation studies, the sensitivity of self-reported PL was 75%.19 , 20 Because of the high reproducibility of self-reported PL, we only used PL reported in the biennial questionnaires in our main analysis.
CVD ascertainment
The primary study outcome was fatal and non-fatal CHD and stroke. In every follow-up questionnaire, participants reported whether they had physician-diagnosed CHD {myocardial infarction or coronary revascularization [coronary artery bypass graft (CABG) surgery or percutaneous coronary intervention (PCI)] or stroke (hemorrhagic or ischaemic stroke}. For women who reported any of these incident events, medical records were reviewed by research staff. Nonfatal myocardial infarction was confirmed according to the World Health Organization criteria that include symptoms plus either diagnostic electrocardiographic changes or elevated cardiac-specific enzymes.21 Nonfatal stroke was confirmed according to the National Survey of Stroke criteria that include a new focal neurological deficit with a sudden or rapid onset that lasted >24 hours or until the death of a vascular cause.22 CABG and PCI were self-reported, which has been demonstrated to be highly reliable in previous studies.23 Deaths were identified from next of kin, postal authorities, and periodic searches of the National Death Index. Fatal CVD events were confirmed by review of autopsy records or death certificates.
Covariates
Reports of physician-diagnosed metabolic disorders, including chronic hypertension, type 2 diabetes, and hypercholesterolaemia, were collected by biennial questionnaires. Diagnoses of type 2 diabetes were confirmed by a validated supplemental questionnaire based on the 1997 American Diabetes Association criteria.24 In previous validation studies conducted in this cohort and the Nurses’ Health Study, medical record review has confirmed 98% of self-reported type 2 diabetes,25 94% of self-reported hypertension,26 and 86% of self-reported hypercholesterolaemia,27 indicating that self-reported metabolic disorders were highly reliable.
Height and race/ethnicity were collected at recruitment. Body weight, lifestyle risk factors (e.g. smoking), reproductive characteristics (e.g. infertility history, parity, gravidity, gestational diabetes, and hypertensive disorders of pregnancy), and health-related conditions (e.g. menopausal status, aspirin use) were updated every 2 years since 1989. Ovulation stimulation treatment (e.g. clomiphene and gonadotropins) was ascertained every 2–4 years since 1993. Clinician-diagnosed depression was collected in biennial questionnaires since 2003. Personality symptoms of phobic anxiety were assessed using the Crown-Crisp phobic anxiety scale in 1993 and 2005. Body mass index (BMI) at age 18 years and during each follow-up cycle was calculated as the weight in kilograms divided by the square of the height in metres. Information on physical activity and alcohol consumption was collected every 4–6 years since 1991. Usual dietary intake was assessed every 4 years since 1991 using a semiquantitative food-frequency questionnaire. We calculated the 2010 Alternative Healthy Eating Index (AHEI) to evaluate participants’ overall dietary quality.6 Self-reported body weight, smoking habit, physical activity, and diet in this cohort were also demonstrated to be highly reliable.6
Data analysis
Person-time was calculated from the date of return of the 1993 questionnaire or follow-up questionnaires when participants reported a pregnancy until the date of CVD diagnosis, death, or the end of follow-up (30 June 2017), whichever occurred first. Lifetime PL reported in 1993 and updated on subsequent biennial questionnaires was used to ascertain exposure status. Gravid women without a history of PL were regarded as the comparison group regardless of the occurrence of induced abortion. In 1993, when follow-up time began, gravid women were assigned exposure status based on their self-reported history of PL. Exposure status was updated every 2 years depending on the outcome of subsequent pregnancies. Hence, women without a history of PL in 1993 who reported a PL during follow-up would contribute both unexposed and exposed person-time. Incidence rates of CVD in each category of the exposure variable were calculated as the number of incident cases divided by the total person-time at risk.
Kaplan–Meier curves for the cumulative incidence of CVD were generated by %LEFTTRUNC SAS macro using left-truncated data.28 We used time-dependent Cox proportional hazards models with age as the underlying time strata to estimate the hazard ratios (HRs) and 95% confidence intervals (CIs) for the association between PL and risk of CVD, CHD, and stroke (see description of Cox model in the Supplementary material online). We then evaluated the risk of CVD according to the number of PL throughout the reproductive lifespan (1 or ≥2) and age at first PL (≤23, 24–29, or ≥30 years). Also, we explored the influence of early (<12 gestational weeks) and late PL (12–19 gestational weeks) and change in PL status in the first and subsequent pregnancies by restricting the analysis to women who responded to the 2009 questionnaire, as this questionnaire collected gestation length of every pregnancy and captured total reproductive history without risk of double counting any pregnancies. The proportional hazards assumption was confirmed based on the likelihood ratio tests comparing a model including a multiplicative interaction term between PL and follow-up time to model without such a term (P > 0.05). Covariates were selected a priori and were then added in the multivariable models based on statistical considerations.29 Covariates with a P-value of <0.2 in their relationship with CVD or PL in the preliminary bivariate analyses were included in a ‘full’ model. Covariates with a P-value of >0.15 in full models were removed from the final models. Adjusted covariates in the final multivariable models included race/ethnicity, as well as time-varying age, infertility history, BMI at age 18 years, history of gestational diabetes, hypertensive disorder of pregnancy, menopausal status, hormone therapy, breastfeeding duration, daily aspirin use, marital status, and parental history of myocardial infarction or stroke. In a secondary multivariable model, we further adjusted for lifestyle predictors of CVD, including time-varying smoking status, BMI, physical activity, and the AHEI 2010 score. Data from the prior questionnaire were carried forward for the covariates with missing values (all <5%); for incomplete data, we then created a missing category indicator.
To explore the mediating effect of metabolic disorders on the risk of CVD, we jointly classified participants according to PL history and subsequent incident type 2 diabetes, hypertension, and hypercholesterolaemia. We then estimated the proportion of CVD risk related to PL history attributable to metabolic disorders using the publicly available %mediate macro developed by Lin and colleagues,30 by comparing the effect estimation from the full model that included the history of PL, a potential intermediate metabolic disorder, and covariates to the effect estimation obtained from a partial model that leaves out the intermediating factors. Finally, we tested for effect modification by metabolic disorders (type 2 diabetes, hypertension, and hypercholesterolaemia), reproductive characteristics (infertility history, ovulation stimulation treatment, and finally attained parity and gravidity), and risk factors of CVD (depression, phobic anxiety symptoms, hypertensive disorders of pregnancy, parental history of CVD, aspirin use, BMI, diet quality score, and smoking status). The interactions between PL and covariates on CVD risk were examined using the likelihood ratio test.6
Several sensitivity analyses were conducted. First, we jointly classified participants according to their history of PL and induced abortion to explore whether the interruption of pregnancy, rather than PL, was responsible for our findings. Second, we analysed the associations between PL and the incidence of CVD by (i) excluding women reporting induced abortion, stillbirth, or tubal/ectopic pregnancy from the comparison group to test if our findings were biased by these adverse birth outcomes; (ii) excluding self-reported cases of coronary revascularization (CABG or PCI) to assess the influence of potential outcome misclassification; (iii) additionally adjusted for time-varying gravidity (1, 2, 3, or ≥4) and parity (never vs. ever) to assess if our findings were influenced by gravidity and parity; (iv) including BMI at baseline and weight gain during follow-up instead of time-varying BMI in the Cox regression to assess the influence of weight change during adulthood; (v) including women who had missing data on diagnosis date of hypertension or hypercholesterolaemia to test for potential selection bias; (vi) calculating follow-up time from the time of PL or first pregnancy lasting at least 6 months; and (vii) additionally adjusting for age at first pregnancy in the Cox regression and conducting stratified analysis by age at first PL or pregnancy lasting ≥6 months to explore the influence of age at pregnancy. Third, we explored the mediating effect of ovulation stimulation treatment, depression, and phobic anxiety symptom scores, although we could not ascertain if these conditions developed after PL. All data were analyzed using SAS 9.3 for UNIX (SAS Institute Inc, Cary, NC, USA).
Results
Among 95 465 women included in the current analysis, 24 431 (25.6%) women experienced at least one PL by the end of follow-up (Table 1). Age-standardized baseline demographic characteristics, lifestyle factors, health conditions, and medical histories by PL reported either at baseline or during follow-up are shown in Table 1. Compared with women without a history of PL, women with a history of PL had higher mean gravidity [3.38 (SD 1.69) vs. 2.32 (1.21)] and were more likely to be premenopausal (93% vs. 86%) and have a history of infertility (30% vs. 19%) at baseline.
Age-standardized baseline (1993) demographic characteristics, lifestyle factors, health conditions, and medical histories according to pregnancy loss reported either at baseline or during follow-up among 95 465 ever-gravid women in the Nurses’ Health Study II
| Baseline characteristics | History of PL reported either at baseline or during follow-up | |
|---|---|---|
| No | Yes | |
| No. | 71 034 | 24 431 |
| Age,a years | 38.9 (4.64) | 38.38 (4.63) |
| Total physical activity, h/week | 2.75 (4.06) | 2.77 (3.97) |
| AHEI-2010 dietary score | 47.56 (10.66) | 48.01 (10.72) |
| Alcohol, g/day | 3.05 (6.01) | 2.96 (5.67) |
| Gravidity | 2.32 (1.21) | 3.38 (1.69) |
| History of induced abortion | 15 | 17 |
| History of infertility | 19 | 30 |
| Premenopausal | 86 | 93 |
| Parous | 89 | 87 |
| History of gestational diabetes | 5 | 6 |
| History of hypertensive disorders of pregnancy | 13 | 15 |
| Ever or currently married | 96 | 97 |
| Aspirin useb | 7 | 8 |
| Parental history of myocardial infarction or stroke | 26 | 27 |
| BMI at age 18 years, kg/m2 | 21.06 (3.02) | 21.05 (3.08) |
| Current BMI | ||
| <25 kg/m2 | 62 | 63 |
| 25–29.9 kg/m2 | 23 | 22 |
| ≥30 kg/m2 | 15 | 15 |
| Smoking status | ||
| Never | 65 | 65 |
| Past | 24 | 24 |
| Current | 11 | 11 |
| Race/ethnicity | ||
| Non-Hispanic White | 92 | 93 |
| Non-Hispanic Black | 2 | 1 |
| Hispanic | 2 | 2 |
| Other | 4 | 4 |
Values are given as mean (standard deviation) or percentages and are standardized to the age distribution of the study population.
PL, pregnancy loss.
Value is not age-adjusted.
Aspirin or aspirin-containing products used regularly at least once per week in the past 2 years.
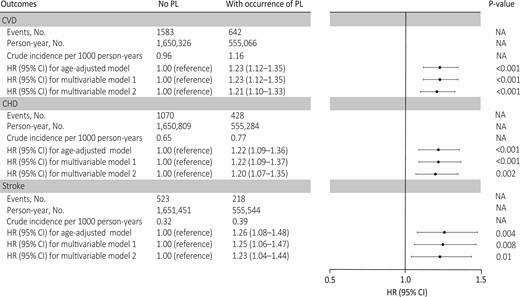
During 2 205 392 person-years of follow-up (mean 23.10 years), 2112 nonfatal and 113 fatal incident CVD cases were documented (2.3%; 2225 of 95 465), including 1498 CHD and 741 stroke cases. The mean (SD) follow-up time for women with and without PL was 23.20 (2.58) and 23.09 (2.64) years, respectively. The cumulative incidence of CVD was higher among women who experienced PL than women without PL (Graphical Abstract). The crude incidence of CVD for women with and without PL was 1.16 and 0.96 per 1000 person-years, respectively (Figure 1). The corresponding age-adjusted HR for CVD during follow-up was 1.23 (95% CI 1.12–1.35; Figure 1). After adjusting for confounding factors, PL was associated with an HR of 1.23 (95% CI 1.12–1.35) for CVD during follow-up. Additional adjustment for time-varying lifestyle risk factors for CVD had minimal impact on the association (HR 1.21; 95% CI 1.10–1.33). Similar risks were found when CHD and stroke were separately evaluated. Specifically, PL was associated with an HR of 1.20 (95% CI 1.07–1.35) for CHD and 1.23 (95% CI 1.04–1.44) for stroke in the fully adjusted models (Figure 1).
Adjusted hazard ratios (95% confidence interval) of cardiovascular disease, coronary heart disease, and stroke according to the occurrence of pregnancy loss among 95 465 ever-gravid women (Nurses’ Health Study II, 1993–2017). In the age-adjusted model, age in months (continuous) at the start of follow-up and calendar year of the current questionnaire cycle were included as stratified variables. Based on the age-adjusted model, multivariable model 1 was further adjusted for White race/ethnicity (yes vs. no), parental history of myocardial infarction or stroke (yes/no), body mass index at age 18 years (<19, 20.5–21.9, 22–24.9, 25–29.9, or ≥30 kg/m2), and time-varying history of gestational diabetes (yes vs. no), hypertensive disorders of pregnancy (yes vs. no), menopausal status (premenopausal, postmenopausal, or unsure/biologically uncertain), current hormone therapy use (never, past, or current), breastfeeding duration (<3, 3–12, or >12 months), daily aspirin use (yes vs. no), infertility (never vs. ever), and marital status (ever/currently married vs. never). Based on multivariable model 1, multivariable model 2 was further adjusted for time-varying smoking status (never, former, or current), physical activity (0, 0.1–1.0, 1.1–2.4, 2.5–5.9, or ≥6 h/week), and Alternative Healthy Eating Index 2010 diet quality score (quintiles), and body mass index (<23, 23–24.9, 25–29.9, ≥30 kg/m2). PL, pregnancy loss; NA indicates not applicable.
The risk of incident CVD increased with the number of PLs experienced (Table 2). The multivariable adjusted HR for incident CVD was 1.18 (95% CI 1.06–1.31) for one PL and 1.34 (95% CI 1.13–1.59) for two or more PLs. Similarly, the risk of CVD was greater for PLs occurring earlier in women’s life (Table 2), with decreasing risk of CVD with increasing age at first PL and no increased risk of CVD among women whose first PL took place after age 30 years [HR 1.40 (95% CI 1.21–1.62) for age ≤23 years, 1.25 (95% CI 1.09–1.43) for age 24–29 years, and 1.03 (95% CI 0.88–1.19) for age ≥30 years]. This pattern of association was less obvious for stroke (Table 2). When the analysis was restricted to participants who responded to the 2009 questionnaire (Table 3), late PL (12–19 gestational weeks) was associated with a greater risk of CVD (HR 1.31; 95% CI 1.10–1.56), compared to women without PL. In addition, the elevated risk of CVD was higher among women who experienced PL only in the first pregnancy [HR 1.27 (95% CI 1.07–1.50)] and those reporting PL both in the first and subsequent pregnancies [HR 1.31 (95% CI 0.98–1.75)], compared to women without PL in all pregnancies.
Adjusted hazard ratios of cardiovascular disease, coronary heart disease, and stroke according to the number of pregnancy loss and age at first pregnancy loss among 95 465 ever-gravid women (Nurses’ Health Study II, 1993–2017)
| Outcomes | Events, no. | Crude incidence per 1000 person-years | HRs (95% CI) | ||
|---|---|---|---|---|---|
| Age-adjusted modela | Multivariable model 1b | Multivariable model 2c | |||
| Number of PL | |||||
| CVD | |||||
| None | 1583 | 0.96 | 1.00 (reference) | 1.00 (reference) | 1.00 (reference) |
| 1 | 497 | 1.14 | 1.19 (1.07–1.31) | 1.19 (1.08–1.32) | 1.18 (1.06–1.31) |
| ≥2 | 145 | 1.24 | 1.43 (1.20–1.69) | 1.38 (1.16–1.64) | 1.34 (1.13–1.59) |
| P for trend | <0.001 | <0.001 | <0.001 | ||
| CHD | |||||
| None | 1070 | 0.65 | 1.00 (reference) | 1.00 (reference) | 1.00 (reference) |
| 1 | 324 | 0.74 | 1.14 (1.01–1.29) | 1.16 (1.02–1.32) | 1.15 (1.01–1.30) |
| ≥2 | 104 | 0.89 | 1.53 (1.25–1.87) | 1.48 (1.20–1.81) | 1.44 (1.17–1.76) |
| P for trend | <0.001 | <0.001 | <0.001 | ||
| Stroke | |||||
| None | 523 | 0.32 | 1.00 (reference) | 1.00 (reference) | 1.00 (reference) |
| 1 | 174 | 0.40 | 1.26 (1.06–1.50) | 1.25 (1.05–1.48) | 1.23 (1.03–1.47) |
| ≥2 | 44 | 0.38 | 1.28 (0.94–1.75) | 1.25 (0.91–1.71) | 1.21 (0.88–1.65) |
| P for trend | 0.006 | 0.01 | 0.02 | ||
| Age at first PL | |||||
| CVD | |||||
| None | 1583 | 0.96 | 1.00 (reference) | 1.00 (reference) | 1.00 (reference) |
| ≥30 years | 200 | 0.86 | 0.96 (0.82–1.11) | 0.99 (0.85–1.15) | 1.03 (0.88–1.19) |
| 24–29 years | 241 | 1.18 | 1.27 (1.10–1.45) | 1.27 (1.10–1.45) | 1.25 (1.09–1.43) |
| ≤23 years | 201 | 1.70 | 1.65 (1.43–1.92) | 1.53 (1.32–1.77) | 1.40 (1.21–1.62) |
| P for trend | <0.001 | <0.001 | <0.001 | ||
| CHD | |||||
| None | 1070 | 0.65 | 1.00 (reference) | 1.00 (reference) | 1.00 (reference) |
| ≥30 years | 123 | 0.53 | 0.87 (0.72–1.05) | 0.92 (0.76–1.11) | 0.95 (0.79–1.15) |
| 24–29 years | 164 | 0.80 | 1.28 (1.09–1.51) | 1.30 (1.10–1.53) | 1.28 (1.08–1.51) |
| ≤23 years | 141 | 1.19 | 1.70 (1.41–2.03) | 1.56 (1.30–1.86) | 1.42 (1.18–1.69) |
| P for trend | <0.001 | <0.001 | <0.001 | ||
| Stroke | |||||
| None | 523 | 0.32 | 1.00 (reference) | 1.00 (reference) | 1.00 (reference) |
| ≥30 years | 80 | 0.34 | 1.15 (0.91–1.46) | 1.17 (0.92–1.49) | 1.20 (0.94–1.53) |
| 24–29 years | 77 | 0.38 | 1.21 (0.95–1.53) | 1.19 (0.93–1.51) | 1.17 (0.91–1.49) |
| ≤23 years | 61 | 0.52 | 1.55 (1.19–2.03) | 1.45 (1.11–1.90) | 1.36 (1.04–1.78) |
| P for trend | <0.001 | 0.003 | 0.01 | ||
CI, confidence interval; CHD, coronary heart disease; CVD, cardiovascular disease; HRs, hazard ratios; PL, pregnancy loss.
Age in months (continuous) at the start of follow-up and calendar year of the current questionnaire cycle were included as stratified variables.
Based on the age-adjusted model, multivariable model 1 was further adjusted for White race/ethnicity (yes vs. no), parental history of myocardial infarction or stroke (yes/no), body mass index at age 18 years (<19, 20.5–21.9, 22–24.9, 25–29.9, or ≥30 kg/m2), and time-varying history of gestational diabetes (yes vs. no), hypertensive disorders of pregnancy (yes vs. no), menopausal status (premenopausal, postmenopausal, or unsure/biologically uncertain), current hormone therapy use (never, past, or current), breastfeeding duration (<3, 3–12, or >12 months), daily aspirin use (yes vs. no), infertility (never vs. ever), and marital status (ever/currently married vs. never).
Based on multivariable model 1, multivariable model 2 was further adjusted for time-varying smoking status (never, former, or current), physical activity (0, 0.1–1.0, 1.1–2.4, 2.5–5.9, or ≥6 h/week), Alternative Healthy Eating Index 2010 diet quality score (quintiles), and body mass index (<23, 23–24.9, 25–29.9, and ≥30 kg/m2).
Adjusted hazard ratios of cardiovascular disease according to early and late pregnancy loss and pregnancy loss status in the first and subsequent pregnancies among 63 841 women (Nurses’ Health Study II, 2009–2017)
| Types of PL | Events, no. | Crude incidence per 1000 person-years | HRs (95% CI) | ||
|---|---|---|---|---|---|
| Age-adjusted modelb | Multivariable model 1c | Multivariable model 2d | |||
| Early PL (<12 gestational weeks) | |||||
| Never | 1110 | 1.02 | 1.00 (reference) | 1.00 (reference) | 1.00 (reference) |
| Ever | 351 | 1.09 | 1.13 (1.00–1.28) | 1.12 (1.00–1.27) | 1.12 (0.99–1.27) |
| Late PL (12–19 gestational weeks) | |||||
| Never | 1110 | 1.02 | 1.00 (reference) | 1.00 (reference) | 1.00 (reference) |
| Ever | 149 | 1.29 | 1.34 (1.13–1.59) | 1.33 (1.12–1.58) | 1.31 (1.10–1.56) |
| PL status in the first and subsequent pregnancies | |||||
| No PL in the first or subsequent birthsa | 1150 | 1.02 | 1.00 (reference) | 1.00 (reference) | 1.00 (reference) |
| No PL in the first birth but reporting PL in subsequent births | 200 | 0.96 | 0.99 (0.85–1.15) | 1.03 (0.88–1.20) | 1.02 (0.88–1.19) |
| PL only in the first birtha | 162 | 1.32 | 1.34 (1.13–1.57) | 1.27 (1.07–1.50) | 1.27 (1.07–1.50) |
| PL both in the first and subsequent births | 49 | 1.25 | 1.32 (0.99–1.75) | 1.35 (1.01–1.80) | 1.31 (0.98–1.75) |
CI, confidence interval; HRs, hazard ratios; PL, pregnancy loss.
Including women without any additional births.
Age in months (continuous) at the start of follow-up and calendar year of the current questionnaire cycle were included as stratified variables.
Based on the age-adjusted model, multivariable model 1 was further adjusted for White race/ethnicity (yes vs. no), parental history of myocardial infarction or stroke (yes/no), body mass index at age 18 years (<19, 20.5–21.9, 22–24.9, 25–29.9, or ≥30 kg/m2), and time-varying history of gestational diabetes (yes vs. no), hypertensive disorders of pregnancy (yes vs. no), menopausal status (premenopausal, postmenopausal, or unsure/biologically uncertain), current hormone therapy use (never, past, or current), breastfeeding duration (<3, 3–12, or >12 months), daily aspirin use (yes vs. no), infertility (never vs. ever), and marital status (ever/currently married vs. never).
Based on multivariable model 1, multivariable model 2 was further adjusted for time-varying smoking status (never, former, or current), physical activity (0, 0.1–1.0, 1.1–2.4, 2.5–5.9, or ≥6 h/week), Alternative Healthy Eating Index 2010 diet quality score (quintiles), and body mass index (<23, 23–24.9, 25–29.9, and ≥30 kg/m2).
We then jointly classified women according to PL and subsequent development of type 2 diabetes, hypertension, or hypercholesterolaemia. In these analyses, the occurrence of PL was associated with a greater CVD risk regardless of the subsequent development of these conditions (Table 4). Mediation analysis showed that hypertension and hypercholesterolaemia explained 1.30% (95% CI 0.40–4.30%) and 1.70% (95% CI 0.70–3.80%) of the association between PL and CVD, respectively; whereas type 2 diabetes explained <1.00% of this association. A similarly small proportion of the association of PL with CVD was mediated by ovulation stimulation treatment, depression, and phobic anxiety symptom scores (all <2.20%; Supplementary material online, Table S1). There was no evidence of interaction between PL and metabolic disorders, lifestyle risk factors for CVD, gravidity, parity, depression, phobic anxiety symptoms, infertility history, or infertility treatment (Supplementary material online, Table S2).
Adjusted hazard ratios (95%) of cardiovascular disease according to the joint categories of pregnancy loss and subsequent metabolic disorders among 95 465 ever-gravid women (Nurses’ Health Study II, 1993–2017)
| Joint categories of PL and metabolic disorders | Events, no. | Crude incidence per 1000 person-years | HR (95% CI) | ||
|---|---|---|---|---|---|
| Age-adjusted modela | Multivariable model 1b | Multivariable model 2c | |||
| Type 2 diabetes | |||||
| No PL and type 2 diabetes | 1376 | 0.86 | 1.00 (reference) | 1.00 (reference) | 1.00 (reference) |
| PL only | 561 | 1.05 | 1.24 (1.12–1.37) | 1.25 (1.13–1.38) | 1.23 (1.11–1.36) |
| Type 2 diabetes only | 207 | 3.84 | 3.28 (2.82–3.81) | 2.45 (2.10–2.85) | 2.02 (1.73–2.36) |
| Both PL and type 2 diabetes | 81 | 4.09 | 3.60 (2.87–4.52) | 2.61 (2.07–3.29) | 2.18 (1.73–2.76) |
| Proportion mediated by type 2 diabetesa | 4.20% (2.40–7.20%) | 2.10% (1.00–4.30%) | <1.00% | ||
| Hypertension | |||||
| No PL and hypertension | 824 | 0.63 | 1.00 (reference) | 1.00 (reference) | 1.00 (reference) |
| PL only | 312 | 0.72 | 1.16 (1.02–1.32) | 1.17 (1.03–1.34) | 1.15 (1.01–1.31) |
| Hypertension only | 759 | 2.24 | 2.78 (2.50–3.08) | 2.20 (1.98–2.45) | 1.97 (1.76–2.19) |
| Both PL and hypertension | 330 | 2.78 | 3.52 (3.09–4.02) | 2.79 (2.44–3.20) | 2.49 (2.17–2.86) |
| Proportion mediated by hypertensiona | 8.30% (5.10–13.20%) | 3.50% (1.90–6.30%) | 1.30% (0.40–4.30%) | ||
| Hypercholesterolaemia | |||||
| No PL and hypercholesterolaemia | 661 | 0.60 | 1.00 (reference) | 1.00 (reference) | 1.00 (reference) |
| PL only | 249 | 0.68 | 1.16 (1.01–1.35) | 1.18 (1.02–1.37) | 1.16 (1.00–1.35) |
| Hypercholesterolaemia only | 922 | 1.68 | 2.16 (1.95–2.40) | 1.84 (1.66–2.05) | 1.66 (1.49–1.85) |
| Both PL and hypercholesterolaemia | 393 | 2.08 | 2.71 (2.38–3.08) | 2.30 (2.02–2.63) | 2.06 (1.80–2.35) |
| Proportion mediated by hypercholesterolaemiaa | 8.20% (5.10–13.00%) | 2.90% (1.60–5.20%) | 1.70% (0.70–3.80%) | ||
CI, confidence interval; CVD, cardiovascular disease; HR, hazard ratios; PL, pregnancy loss.
Estimated proportion of association between PL and CVD explained by tested metabolic disorders.
Age in months (continuous) at the start of follow-up and calendar year of the current questionnaire cycle were included as stratified variables.
Based on the age-adjusted model, multivariable model 1 was further adjusted for White race/ethnicity (yes vs. no), parental history of myocardial infarction or stroke (yes/no), body mass index at age 18 years (<19, 20.5–21.9, 22–24.9, 25–29.9, or ≥30 kg/m2), and time-varying history of gestational diabetes (yes vs. no), hypertensive disorders of pregnancy (yes vs. no), menopausal status (premenopausal, postmenopausal, or unsure/biologically uncertain), current hormone therapy use (never, past, or current), breastfeeding duration (<3, 3–12, or >12 months), daily aspirin use (yes vs. no), infertility (never vs. ever), and marital status (ever/currently married vs. never).
Based on multivariable model 1, multivariable model 2 was further adjusted for time-varying smoking status (never, former, or current), physical activity (0, 0.1–1.0, 1.1–2.4, 2.5–5.9, or ≥6 h/week), Alternative Healthy Eating Index 2010 diet quality score (quintiles), and body mass index (<23, 23–24.9, 25–29.9, and ≥30 kg/m2).
When we classified women reporting induced abortion into separate exposure groups (Supplementary material online, Table S3), there was no convincing association of induced abortion with CVD risk. The increased risk of CVD associated with PL persisted when the comparison group was restricted to women whose pregnancies ended in live birth only, when we excluded self-reported cases of coronary revascularization (CABG or PCI) from endpoints, when we included women who had missing data on diagnosis date of hypertension or hypercholesterolaemia, when we additionally adjusted for a series of covariates (e.g. age at first pregnancy, gravidity, parity, weight gain since recruitment), and when the follow-up period was calculated from the time of PL or first pregnancy (Supplementary material online, Table S4). The association of PL with a greater risk of CVD also persisted in all subgroups of women who were classified by similar age at first PL or pregnancies (≤23, 24–29, ≥30 years; Supplementary material online, Table S5).
Discussion
Results from this large longitudinal study with 24 years of follow-up indicate that women with a history of PL have a higher risk of CVD, particularly women who experienced more than one PL and women who experienced their first PL before age 30 years. The elevated risk of CVD appeared to be mainly driven by the small number of women who reported PL at a gestational age of 12–19 weeks and those who experienced PL in their first and subsequent pregnancies. Induced abortion was unrelated to CVD, suggesting that the interruption of pregnancy itself is not the aetiological mechanism but rather that the underlying pathophysiology resulting in an increased risk of PL may also lead to greater CVD morbidity. The relation of PL and CVD persisted regardless of the subsequent development of cardio-metabolic risk factors for CVD (type 2 diabetes, hypertension, or hypercholesterolaemia). These findings further highlight how reproductive events throughout a woman’s life course can serve as independent signs or markers of increased susceptibility to CVD and other serious morbidities.
Our findings are in agreement with the preponderance of previous findings showing that PL, and particularly recurrent PL, are associated with a greater risk of CVD or CHD. The majority of the evidence to date comes from retrospective cohorts and disease registry databases,8 , 10–12 most of which have reported higher CVD risk among women with a history of PL, although some have reported no relation.13 , 14 Similarly, prospective cohort studies also revealed that women with a history of PL had a greater risk of CVD than women without pregnancies ending in PL.9 , 15 Evidence linking PL to stroke has been less consistent,8 , 9 , 15 , 16 probably because these previous studies ascertained pregnancy history either through hospital register databases or retrospective recall at a single time point in the long-distant past, which could have led to exposure misclassification. In the present study, we found a positive association between PL and stroke risk, which was consistent with the findings among 302 669 women aged 30–79 from the China Kadoorie Biobank,9 suggesting that sufficient sample size is also important for precise risk estimations.
Our findings extend and refine evidence from previous studies. To our knowledge, this study is the first to explore whether type 2 diabetes, hypertension, and hypercholesterolaemia—three well-established risk factors for CVD morbidity and mortality,18 which are also associated with PL in this cohort17—may mediate the association between PL and CVD risk. However, to our surprise, the proportion of the association between PL and CVD mediated by type 2 diabetes, hypertension, or hypercholesterolaemia was extremely small (all <1.80%). A similarly small proportion of the association of PL with CVD was mediated by ovulation stimulation treatment, depression, and phobic anxiety symptom scores (all <2.20%). We also found no evidence of effect modification by metabolic disorders, lifestyle risk factors for CVD, or reproductive characteristics. Together, these results suggest that PL is an independent early marker of cardiovascular morbidity. Interestingly, we noticed that the association between PL and CVD was stronger among women who experienced their first PL early in their reproductive lifespan. This finding may reflect the fact that PLs taking place at an older age are more likely a proxy of age-related changes (e.g. a higher rate of aneuploidy),6 rather than an early sign of underlying pathophysiology shared with future risk of CVD. Besides, in support of an interpretation of shared biological factors,12 we found that elevated CVD risk was mainly driven by the small number of women who experienced PL in two or more pregnancies and those who reported PL both in the first and subsequent pregnancies. Finally, we found that the elevated risk of CVD was particularly increased among women who experienced late PL, probably because women in the early PL group were more likely to have a clinically unrecognized PL,31 leading to non-differential exposure misclassification and thereafter weakened risk estimation. Besides, our previous evidence shows that late PL appeared to have stronger associations with type 2 diabetes and hypertension than early PL,17 indicating that later PL has a greater physiological impact on pregnant women.
PL may be aetiologically linked to CVD through shared mechanistic pathways that could result in poor placental function, eventually leading to PL and CVD. For instance, endothelial dysfunction is a well-documented early sign of atherosclerosis.32 Previous studies have shown that women with recurrent PL had more severe endothelial dysfunction than women without PL.33 Besides, autoimmune disorders (e.g. antiphospholipid syndrome and systemic lupus erythematosus) and chronic systemic inflammation that are commonly implicated in the occurrence of miscarriage are increasingly recognized to be risk factors for CVD.34 A genetic predisposition to CVD may also be involved in the observed associations, as manifested by the greater incidence of CHD in the parents of women who experienced recurrent miscarriage compared to the parents of women without miscarriage history.35 Similarly, a meta-analysis demonstrated a strong association between recurrent miscarriage and factor V Leiden and prothrombin gene mutations, which predispose carriers to thrombotic disease in later life.36
Strengths of this study include its large sample size, prospective design, extensive follow-up period with high follow-up rate, rigorous ascertainment of cardiovascular outcomes, and comprehensive collection of repeated data on health-related factors that allow us to control for various confounders and explore potential modification effects. Additionally, data on PL were collected periodically throughout follow-up, thus reducing recall bias and representing an improvement over previous studies that relied on recall at a single point in life. Finally, information on all pregnancies from each woman enabled us to compare the risk of CVD according to the number of PL, age at first PL, early and late PL, and change in PL status across multiple pregnancies. Our study also has several limitations. First, exposure misclassification cannot be fully ruled out, even though self-reported PL has been found to be reliably reported in previous studies.19 , 20 Yet, given our prospective design, measurement error would be non-differential with respect to CVD ascertainment and thus likely to bias effect estimation towards the null. Second, limited early-life characteristics and pre-pregnancy factors were collected in this cohort limiting our ability to fully adjust for shared risk factors. Third, our study participants were all health professionals and predominantly non-Hispanic White women whose obesity prevalence is much lower than that of minority women,37 possibly limiting the generalizability of our findings. Finally, we may have underestimated the risk of CVD associated with PL, given the relatively low incidence of CVD among young and middle-aged adults.38
In conclusion, results from this large prospective cohort showed that PL was associated with a greater risk of CVD, including both CHD and stroke, among young and middle-aged women. Our findings emphasize the importance of considering a woman’s reproductive history when evaluating her CVD risk. However, future studies should further assess the mechanisms underlying this relationship to aid efforts to prevent CVD in women.
Supplementary material
Supplementary material is available at European Heart Journal online.
Acknowledgements
We would like to thank the participants and staff of the NHSII for their valuable contributions as well as the following state cancer registries for their help: AL, AZ, AR, CA, CO, CT, DE, FL, GA, ID, IL, IN, IA, KY, LA, ME, MD, MA, MI, NE, NH, NJ, NY, NC, ND, OH, OK, OR, PA, RI, SC, TN, TX, VA, WA, WY. The authors assume full responsibility for analyses and interpretation of these data.
Funding
This study was supported by grants from the National Institutes of Health [grant number U01-HL145386, U01-CA176726, R01-HL034594, and R01-HL088521].
Conflict of interest: none declared.
Data availability
The data that support the findings of this study will not be made publicly available. Further information, including the procedures for obtaining and accessing data from the Nurses’ Health Studies II, is described at www.nurseshealthstudy.org/researchers (email: [email protected]).
References

