


Abstract
The aim of this study was to compare long-term all-cause mortality between patients receiving percutaneous coronary intervention (PCI) and coronary artery bypass grafting (CABG) using multiple (MAG) or single arterial grafting (SAG).
The current study is a post hoc analysis of the SYNTAX Extended Survival Study, which compared PCI with CABG in patients with three-vessel (3VD) and/or left main coronary artery disease (LMCAD) and evaluated survival with ≥10 years of follow-up. The primary endpoint was all-cause mortality at maximum follow-up (median 11.9 years) assessed in the as-treated population. Of the 1743 patients, 901 (51.7%) underwent PCI, 532 (30.5%) received SAG, and 310 (17.8%) had MAG. At maximum follow-up, all-cause death occurred in 305 (33.9%), 175 (32.9%), and 70 (22.6%) patients in the PCI, SAG, and MAG groups, respectively (P < 0.001). Multiple arterial grafting [adjusted hazard ratio (HR) 0.66, 95% confidence interval (CI) 0.49–0.89], but not SAG (adjusted HR 0.83, 95% CI 0.67–1.03), was associated with significantly lower all-cause mortality compared with PCI. In patients with 3VD, both MAG (adjusted HR 0.55, 95% CI 0.37–0.81) and SAG (adjusted HR 0.68, 95% CI 0.50–0.91) were associated with significantly lower mortality than PCI, whereas in LMCAD patients, no significant differences between PCI and MAG (adjusted HR 0.90, 95% CI 0.56–1.46) or SAG (adjusted HR 1.11, 95% CI 0.81–1.53) were observed. In patients with revascularization of all three major myocardial territories, a positive correlation was observed between the number of myocardial territories receiving arterial grafts and survival (P trend = 0.003).
Our findings suggest that MAG might be the more desirable configuration for CABG to achieve lower long-term all-cause mortality than PCI in patients with 3VD and/or LMCAD.
Registered on clinicaltrial.gov. SYNTAXES: NCT03417050 (https://clinicaltrials.gov/ct2/show/NCT03417050); SYNTAX: NCT00114972 (https://www.clinicaltrials.gov/ct2/show/NCT00114972).
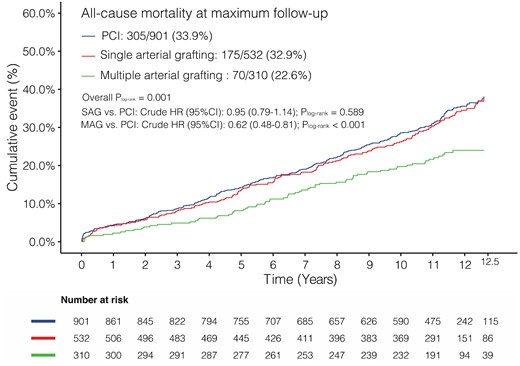
Kaplan–Meier curves showing all-cause mortality at maximum follow-up. HR, hazard ratio; MAG, multiple arterial grafting; PCI, percutaneous coronary intervention; SAG, single arterial grafting.
See the editorial comment for this article ‘The optimal strategy for multivessel coronary revascularization’, by Joanna Chikwe and Ottavio R. Alfieri, https://doi.org/10.1093/eurheartj/ehab768.
Introduction
The optimal strategy for coronary revascularization in patients with three-vessel (3VD) and/or left main coronary artery disease (LMCAD) is vigorously debated by clinicians and medical societies.1 Randomized controlled trials and large observational studies focusing on 3VD have uniformly demonstrated that coronary artery bypass grafting (CABG) is associated with significantly lower mortality than percutaneous coronary intervention (PCI).2 , 3 As for LMCAD, this debate has intensified following the 5-year results of the EXCEL and NOBLE trials.1 , 4–6 The Synergy between PCI with Taxus and Cardiac Surgery Extended Survival (SYNTAXES) trial7 is the extended 10-year follow-up of the SYNTAX trial,8 which is the first randomized trial to assess the ≥10-year survival of patients with de novo 3VD and/or LMCAD after PCI with drug-eluting stents (DES) vs. CABG. Overall, the study showed that all-cause mortality rates were similar between the CABG and PCI groups; however, CABG did significantly improve survival in patients with 3VD.8
In the SYNTAX study, as with previous trials comparing CABG with PCI, CABG was usually performed using a ‘conventional’ surgical strategy involving a left internal thoracic artery (LITA) graft to the left anterior descending artery (LAD) with additional vein grafts to the other vessels. A second internal thoracic artery (ITA) was used in only 24.4%, 28.8%, and 7.9% of patients in the SYNTAX,7 EXCEL,6 and NOBLE5 trials, respectively, with multiple arterial grafting (MAG) adopted in 36.8% of CABG operations in the SYNTAX trial. In contrast, 99.8%, 98.8%, and 96.4% of the patients in these studies received an arterial conduit to the LAD.
Several studies have suggested that CABG performed with MAG is associated with superior clinical outcomes than using a single arterial graft and veins (SAG).9–12 Venous conduit failure is known to accelerate 4–5 years after surgery;13 thus, any potential clinical benefit of CABG using MAG over other revascularization strategies would become more evident over a longer follow-up period. However, it is still unknown whether the long-term survival benefit of CABG over PCI is mainly attributable to MAG or whether CABG with SAG is a reasonable strategy in comparison to PCI.
The aim of the current analysis is to compare long-term all-cause mortality between patients who received MAG or SAG with PCI and to determine whether incremental use of arterial grafts in CABG has a positive impact on mortality, based on the long-term follow-up data of the SYNTAXES trial.
Methods
Study design and participants
The present study is a post hoc analysis of the SYNTAXES study (NCT03417050), which was an investigator-driven extended follow-up (≥10 years) of the SYNTAX trial (NCT00114972) beyond its originally planned final follow-up at 5 years.8 , 14 The main results of the SYNTAXES study have been recently reported.7 In brief, the SYNTAX trial was a multicentre, randomized controlled trial conducted among 85 hospitals across 18 North American and European countries with minimum exclusion criteria. From March 2005 to April 2007, a total of 1800 patients with de novo 3VD and/or LMCAD, who were eligible for both PCI and CABG based on clinical judgement and the consensus of a Heart Team, were enrolled and allocated in a 1:1 fashion either to receive PCI (n = 903) with the default use of TAXUS Express paclitaxel-eluting stents (Boston Scientific Corporation, Marlborough, MA, USA) or CABG (n = 897). A total of 1766 patients were treated either by PCI or CABG (as-treated dataset). Patients treated with venous grafts only (n = 22) or with synthetic material (n = 1) were excluded; therefore, a total of 1743 patients were included in the current analyses, of whom 901 (51.7%) patients actually received PCI and 842 (48.3%) patients formed the CABG cohort. The latter consisted of 532 (30.5%) patients receiving SAG (1 arterial and ≥1 venous graft) and 310 (17.8%) receiving MAG (≥2 arterial with or without additional venous grafts).
The SYNTAX and SYNTAXES trials were approved by the ethics committees at each investigating centre, and all patients provided their written informed consent prior to participation in the SYNTAX trial. Follow-up was performed in accordance with local law and regulations of each participating institution and complied with the Declaration of Helsinki.
Study endpoint
All analyses were performed in the as-treated population. The primary endpoint of the current analyses was all-cause mortality at maximum follow-up. The median duration of maximum follow-up was 11.9 years [interquartile range (IQR) 11.2–12.4] in survivors. Vital status was available in 94.0% (1638/1743) of all patients. In the SYNTAX trial, randomization was stratified at each site according to the presence or absence of LMCAD and medically treated diabetes mellitus (DM). Therefore, subgroup analyses of LMCAD vs. 3VD and DM vs. non-DM were performed, as were subgroups stratified according to SYNTAX score tertile (low to intermediate <33 vs. high ≥33). Bypass surgery aimed at achieving complete revascularization, defined as revascularization of all vessels with a diameter of ≥1.5 mm and a stenosis of ≥50% quantified by coronary angiography. The choice and configuration of bypass grafts and the surgical technique utilized were left to the discretion of the individual cardiac surgeon. An exploratory analysis was also performed to identify the impact of incremental use of arterial grafts to 1, 2, or 3 major myocardial territories (LAD, circumflex, and right coronary artery territories), with patients who underwent PCI considered to have zero arterial grafts. Only those patients who had all three major myocardial territories revascularized either with bypass grafts or stents were included in this analysis.
Statistical analysis
Details of missing data of baseline characteristics are shown in Supplementary material online, Table S1. Continuous variables with normal distribution are expressed as mean ± standard deviation and compared by independent samples t-test or described as median (IQR) and compared by the Wilcoxon rank-sum test if non-normally distributed. Categorical variables are presented as counts and percentages and are compared by χ 2 tests or Fisher’s exact test when appropriate. The cumulative incidence of all-cause mortality was estimated by the Kaplan–Meier method. The Kaplan–Meier survival plots were truncated at 12.5 years when only 15% of patients were at risk to avoid visual misinterpretation;15 all events, however, are retained in the analysis when calculating hazard ratios (HRs) with 95% confidence intervals (CIs).
To adjust for potential confounding factors, the Cox proportional hazards model was weighted to inverse probability treatment weighting. Inverse probability treatment weightings were calculated using the R package twang,16 by including the variables representing demographic characteristics (age, sex, body mass index), clinical presentation (silent ischaemia, stable angina, or unstable angina), coexisting medical conditions (DM, hypertension, dyslipidaemia, current smoker, previous myocardial infarction, prior cerebrovascular disease, stroke, transient ischaemic attack, carotid artery disease, peripheral vascular disease, chronic obstructive pulmonary disease, congestive heart failure, renal failure), left ventricular ejection fraction (LVEF), EuroSCORE, disease type, anatomical SYNTAX score, any bifurcation, and any total occlusion. Inverse probability treatment weighting values ranged from 1.04 to 13.12 (Supplementary material online, Figure S1). No case was considered to have an extreme score according to previous literature.17
To investigate the robustness of the results, sensitivity analyses with two methods, multivariate Cox regression and 1:1 propensity score matching, were performed. Details and results of the sensitivity analyses are provided in the Supplementary material online.
Considering the post hoc and exploratory nature of the analyses, there was no formal correction for multiple testing.18 Analyses were performed using R-project (R Foundation, Vienna, Austria). A two-sided P-value of <0.05 was considered as statistically significant.
Results
Baseline and procedural characteristics
Baseline characteristics are shown in Table 1. Compared with PCI, MAG patients were younger and had a higher LVEF and lower median EuroSCORE; whereas SAG patients had a significantly lower LVEF, higher median EuroSCORE, and higher proportion of congestive heart failure. No differences were observed in the type of coronary artery disease between the CABG and PCI groups; nevertheless, the mean number of lesions in the MAG group was significantly higher than in the PCI group.
Baseline characteristics
| PCI (n = 901) | SAG (n = 532) | P vs. PCI | MAG (n = 310) | P vs. PCI | |
|---|---|---|---|---|---|
| Age (years) | 65.3 (9.6) | 66.3 (9.4) | 0.067 | 62.4 (9.9) | <0.001 |
| Male sex | 689 (76.5) | 409 (76.9) | 0.911 | 264 (85.2) | 0.002 |
| Body mass index (kg/m2) | 28.1 (4.8) | 27.9 (4.9) | 0.451 | 27.7 (4.0) | 0.155 |
| Diabetes | 232 (25.7) | 123 (23.1) | 0.294 | 72 (23.2) | 0.419 |
| On insulin | 90 (10.0) | 56 (10.5) | 0.815 | 26 (8.4) | 0.475 |
| Hypertension | 625 (69.4) | 342 (64.3) | 0.054 | 196 (63.2) | 0.054 |
| Dyslipidaemia | 701 (78.3) | 402 (76.4) | 0.445 | 242 (78.6) | 0.991 |
| Current smokers | 165 (18.3) | 113 (21.4) | 0.181 | 75 (24.4) | 0.027 |
| Previous MI | 285 (32.0) | 190 (36.1) | 0.131 | 89 (29.2) | 0.400 |
| Previous cerebrovascular disease | 120 (13.4) | 72 (13.7) | 0.937 | 52 (16.8) | 0.165 |
| Previous stroke | 36 (4.0) | 23 (4.3) | 0.869 | 17 (5.5) | 0.355 |
| Previous TIA | 39 (4.3) | 26 (4.9) | 0.695 | 15 (4.8) | 0.838 |
| Previous carotid artery disease | 73 (8.1) | 39 (7.3) | 0.672 | 31 (10.0) | 0.362 |
| Peripheral vascular disease | 81 (9.0) | 59 (11.1) | 0.230 | 30 (9.7) | 0.804 |
| Chronic obstructive pulmonary disease | 73 (8.1) | 54 (10.2) | 0.222 | 21 (6.8) | 0.528 |
| Creatinine clearance (mL/min) | 86.7 (35.6) | 83.2 (28.8) | 0.065 | 89.2 (30.1) | 0.302 |
| LVEF (%) | 59.1 (12.9) | 56.2 (13.1) | 0.002 | 61.4 (12.8) | 0.021 |
| Congestive heart failure | 35 (3.9) | 34 (6.5) | 0.039 | 8 (2.6) | 0.391 |
| Clinical presentation | 0.327 | 0.123 | |||
| Silent ischaemia | 124 (13.8) | 63 (11.8) | 56 (18.1) | ||
| Stable angina | 514 (57.0) | 324 (60.9) | 160 (51.6) | ||
| Unstable angina | 263 (29.2) | 145 (27.3) | 94 (30.3) | ||
| EuroSCORE | 4.00 (2.00–5.00) | 4.00 (2.00–6.00) | 0.048 | 3.00 (1.00–5.00) | 0.001 |
| Parsonnet score | 6.00 (3.00–12.00) | 7.00 (3.00–14.00) | 0.090 | 6.00 (3.00–9.00) | <0.001 |
| Disease type | 0.608 | 0.601 | |||
| LMCAD only | 43 (4.8) | 28 (5.3) | 14 (4.5) | ||
| LMCAD + 1VD | 67 (7.4) | 47 (8.9) | 21 (6.8) | ||
| LMCAD + 2VD | 110 (12.2) | 77 (14.5) | 28 (9.0) | ||
| LMCAD + 3VD | 132 (14.7) | 75 (14.1) | 42 (13.5) | ||
| 3VD | 532 (59.0) | 292 (55.0) | 200 (64.5) | ||
| Number of lesions | 4.3 (1.8) | 4.3 (1.8) | 0.539 | 4.6 (1.8) | 0.029 |
| SYNTAX score | 28.5 (11.4) | 28.9 (11.3) | 0.447 | 29.8 (11.3) | 0.084 |
| SYNTAX score tercile | 0.447 | 0.225 | |||
| Low (0–22) | 297 (33.1) | 169 (32.0) | 86 (27.8) | ||
| Intermediate (23–32) | 308 (34.3) | 170 (32.2) | 113 (36.6) | ||
| High (>33) | 292 (32.6) | 189 (35.8) | 110 (35.6) | ||
| Any total occlusion | 216 (24.1) | 117 (22.2) | 0.432 | 70 (22.7) | 0.653 |
| Any bifurcation | 647 (72.3) | 397 (75.2) | 0.257 | 221 (71.5) | 0.852 |
Data are n (%), mean (standard deviation), or median (interquartile range).
1, 2, 3VD, one-, two-, three-vessel disease; CABG, coronary artery bypass grafting; LMCAD, left main coronary artery disease; LVEF, left ventricular ejection fraction; MAG, multiple arterial grafting; MI, myocardial infarction; PCI, percutaneous coronary intervention; SAG, single arterial grafting; TIA, transient ischaemic attack.
The main procedural characteristics for PCI and CABG patients are presented in Table 2. Saphenous vein grafts were used in 98.3% and 46.1% of those patients with SAG and MAG, respectively. Patients who underwent PCI had a significantly lower rate of complete revascularization than those who underwent CABG with SAG or MAG. The baseline and procedural characteristics between SAG and MAG are presented in Supplementary material online, Tables S7 and S8. The medication status up to 5 years, compared based on the type of revascularization (PCI, SAG, or MAG), is shown in Supplementary material online, Table S9, and subgroup analyses according to the type of revascularization (PCI vs. SAG and PCI vs. MAG) and medication status are shown in Supplementary material online, Table S10.
Procedural characteristics
| PCI (n = 901) | SAG (n = 532) | P vs. PCI | MAG (n = 310) | P vs. PCI | |
|---|---|---|---|---|---|
| Number of stents | 4.0 (3.0–6.0) | — | — | — | — |
| Total stent length per patient | 80.0 (52.0–112.0) | — | — | — | — |
| Number of conduits | — | 2.8 (0.7) | — | 2.8 (0.7) | — |
| Grafts used | |||||
| LIMA | — | 530 (99.6) | — | 305 (98.4) | — |
| RIMA | — | 2 (0.4) | — | 226 (72.9) | — |
| LIMA or RIMA | — | 532 (100.0) | — | 310 (100.0) | — |
| BIMA (both LIMA and RIMA) | — | 0 (0.0) | — | 221 (71.3) | — |
| Radial artery | — | 0 (0.0) | — | 118 (38.1) | — |
| Venous | — | 523 (98.3) | — | 143 (46.1) | — |
| LIMA to LAD | — | 530 (99.6) | — | 310 (100.0) | — |
| Off-pump CABG | — | 68 (12.8) | — | 61 (19.7) | — |
| Complete revascularization | 502 (55.7) | 351 (66.0) | <0.001 | 192 (61.9) | 0.065 |
Data are n (%), mean (standard deviation), or median (interquartile range).
BIMA, bilateral internal mammary artery; CABG, coronary artery bypass grafting; LAD, left anterior descending artery; LIMA, left internal mammary artery; MAG, multiple arterial grafting; PCI, percutaneous coronary intervention; RIMA, right internal mammary artery; SAG, single arterial grafting.
Clinical outcomes
At the maximum follow-up (median 11.9 years), all-cause death occurred in 305 (33.9%) of 901 patients having PCI, 175 (32.9%) of 532 patients having SAG, and 70 (22.6%) of 310 patients having MAG (adjusted P log-rank < 0.001, Table 3 and Graphical Abstract). Compared with PCI, the risk of all-cause death was similar in patients who received SAG (adjusted HR 0.83, 95% CI 0.67–1.03; P = 0.088), whereas it was significantly lower in those receiving MAG (adjusted HR 0.66, 95% CI 0.49–0.89; P = 0.007) (Table 3). In addition, we used 1:1 propensity score matching to compare the PCI vs. SAG or MAG in a balanced risk profile (i.e. with balanced age; Supplementary material online, Methods and Figure S4), and the results were consistent with our primary findings.
Association between the percutaneous coronary intervention, single arterial grafting, and multiple arterial grafting and all-cause mortality at maximum follow-up
| All-cause mortality at maximum follow-up | PCI | SAG | MAG | P log-rank | ||||||||
|---|---|---|---|---|---|---|---|---|---|---|---|---|
| n/N (%) | HR (95% CI) | n/N (%) | HR (95% CI) | P vs. PCI | P interaction | n/N (%) | HR (95% CI) | P vs. PCI | P interaction | |||
| Overall | Crude | 305/901 (33.9) | 1.00 (Ref) | 175/532 (32.9) | 0.95 (0.79–1.14) | 0.589 | — | 70/310 (22.6) | 0.62 (0.48–0.81) | <0.001 | — | 0.001 |
| Adjusted | 1.00 (Ref) | 0.83 (0.67–1.03) | 0.088 | — | 0.66 (0.49—0.89) | 0.007 | — | <0.001 | ||||
| LMCAD | Crude | 116/352 (33.0) | 1.00 (Ref) | 82/227 (36.1) | 1.15 (0.86–1.52) | 0.347 | 0.087 | 29/105 (27.6) | 0.82 (0.54–1.22) | 0.325 | 0.116 | 0.262 |
| Adjusted | 1.00 (Ref) | 1.11 (0.81–1.53) | 0.508 | 0.025 | 0.90 (0.56–1.46) | 0.674 | 0.117 | 0.259 | ||||
| 3VD | Crude | 189/549 (34.4) | 1.00 (Ref) | 93/305 (30.5) | 0.83 (0.64–1.06) | 0.131 | — | 41/205 (20.0) | 0.53 (0.38–0.74) | <0.001 | — | <0.001 |
| Adjusted | 1.00 (Ref) | 0.68 (0.50–0.91) | 0.009 | — | 0.55 (0.37–0.81) | 0.002 | — | <0.001 | ||||
| DM | Crude | 95/232 (40.9) | 1.00 (Ref) | 55/123 (44.7) | 1.08 (0.78–1.51) | 0.645 | 0.408 | 26/72 (36.1) | 0.84 (0.55–1.30) | 0.445 | 0.127 | 0.574 |
| Adjusted | 1.00 (Ref) | 1.00 (0.68–1.48) | 0.982 | 0.251 | 0.79 (0.48–1.31) | 0.367 | 0.429 | 0.200 | ||||
| Non-DM | Crude | 210/669 (31.4) | 1.00 (Ref) | 120/409 (29.3) | 0.92 (0.73–1.15) | 0.446 | — | 44/238 (18.5) | 0.55 (0.40–0.76) | <0.001 | — | 0.001 |
| Adjusted | 1.00 (Ref) | 0.77 (0.59–1.00) | 0.048 | — | 0.61 (0.42–0.90) | 0.012 | — | <0.001 | ||||
| SYNTAX score <33 | Crude | 187/605 (30.9) | 1.00 (Ref) | 108/339 (31.9) | 1.03 (0.81–1.30) | 0.835 | 0.180 | 47/199 (23.6) | 0.74 (0.54–1.02) | 0.066 | 0.087 | 0.121 |
| Adjusted | 1.00 (Ref) | 0.90 (0.69–1.18) | 0.442 | 0.273 | 0.76 (0.53–1.09) | 0.130 | 0.212 | 0.016 | ||||
| SYNTAX score ≥33 | Crude | 115/292 (39.4) | 1.00 (Ref) | 64/189 (33.9) | 0.80 (0.59–1.08) | 0.146 | — | 23/110 (20.9) | 0.46 (0.29–0.72) | 0.001 | — | 0.001 |
| Adjusted | 1.00 (Ref) | 0.71 (0.49–1.01) | 0.057 | — | 0.50 (0.29–0.86) | 0.012 | — | <0.001 | ||||
Adjusted to inverse probability treatment weighting.
3VD, three-vessel disease; CI, confidence interval; DM, diabetes mellitus; HR, hazard ratio; LMCAD, left main coronary artery disease; MAG, multiple arterial grafting; PCI, percutaneous coronary intervention; SAG, single arterial grafting.
A treatment (SAG vs. PCI)-by-subgroup interaction according to the presence or absence of LMCAD was identified (adjusted P interaction = 0.025, Table 3). In patients with LMCAD, no difference in all-cause mortality was observed between PCI and CABG with SAG or MAG; however, in the 3VD subgroup, compared to PCI, all-cause death was significantly lower in patients who underwent CABG with SAG (adjusted HR 0.68, 95% CI 0.50–0.91; P = 0.009) or MAG (adjusted HR 0.55, 95% CI 0.37–0.81; P = 0.002).
No treatment-by-subgroup interaction according to DM status or SYNTAX score tertile (Table 3) was identified. In the non-DM population, both SAG (adjusted HR 0.77, 95% CI 0.59–1.00; P = 0.048) and MAG (adjusted HR 0.61, 95% CI 0.42–0.90; P = 0.012) had a lower risk of mortality than PCI; whereas in the DM population, there were no significant differences in the risk of all-cause mortality for PCI compared to SAG (adjusted HR 1.00, 95% CI 0.68–1.48; P = 0.982) or MAG (adjusted HR 0.79, 95% CI 0.48–1.31; P = 0.367). In the high SYNTAX score tertile (score ≥33) population, SAG (adjusted HR 0.71, 95% CI 0.49–1.01; P = 0.057) and MAG (adjusted HR 0.50, 95% CI 0.29–0.86; P = 0.012) were associated with a significantly lower risk of all-cause mortality as compared to PCI; however, in the low-intermediate SYNTAX score tertile (score <33) population, the risk of all-cause mortality was similar between SAG (adjusted HR 0.90, 95% CI 0.69–1.18; P = 0.442) or MAG (adjusted HR 0.76, 95% CI 0.53–1.09; P = 0.130) vs. PCI (Figure 1). The results of the additional subgroup analyses are shown in Supplementary material online, Table S3.

Kaplan–Meier curves showing all-cause mortality according to subgroups: (A) left main coronary artery disease; (B) three-vessel disease; (C) diabetes mellitus; (D) non-diabetes mellitus; (E) SYNTAX score <33; and (F) SYNTAX score ≥33. 3VD, three-vessel disease; DM, diabetes mellitus; LM, left main; MAG, multiple arterial grafting; PCI, percutaneous coronary intervention; SAG, single arterial grafting.
All-cause mortality for patients who actually received bypass grafts or stents to all three major myocardial territories is shown in Figure 2 and Table 4. Patients in whom ≥2 myocardial territories were revascularized with arterial grafts during CABG had significantly lower rates of late all-cause mortality as compared to patients who underwent PCI, whereas no difference was observed between patients undergoing CABG with arterial grafting to one, and venous grafting to two myocardial territories vs. PCI. A reduction in the rate of all-cause mortality was identified with an incremental use of arterial grafts for revascularization of the three major myocardial territories [34.2%, 31.3%, 23.1%, and 21.9%, for PCI, one, two, and three myocardial territories revascularized with arterial grafts, respectively; adjusted P trend = 0.003 (tests for trend are based on modelling the ordered myocardial territories treated by arterial graft categories as a 1 df linear term)]. The results of additional subgroup analyses in this population are shown in Supplementary material online, Table S5 and Figure S3.
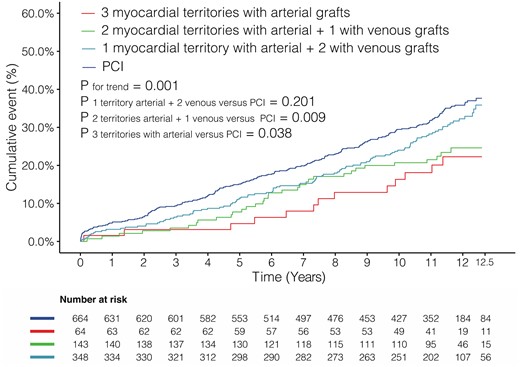
Kaplan–Meier curves showing all-cause mortality in patients with grafts anastomosed to or stents implanted in all three myocardial territories. PCI, percutaneous coronary intervention.
All-cause mortality in patients with grafts anastomosed to or stents implanted in all three myocardial territories
| PCI | 1 myocardial territory with arterial graft + 2 with venous | 2 myocardial territories with arterial graft + 1 with venous | 3 myocardial territories with arterial graft | P trend | |||||||||
|---|---|---|---|---|---|---|---|---|---|---|---|---|---|
| n/N (%) | HR (95% CI) | n/N (%) | HR (95% CI) | P-value | n/N (%) | HR (95% CI) | P-value | n/N (%) | HR (95% CI) | P-value | |||
| Overall | Crude | 227/664 (34.2) | 1.00 (Ref) | 109/348 (31.3) | 0.86 (0.69–1.08) | 0.201 | 33/143 (23.1) | 0.61 (0.43–0.89) | 0.009 | 14/64 (21.9) | 0.56 (0.33–0.97) | 0.038 | 0.001 |
| Adjusted | 1.00 (Ref) | 0.84 (0.67–1.06) | 0.146 | 0.65 (0.45–0.94) | 0.021 | 0.58 (0.34–1.00) | 0.049 | 0.003 | |||||
CI, confidence interval; HR, hazard ratio; PCI, percutaneous coronary intervention.
Discussion
The main findings of the current analysis can be summarized as follows. First, in patients with 3VD and/or LMCAD, CABG using MAG, but not SAG, is associated with lower all-cause mortality compared with PCI after a median follow-up of 12 years. Second, in patients with bypass grafts anastomosed to or stents implanted in all three major myocardial territories, there was a positive correlation between the number of myocardial territories revascularized with arterial grafts and survival (PCI being considered as no arterial graft). Third, based on the absolute difference in mortality in the LMCAD population, compared to PCI, CABG with MAG was associated with lower mortality and SAG with higher mortality, though neither reached statistical significance. In the 3VD population, both MAG and SAG were associated with significantly lower all-cause mortality than PCI. Fourth, diabetic patients who underwent CABG with MAG had numerically lower mortality and those who received SAG had numerically higher mortality than those who underwent PCI. In the non-DM population, both MAG and SAG were associated with significantly lower all-cause mortality than PCI.
Recently, there has been heated debate over the recommendation of PCI or CABG for patients with LMCAD,1 , 4–6 whereas for patients with 3VD, CABG has shown consistently superior outcomes over PCI.2 , 3 However, outcomes following CABG may vary according to the type of grafts used, and current evidence that directly compares long-term outcomes of PCI vs. CABG with MAG or SAG is limited and conflicting. A single-centre retrospective study19 reported no difference in survival between MAG and PCI with DES over an 8-year follow-up in patients undergoing revascularization for multivessel disease. Contrarily, another single-centre retrospective study,20 which enrolled patients with 3VD, showed that SAG had a similar risk of mortality compared to PCI with DES at 9 years after the procedure, whereas MAG had a significantly lower risk. Similarly, a propensity score-adjusted analysis reported improved survival at a mean follow-up of 4.9 years in 1372 patients undergoing CABG with MAG compared to 1222 patients undergoing PCI for ≥2VD.21 In concordance with the findings of the latter two studies, we showed that in patients with 3VD and/or LMCAD, CABG with the use of MAG was associated with significantly lower mortality than PCI at a median follow-up of 12 years; however, mortality between SAG and PCI was similar.
To have a better understanding of the outcome between PCI, SAG, MAG, and total arterial CABG, we performed an exploratory analysis to determine the impact of incremental use of arterial grafts for revascularization in patients who had actually received bypass grafts or stents in all three major myocardial territories. We identified a significant positive correlation between the number of myocardial territories grafted with arterial conduits and long-term survival (assuming PCI patients to have received no arterial grafts). Our finding is consistent with the results of a network meta-analysis of 25 studies, which showed by meta-regression that there was a positive, albeit non-significant, correlation between the number of arterial grafts and lower mortality.10 Such findings might be explained by the fact that disease progression in native coronary vessels with a patent LITA and radial artery is significantly lower than in those with vein grafts 10 years after CABG (8%, 11%, and 40%, respectively; P < 0.0001).22 The protective effect of arterial grafts from progressive atherosclerosis in the downstream coronary circulation, particularly the ITAs, is most likely due to the active endothelium of arterial grafts that produce vasoactive (such as nitric oxide) and endothelial progenitor substances, which are anti-inflammatory/antithrombotic vascular mediators.23 In addition, the smooth muscle layer predominantly seen in the wall of the radial artery helps the graft match the coronary flow in the native vessels by adjusting its luminal diameter, thereby creating less turbulence at the distal anastomosis.24 Our findings advocate the use of as many arterial grafts as possible during CABG surgery.
It has become seemingly clear from the previous results of the SYNTAX trial7 , 17 that CABG is the optimal choice of revascularization strategy in patients with 3VD. Our study demonstrated that the significant long-term survival benefit observed with CABG was maintained irrespective of SAG or MAG strategy. However, the survival advantage over PCI appeared to be greater with MAG than SAG, which is evident from the respective 45% and 32% reduction in late mortality.
In contrast, the appropriate method of revascularization in patients with LMCAD with a low to intermediate SYNTAX score continues to be controversial. The majority of randomized controlled trials and meta-analyses have failed to demonstrate differences in late mortality between PCI and CABG.5 , 6 , 25–27 In the EXCEL study, CABG was associated with a 38% reduction in all-cause mortality in comparison to PCI at 5 years, though it was chiefly driven by non-cardiovascular deaths and was considered to be an underpowered secondary endpoint by the authors.6 Contrary to the above-mentioned results derived through standard frequentist analyses, Bayesian analyses of the EXCEL trial results suggested that PCI was associated with inferior long-term results for all events, including mortality, compared with CABG for patients with LMCAD.28 Nevertheless, there is a lack of data comparing PCI with the various conduit types used in CABG. Our subgroup analysis evaluating the differences in late mortality in patients with LMCAD based on the grafting strategy (MAG or SAG) used in patients undergoing CABG and PCI is most likely the first of its kind. It revealed that long-term mortality rates between MAG, SAG, and PCI were not significantly different, although numerically lowest in MAG patients.
One possible explanation for our findings is that in patients with isolated LMCAD, the attrition of venous grafts may have less impact on survival since the lateral wall vessels may continue to be perfused in retrograde fashion by the graft to the LAD, which is most often an ITA. In contrast, patients with isolated LMCAD undergoing CABG with MAG may be susceptible to accelerated graft failure due to competitive flow between the grafts to the LAD and lateral wall or between grafts and native vessels.29 However, we believe that the lack of between-group difference in mortality could also be due to the limited power of the subgroup analyses and is a Type II error. Considering the superiority of MAG over PCI in patients with high SYNTAX scores (≥33) demonstrated in this study, we do recommend the use of MAG at least in patients with severe LMCAD. Among patients with less complex LMCAD, a customized approach could be used by the heart team in selecting the appropriate revascularization strategy.
The FREEDOM Follow-On study,2 in which participants from the original FREEDOM study were followed up to 7.5 years, showed that CABG was associated with significantly lower all-cause mortality in DM patients with multivessel coronary disease. However, the main results of the SYNTAXES study demonstrated no difference in survival between PCI and CABG in patients with diabetes at 10 years. Commensurate with the SYNTAXES main finding, the current analyses revealed that all-cause mortality in the DM population is similar between CABG with MAG or SAG and PCI. Nevertheless, the trajectory of the Kaplan–Meier curves in the DM population showed an interesting trend with the divergence between CABG with MAG or SAG and PCI up to 6 years, followed by convergence from 6 to 9 years. Thereafter, MAG diverges from PCI again, whereas SAG crosses over the PCI curve, which is also evident from the numerically lower mortality observed in patients undergoing MAG and the higher mortality in patients who received SAG, compared to PCI.
The selection of grafts in daily practice is not only based on clinical outcomes published in the literature but also based on a multitude of other factors such as quality of grafts in individual patients, patient characteristics not commonly addressed in studies such as frailty, presence of sternal disease, physical disabilities, etc., operating room time which may be linked to reimbursement, and most importantly the skill, experience and comfort level of the surgeon in using various grafts. Multiple arterial grafting might not always be possible in clinical practice in spite of the compelling survival benefits associated with it. Similarly, the complexity of PCI and the availability of on-site cardiac surgical back-up play an important role in decision-making. Therefore, despite all the available evidence, individualized management of every patient through a heart team approach is of utmost importance.
Limitations
The following limitations have to be considered in the present analysis. First, although the SYNTAXES trial is one of the largest trials comparing late mortality between PCI and CABG in 3VD and/or LMCAD patients, it was not adequately powered to deliver reliable evidence for subgroup analyses.30 No formal correction for multiple testing for subgroup analyses was performed considering the post hoc and exploratory nature of the current analyses.18 Therefore, all reported results of subgroup analyses should be considered strictly exploratory and hypothesis-generating only. Second, the randomization in the SYNTAX trial was not stratified according to the type of conduits. Therefore, imbalances do exist among the three sub-categories assessed in the current study. Although various statistical methods were performed to try to estimate the true effects between groups, the inability to eliminate the impact of unmeasurable confounders produces bias that cannot be adjusted for. Third, the endpoint was all-cause mortality only, which has the potential to dilute the treatment effect due to the inclusion of events unrelated to surgical or PCIs, especially at very long-term follow-up. However, the use of all-cause mortality reduces the risk of adjudication bias due to incomplete, skewed, or inadequate supporting evidence. Previous data have supported the use of all-cause mortality over cardiovascular mortality as the endpoint for myocardial revascularization trials.31 Fourth, the SYNTAX trial was conducted between 2005 and 2007, with a predominant use of first-generation paclitaxel-eluting stents for treatment with PCI, which may limit the generalizability of our findings to current practices. However, it is unavoidable that the findings derived from long-term follow-up data are based on partially outdated technology, while the evidence for contemporary technology can only stem from short-term follow-up studies. Nevertheless, a patient-level meta-analysis32 has shown that no statistically significant subgroup interaction was noted across studies (PCI vs. CABG) based on the generation of DES used for PCI (P for interaction = 0.25).
Conclusion
The current study showed that among patients with de novo 3VD and/or LMCAD, MAG, but not SAG, is associated with lower all-cause mortality compared with PCI.
In the subgroup of 3VD, although both MAG and SAG were associated with significantly lower all-cause mortality than PCI, the risk reduction was greater in patients who received MAG and may be the most desirable strategy for revascularization in such patients. However, no difference in mortality was observed between PCI and CABG with MAG or SAG in patients with LMCAD; therefore, PCI might be a reasonable alternative to CABG, irrespective of the type of conduit in this patient population. In the non-DM population, both MAG and SAG were associated with significantly lower all-cause mortality than PCI; however, in diabetic patients, late mortality was similar between PCI and CABG regardless of the type of grafting strategy used. Due to the post hoc and exploratory nature of the analysis, our results need to be interpreted with caution and should be considered as hypothesis generating only.
Supplementary material
Supplementary material is available at European Heart Journal online.
Funding
The SYNTAX Extended Survival study was supported by the German Foundation of Heart Research (Frankfurt am Main, Germany). The SYNTAX trial, during 0- to 5-year follow-up, was funded by Boston Scientific Corporation (Marlborough, MA, USA). Both sponsors had no role in the study design, data collection, data analyses, and interpretation of the study data, nor were involved in the decision to publish the final manuscript. The principal investigators and authors had complete scientific freedom. C.G. is supported by Science Foundation Ireland award (15/RP/2765).
Conflict of interest: P.W.S. reports personal consultancy fees from Biosensors, Medtronic, Micell, Sino Medical Sciences Technology, Philips/Volcano, Xeltis, and Heartflow. M.J.M. reports non-financial support from Edwards Lifesciences, non-financial support from Medtronic, and non-financial support from Abbott, outside the submitted work. M.C.-M. reports other from CERC and other from Electroducer, outside the submitted work. A.P.K. reports to work as employee of Medtronic, outside the submitted work. All other authors declared no conflict of interest.
Data availability
The data underlying this article cannot be shared publicly and the data could be shared on reasonable request to the corresponding author.
References
Author notes
Piroze M. Davierwala, Chao Gao, Daniel J.F.M. Thuijs contributed equally to the study.

