


Abstract
Mapping data of human ventricular fibrillation (VF) are limited. We performed detailed mapping of the activities underlying the onset of VF and targeted ablation in patients with structural cardiac abnormalities.
We evaluated 54 patients (50 ± 16 years) with VF in the setting of ischaemic (n = 15), hypertrophic (n = 8) or dilated cardiomyopathy (n = 12), or Brugada syndrome (n = 19). Ventricular fibrillation was mapped using body-surface mapping to identify driver (reentrant and focal) areas and invasive Purkinje mapping. Purkinje drivers were defined as Purkinje activities faster than the local ventricular rate. Structural substrate was delineated by electrogram criteria and by imaging. Catheter ablation was performed in 41 patients with recurrent VF. Sixty-one episodes of spontaneous (n = 10) or induced (n = 51) VF were mapped. Ventricular fibrillation was organized for the initial 5.0 ± 3.4 s, exhibiting large wavefronts with similar cycle lengths (CLs) across both ventricles (197 ± 23 vs. 196 ± 22 ms, P = 0.9). Most drivers (81%) originated from areas associated with the structural substrate. The Purkinje system was implicated as a trigger or driver in 43% of patients with cardiomyopathy. The transition to disorganized VF was associated with the acceleration of initial reentrant activities (CL shortening from 187 ± 17 to 175 ± 20 ms, P < 0.001), then spatial dissemination of drivers. Purkinje and substrate ablation resulted in the reduction of VF recurrences from a pre-procedural median of seven episodes [interquartile range (IQR) 4–16] to 0 episode (IQR 0–2) (P < 0.001) at 56 ± 30 months.
The onset of human VF is sustained by activities originating from Purkinje and structural substrate, before spreading throughout the ventricles to establish disorganized VF. Targeted ablation results in effective reduction of VF burden.
The initial phase of human ventricular fibrillation (VF) is critical as it involves the primary activities leading to sustained VF and arrhythmic sudden death. The origin of such activities is unknown.
Body-surface mapping shows that most drivers (≈80%) during the initial VF phase originate from electrophysiologically defined structural substrates. Repetitive Purkinje activities can be elicited by programmed stimulation and are implicated as drivers in 37% of cardiomyopathy patients.
The onset of human VF is mostly associated with activities from the Purkinje network and structural substrate, before spreading throughout the ventricles to establish sustained VF. Targeted ablation reduces or eliminates VF recurrence.
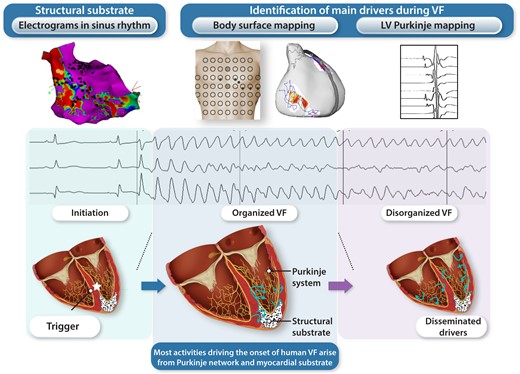
Ventricular fibrillation (VF) onset in humans—Purkinje and structural substrate govern the transition from trigger to disorganized VF. Schematic view of initial VF activities in patients with cardiac structural abnormalities. The upper panel shows an electrocardiogram of spontaneous VF onset in a patient with a prior history of myocardial infarction. The three illustrations show the sequence of trigger, initial organized VF, and disorganized VF. The trigger is shown as a red star close to the structural substrate (mottled white area). Initial VF activities are represented as localized waves generated from the ventricular or Purkinje substrate. Then the acceleration of activities in parallel with previously described changes (reduction in action potential duration, Ca handling…) leads to dissemination of activities and VF disorganization.
See the editorial comment for this article ‘Ventricular fibrillation: combined myocardial substrate and Purkinje ablation’, by Peter Taggart et al., https://doi.org/10.1093/eurheartj/ehab912.
Introduction
Ventricular fibrillation (VF) is a major cause of sudden cardiac death, most often associated with coronary artery disease and cardiomyopathies.1,2 Experimental studies have shown that VF can be associated with a spectrum of activation patterns ranging from stable three-dimensional rotors to multiple wavelets and foci, with dynamic changes linked to structural or functional alterations.3–9 However, there is a paucity of detailed studies on VF dynamics in patients with structural cardiac abnormalities as emphasized in prior reports.1,2 As early as 1930, Wiggers reported successive phases of VF with initial ‘organized ventricular contractions’ progressing to chaotic, and finally atonic, fibrillation. The onset of VF has been mapped in few experimental studies, which demonstrated recurring wavefront sequences arising from distinct regions.6,10,11 This initial phase is likely to be critical as it involves the primary reentries that initiate the process leading to sustained VF and may have clinical importance for therapeutic interventions.
In this study, we investigated the onset of VF using non-invasive mapping and multielectrode catheters to identify driver areas in relation to the underlying structural substrate. In addition, we evaluated the potential in guiding ablation with the results assessed over a long follow-up on implantable cardioverter-defibrillator (ICD) monitoring.
Methods
Patient population
We analysed 68 consecutive patients who presented sudden death due to documented VF between June 2012 and September 2019. Patients were included if they had structural cardiac abnormalities as defined by clinical diagnosis associated with myocardial alterations using imaging or electrophysiological criteria. Exclusion criteria consisted of documented monomorphic ventricular tachycardia (VT) on electrocardiogram (ECG) monitoring or on previously implanted device, ventricular thrombus, recent myocardial ischaemia (within 7 days of the ischaemic event), or patient unwilling to participate. A coronary angiogram was performed in all patients but two (under the age of 17). The occurrence of VF as the final event of VT was excluded by ECG or ICD monitoring in patients hospitalized or previously implanted with an ICD and by non-inducibility of VT during programmed ventricular stimulation. Fifty-four patients were included and are described in Table 1. The study protocol was approved by the Institutional Clinical Research and Ethics Committee and all patients or their representatives provided written informed consent. The study complies with the Declaration of Helsinki.
Clinical data and characteristics of ventricular fibrillation episodes
| All group n = 54 pts | Ischaemic cardiomyopathy n = 15 pts | Non-ischaemic cardiomyopathy n = 20 pts | Brugada syndrome n = 19 pts | P-value | |
|---|---|---|---|---|---|
| Clinical characteristics | |||||
| Age at referral | 50 ± 16 | 63 ± 8 | 45 ± 16 | 45 ± 11 | <0.001 |
| Male sex no (%) | 50 (93%) | 14 (93%) | 17 (85%) | 19 (100%) | 0.20 |
| Family history of SCD | 10 | 1 | 3 | 6 | 0.157 |
| Time from diagnosis of CVD to inclusion (years) | 4.2 ± 5.9 | 3.2 ± 5.1 | 4.4 ± 7.1 | 5.1 ± 5.0 | 0.72 |
| Patients previously implanted with ICD | 33 | 4 | 12 | 17 | 0.001 |
| Time from diagnosis of CVD to ICD implantation (years) | 3.8 ± 5.5 | 4.5 ± 6.4 | 2.5 ± 5.2 | 2.2 ± 2.2 | 0.61 |
| Pts with a single clinical VF | 13 | 5 | 6 | 2 | 0.224 |
| Pts with recurrent clinical VF (median-IQR no of VF) | 41 (7 4; 16) | 10 (16 7.8; 20.3) | 14 (5 3.5; 7) | 17 (8 3; 9) | 0.224 |
| Pts with VF storm (≥3 in 24 h) | 16 (30%) | 8 (53%) | 2 (11%) | 6 (29%) | 0.021 |
| Trigger documentation on ECG | 14 pts | 8 pts | 4 pts | 2 pts | 0.014 |
| VF episodes | |||||
| Patients with no spontaneous or induced VF | 2 pts | 0 pt | 2 pts | 0 pt | 0.171 |
| No of episodes | 61a | 19 | 19a | 23 | 0.67 |
| Spontaneous VF | 10 | 8 | 0 | 2 | <0.001 |
| Pacing-induced episodes | 51 | 11 | 19 | 21 | 0.012 |
| Induction site: RV vs. LV | 34/17 | 7/4 | 10/9 | 17/4 | 0.161 |
| Induction mode: | |||||
| Programmed stimulation | 41 | 7 | 16 | 18 | 0.285 |
| Burst pacing | 10 | 4 | 3 | 3 | |
| Total episode duration (s) | 16.3 ± 4.4 | 15.5 ± 4.6 | 15.7 ± 3.5 | 17.3 ± 4.8 | 0.18 |
| No of VF episodes with initial organization | 56 | 16 | 18 | 22 | 0.346 |
| Duration of organized VF (s) | 5.0 ± 3.4 | 4.1 ± 1.9 | 4.6 ± 2.7 | 5.7 ± 4.6 | 0.2 |
| VF cycle length 0–2 s (ms) | 205 ± 27 | 218 ± 26 | 207 ± 25 | 196 ± 27 | 0.12 |
| VF cycle length 2–4 s (ms) | 190 ± 23 | 206 ± 21 | 191 ± 20 | 178 ± 23 | 0.008 |
| VF cycle length 8–10 s (ms) | 180 ± 23 | 199 ± 18 | 178 ± 20 | 169 ± 24 | 0.004 |
| Trigger and Purkinje mapping | |||||
| Trigger mapped (no pts) | 14 | Purkinje: 7 Myocardial: 1 | Purkinje: 2 Myocardial: 2 | Myocardial: 2 | |
| Repetitive Purkinje activity at induced VF (no pts) | 6 | 6 patients (37%) out of 16 pts mapped | 0 patient out of 8 pts mapped | ||
| Purkinje system implicated as a trigger or driver (no pts) | 15 | 7 | 8 | 0 | |
| Driver areas | |||||
| No and location of driver areas during organized VF | One area in 1 episode (2%) Two areas in 35 episodes (62.5%) ≥3 areas in 20 episodes (35.5%) | LV in 1 (6%) LV and IVR in 11 (69%) ≥3 areas in 4 (25%) | LV and IVR in 7 (39%) RV and IVR in 2 (11%) ≥3 areas in 9 (50%) | RV and IVR in 15 (68%) ≥3 areas in 7 (32%) | <0.001 |
| Driver area of focal activitiesb | 10 episodes (18%) (LV in 1, RV in 9) | 2 (12%) (LV in 1, RV in 1) | 0 | 8 (36%) (RV in 8) | 0.003 |
| Catheter ablation | |||||
| No of patients | 41 pts | 10 pts | 14 pts | 17 pts | |
| Median no of VF (prior to ablation) | 7 (4–16) | 15.5 (9–20.3) | 5 (3.3–7) | 8 (3–9) | 0.057 |
| Catheter approaches: no pts | Endocardial: 26 Epicardial: 23 | Endocardial: 10 | Endocardial: 14 Epicardial: 6 | Endocardial: 2 Epicardial: 17 | <0.001 |
Data are presented as n (%) or mean ± standard deviation or median [interquartile range (IQR)] as appropriate. P-value < 0.05 is considered significant. ICD, implantable cardioverter-defibrillator; VF, ventricular fibrillation; IVR, interventricular region; LV, left ventricle; pts, patients; RV, right ventricle; SCD, sudden cardiac death; CVD, cardiovascular disease.
Sixty-one VF episodes were mapped in 52 out of 54 patients; the remaining two patients (one each with hypertrophic and dilated cardiomyopathy) had no spontaneous or inducible VF.
Area of focal activities included in the driver areas as defined in the text.
The study protocol is summarized in a diagram (Supplementary material online, Figure S1).
Electrophysiological study
Antiarrhythmic drugs were discontinued >5 half-lives prior to the study except for amiodarone (n = 7) that was prescribed at the time of referral. Patients on amiodarone had frequent VF episodes, including three who required haemodynamic support with left ventricular (LV) assist devices.
Ventricular fibrillation occurred spontaneously or was induced by electrical stimulation. The initial phase of VF, termed as ‘organized VF’, was discernable on 12-lead ECG, but its end was often difficult to define precisely because of a progressive change to disorganization. To accurately identify the duration of organized QRS complexes (Table 1), we used a metric (non-dipolar component index, see Supplementary material) based on an analysis of all body-surface complexes, which quantifies the spatial organization of QRS waveforms.12 It was measured on successive 1 s windows with values <3% indicating organized VF (Figure 1). Organized VF was analysed during the initial 5 s or less when it was of shorter duration.
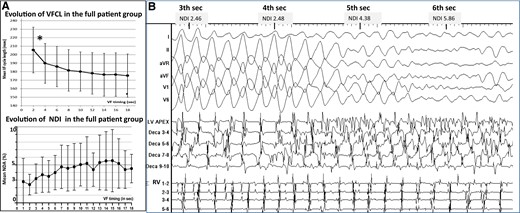
Evolution of ventricular fibrillation in the initial seconds—transition to disorganized ventricular fibrillation. (A) Evolution of ventricular fibrillation frequency (top) and organization (bottom) as a function of time. Ventricular fibrillation cycle length is measured every 2 s on body-surface mapping and the average of right ventricle and left ventricle cycle lengths used. The maximal cycle length decrease over all recorded ventricular fibrillation time (P < 0.001*) occurred in the initial 4 s (window 2–4 s compared with 0–2 s). Ventricular fibrillation organization is quantified every second by a non-dipolar component index (NDI) measuring QRS complex dispersion over the body-surface leads. The duration of organized phase was based on an NDI value <3% indicating organized ventricular fibrillation, whereas a value ≥3% indicated disorganized ventricular fibrillation.12 (B) Transition to disorganized ventricular fibrillation in one patient. Large waveforms on the electrocardiogram and discrete endocardial electrograms are seen at the initial 4 s. Subsequently, the acceleration of the frequency is associated with fragmentation of endocardial electrograms (at 4–5 s) then fine fibrillatory waves on the electrocardiogram. The spatial organization assessed by the non-dipolar component index is indicated for every second.
Non-invasive mapping
Body-surface mapping was performed by reconstructing cardiac epicardial potentials from the chest using an array of 252 electrodes combined with computed tomography (CT)-based geometry (ECVue, Medtronic, OH) to provide a macroscopic view of ventricular wavefronts and identify the drivers at the origin of wavefronts. Unipolar electrograms were reconstructed from each node of an unstructured mesh obtained from CT images. Phase was calculated at each node using a dedicated Hilbert transform to identify activation wavefronts.
The system reconstructed an ‘epicardial view’ of biventricular surface potentials from unipolar torso potentials.13 Maps of VF were generated using specific algorithms combining filtering to eliminate artefacts in signal morphology and phase mapping. The phases of wave propagation were colour coded. A surrogate of the depolarization and repolarization wavefronts were computed from the isophase values equal, respectively, to π/2 and −π/2 allowing tracking of the wavefront tips. This mapping technique facilitates detection of high-curvature waves which may create false rotations. The reentries were, therefore, confirmed by sequential activation of raw unipolar local electrograms covering VF cycle length (VFCL) (Figure 2).
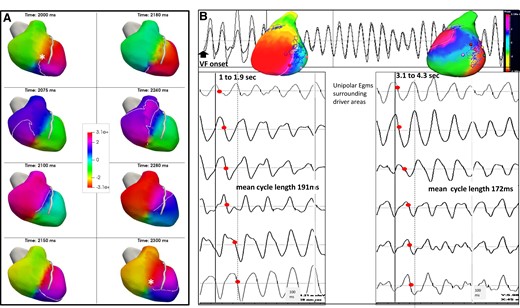
Rotational activity: serial images and acceleration during the initial seconds of ventricular fibrillation. (A) Patient with dilated cardiomyopathy and rotational activity in the right ventricle (total 12 rotations, the driver area in this patient, is shown in Figure 4B). Rotational activity is shown as full phase progression around a centre-point in colour-coded phases of wave propagation. The series of images show two full rotations (cycle length 150 ms) in colour-coded activation maps around a pivot point (asterisk in first and last image). (B) In another patient with dilated cardiomyopathy, rotational activities occurred in lateral left ventricle at the beginning of ventricular fibrillation (1–1.9 s) and one second later (3.1–4.3 s), in addition to other activities (not shown). The top trace shows a sample unipolar electrogram. Rotational activity is shown as full phase progression around a center-point in colour-coded phases of wave propagation. Coloured points indicate the sites where unipolar electrograms are recorded around the pivot point and show sequential activation (timing shown by red points). The mean local cycle length is 191 ms during the 1–1.9 s ventricular fibrillation interval and has decreased to 172 ms during the 3.1–4.3 s ventricular fibrillation interval.
The site of origin of wavefronts was defined as VF driver activity and classified as focal activity, if wavefronts spread centrifugally from a point, or rotational activity, if waves fully rotated around a localized point. The system identified rotational activities as ≥2 rotations and provided electrograms from areas surrounding the pivot points for analysis. Each map was analysed to confirm the rotational activity by sequential patterns of activation.8,13–15
The location and number of these activities were displayed on an epicardial view based on CT geometries, on the right ventricle (RV) or LV surface separated by the interventricular region (IVR). As patients may have multiple driver areas, we identified the main area(s) by summing activity starting from the highest number of activities downwards, until the total significantly exceeded the cumulative number from all remaining areas with P < 0.05 (Supplementary material online, Figure S2). The reproducibility of the locations of driver areas was assessed in individuals (n = 9) who had two VF episodes obtained under different conditions.
Invasive mapping
Three catheters were introduced percutaneously through the femoral veins: one catheter for programmed stimulation and two decapolar catheters to record electrograms along with the anterior RV and LV. The LV catheter was positioned so that some bipoles recorded the distal Purkinje fascicle when possible. Surface electrocardiographic leads and bipolar intracardiac electrograms were recorded with 30–500 Hz bandpass filter. Programmed ventricular stimulation was performed in 49 patients to assess the inducibility of VF; whereas, seven patients had spontaneous VF (five of them did not undergo programmed stimulation). Pacing was performed from the RV apex and if unsuccessful from the LV using an initial basic CL of 600 ms and 400 ms drive trains, with up to three extra stimuli. In cases of non-induction, burst pacing was performed at a CL of 250 ms decrementing by 10 ms steps to 160 ms or 2:1 capture.
Mapping during sinus rhythm
A transseptal approach was used to access the LV endocardium and a sub-xiphistrenal approach was used to access the pericardial space. Mapping was performed only endocardially in patients with ischaemic cardiomyopathy (ICM). Decapolar catheters were used for endocardial mapping and duodecapolar catheters (Lasso or Pentaray, 2 mm bipolar spacing, Biosense-Webster) for epicardial measurements. The structural substrate was identified by abnormal electrogram characteristics during sinus rhythm and delineated by electroanatomical mapping (CARTO, Biosense-Webster). Abnormal electrograms were defined by previously described criteria for bipolar potentials: low amplitude <1 mV (epicardial) or <1.5 mv (endocardial) and/or fractionation (>3 components) of duration ≥70 ms.16–20 Unipolar mapping was not used in this study. The distal Purkinje network was identified by sharp potentials preceding by <10 ms, the larger ventricular electrograms during sinus rhythm.21–23
Mapping during ventricular fibrillation
Ventricular fibrillation was considered to be inducible if it lasted for more than 10 s. Ventricular fibrillation episodes were recorded during the defibrillator charging period. Changes in VFCLs over time were measured in 2 s windows at the RV and LV endocardium and averaged, except when fractionation prevented exact measurement. Purkinje activities in the LV were analysed in association with ventricular activation; they were defined as Purkinje drivers if repetitive activities were associated 1:1 with ventricular activities and had shorter CL than local (recorded with the same bipole) ventricular activation.24
Spatial correlation between ventricular fibrillation drivers and structural substrate
The location of VF drivers was evaluated in relation to the structural substrate defined either by electrophysiological criteria or scar imaging. Cardiac imaging was performed in 22 patients with ischaemic or dilated cardiomyopathy (DCM); scar was defined as areas of late gadolinium enhancement (>50% maximum signal intensity on magnetic resonance imaging) (n = 12) or areas of wall thinning to <5 mm on multidetector CT (n = 10). The driver locations and substrate areas on electroanatomic maps or scar imaging were integrated using the dedicated (MUSIC) cross-platform allowing measurement of the distance between their borders.25 As the interventricular region was not visualized on the driver epicardial view, the spatial correlation was evaluated only in the RV and LV free walls.
Drivers and substrate areas were defined as ‘related’ if their borders were either overlapping or separated by <20 mm (border zone) and ‘unrelated’ if they were separated by ≥20 mm. We included a 20 mm peripheral margin as border zone tissue is part of the substrate which may contribute to reentry or focal mechanisms7,21,25 and to account for uncertainties in electroanatomical reconstruction.13,14,25 All maps are shown on projections in anterior, inferior, and left lateral views.
Ablation and follow-up
Radiofrequency ablation was performed in patients with recurrent VF, in accordance with guidelines.1 When present, spontaneous triggering ectopy was targeted at the site of earliest ventricular or Purkinje activation; in the case of Purkinje triggers, additional radiofrequency energy was applied at surrounding sites.21–23
Substrate ablation was performed by targeting all abnormal fractionated electrograms, as defined above.16–19,26–28 Driver areas not included in the substrate were additionally targeted, but only if local electrograms were fractionated (>3 components), regardless of duration. Purkinje drivers were ablated by targeting Purkinje potentials of distal network. Radiofrequency energy was delivered using an irrigated-tip ablation catheter with a power of 30–45 W and a duration varying between 15 and 60 s guided by the impact on the local electrogram. Ablation temperature was limited to 45°C. Contact force (aiming for 10–30 g) was used in 11 patients. The ablation endpoint was achieved after elimination of abnormal electrograms (eventually distal Purkinje potentials). Non-inducibility of VF was evaluated at the operator’s discretion but was not an ablation endpoint.
Post-procedurally, patients were followed by remote monitoring and by their respective physicians and were promptly reevaluated in the event of shocks from ICDs.
Statistical analysis
Categorical variables are reported as numbers (%) and were compared using χ 2-tests. Continuous variables are reported as mean ± standard deviation or median (25th and 75th percentiles), as appropriate. Group comparisons were performed using Student’s t-tests or ANOVA for normally distributed samples and Mann–Whitney or Kruskal–Wallis tests for non-normal distributions. Paired Student’s t-test or Wilcoxon signed-rank tests were used for paired comparisons of continuous variables. Changes in VFCLs over time were assessed by linear regression. Differences in the spatial distribution of activity were explored using a hypergeometric density function. Spatial correlation of driver and substrate was tested using a χ 2-test of independence. In a subset of patients with two VF episodes, we tested for the independence of the spatial locations of initial and subsequent VF drivers. Kaplan–Meier plots were used to evaluate cumulative survival with freedom from VF recurrences, VF storm, and all-cause mortality. An expanded statistics section is available in Supplemental material. Statistical significance was set at P ≤ 0.05. All statistical analyses were performed using SPSS version 21.0 (SPSS Inc., Chicago, IL).
Results
Fifty-four patients were included: 15 with ICM, 12 with DCM, 8 with hypertrophic cardiomyopathy (HCM), and 19 with Brugada syndrome (BrS). Left ventricle ejection fraction was 27 ± 8% in patients with ICM and 44 ± 17% in those with DCM and HCM. Thirteen patients were included at their index event and 41 patients were referred for recurrent VF episodes. Ectopic triggers initiating spontaneous VF or polymorphic VT were documented on ECGs during previous or current hospitalization in 14 patients.
Detailed clinical and VF characteristics are shown in Table 1. Ventricular fibrillation occurred spontaneously in seven patients (10 episodes) and was induced by electrical stimulation in the remaining patients except for two who were not inducible. Overall, 52 patients have presented VF, with nine of them having two episodes. The mean VF duration was 16 ± 4 s before external defibrillation. An organized pattern of VF was observed in 56 episodes, whereas VF was immediately disorganized in five episodes, four of them being induced by burst pacing. The evolution of VF frequency and organization for the full group and an individual example are shown in Figure 1.
Organized ventricular fibrillation
During organized VF, endocardial electrograms showed little or no fractionation. The mean VFCL was similar in the RV and LV, in both body surface (196.6 ± 23 vs. 195.8 ± 22 ms, P = 0.8) and endocardial recordings (195.6 ± 27 vs. 195.9 ± 25 ms, P = 0.9).
Ventricular fibrillation activity
Ventricular fibrillation mapping showed large ventricular wavefronts that arose from a limited number of areas (Figure 3). Rotational activity was observed during all episodes and was more sustained in the LV or interventricular region than in the RV, with a maximal number of consecutive rotations of 7.8 ± 4.3 and 5.8 ± 2.4 vs. 3.1 ± 3.4, respectively (P < 0.001 for both comparisons). In a subset of patients, the CL of rotational activity (measured at same locations) consistently demonstrated a decrease (Figure 2B) over the initial 5 s (from 187.4 ± 17 to 174.8 ± 20 ms, P < 0.001). Focal breakthroughs were less common and occurred mainly in BrS (Table 1 and Supplementary material online, Figure S3).
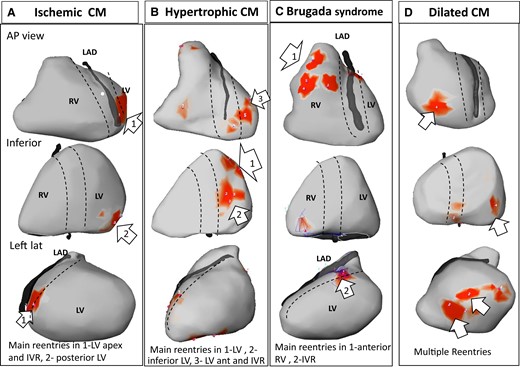
Main drivers during initial organized ventricular fibrillation. Epicardial views in anterior, inferior, and left lateral projections, showing driver distribution during the first 5 s after ventricular fibrillation initiation. The dotted lines depict the interventricular region (IVR—indicating septal projection) along the left anterior descending and interventricular coronary arteries. Rotational activities are shown in red areas. The numbers indicate the number of rotations at each area. Main drivers (as defined in the text) are indicated by white arrows. Note that drivers are present in interventricular region in all cases. CM, cardiomyopathy.
The spatial distribution of the main drivers on the RV, LV, or IVR regions was individually variable. One, two, or all three regions were involved in 1(2%), 35(62.5%), and 20(35.5%) VF episodes, respectively, with the IVR being almost always observed in 51/56 episodes (91%) (Table 1). The incidence of driver areas in the RV and LV was dependent on the underlying disease (Table 1 and Figure 3). In patients with ICM, driver areas were located in the LV (and IVR) in 12 of 16 episodes (75%), while in BrS they were located in the RV (and IVR) in 15 of 22 episodes (68%). Drivers in DCM were heterogeneously located in the RV and LV and present in more areas. In HCMs, a main driver was present in inferior-apical LV area in four of seven cases (57%) (Figure 3).
Nine patients had two VF episodes, which occurred under different induction conditions (Supplementary material online, Figure S4). The location of drivers was preserved between the first and second episode for 13 out of 23 driver locations (59%); this was significantly different than random distribution (P < 0.001).
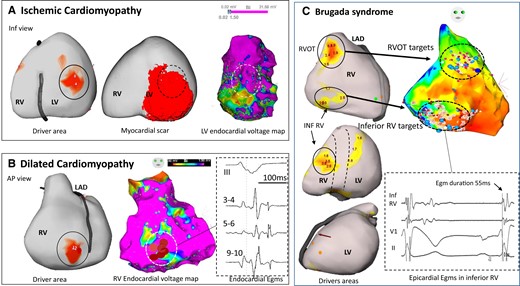
Driver locations in relation to substrate. In three patients, the locations of drivers are shown in relation to structural substrate defined on electrophysiological criteria or scar imaging. (A) A case of ischaemic cardiomyopathy with drivers (full circle) in the inferior left ventricle associated with myocardial infarction scar on magnetic resonance imaging (middle) and low voltage area on electrogram mapping (right). There is an overlapping of driver area with the substrate (dotted circle) defined on imaging or mapping technique. (B) A case of dilated cardiomyopathy with a right ventricle driver area (full circle) related to low voltage (middle) and fractionated and late electrograms (right). This patient had no scar in the right ventricle on magnetic resonance imaging. Note that the driver is located at the border of abnormal electrogram substrate. (C) A case of Brugada syndrome with drivers in the RV outflow tract and inferior right ventricle (left), overlapping with abnormal epicardial electrograms (right). After ablation at the RV outflow tract, ventricular fibrillation was still inducible by two extrastimuli with persistent drivers in the inferior right ventricle. Ablation at the inferior right ventricle resulted in ventricular fibrillation non-inducibility and no recurrence of ventricular fibrillation for 62 months. Note that inferior right ventricle displays mildly abnormal electrograms not fulfilling all abnormality criteria (electrogram duration is 55 ms instead of being >70 ms). The colours of driver areas are not uniform as different system versions have been used. AP, anteroposterior; LAD, left anterior descending coronary artery.
Relationship with structural substrate
A mean of 1096 ± 782 (endocardial RV), 1143 ± 793 (endocardial LV), and 3211 ± 1981 (epicardial) sites were recorded per patient. Areas of abnormal fractionated electrograms were identified in all but five patients (four with HCM and one with DCM). The drivers were strongly related to abnormal electrogram areas, with a correlation varying according to underlying heart disease. In patients with ICM and non-ICM, 79% (22/28) of LV drivers (P < 0.001) and 47% (7/15) of RV drivers (P = 0.046) correlated with abnormal electrograms. In patients with BrS, 83% (20/24) of RV drivers (P < 0.001), but not the LV drivers (1/7, 14%, P = NS) correlated to areas of abnormal electrograms (Figure 4). A similar association was observed using scar imaging. Myocardial scar was identified in 20 of 22 patients. Among the 34 driver areas, 22 (65%) were related to a myocardial scar (P < 0.001).
Purkinje repetitive activity
Six patients (four HCM and two DCM) had repetitive Purkinje activities at the onset of induced VF, accounting for 37% (6/16) of patients with non-ICM having Purkinje mapping. Five of the six sustained VF were induced during programmed stimulation from the LV, after unsuccessful attempts from the RV. Purkinje activity was present in a median of 14 initial cycles/beats [interquartile range (IQR) 10–17] and had shorter CL than myocardial activation (218 ± 26 vs. 230 ± 31 ms, P = 0.031) suggestive of driving activity (Supplementary material online, Table S2). Before induction of sustained VF, non-sustained episodes showing 1:1 Purkinje activity were inducible in four of these patients. Purkinje recognition might require careful examination of recordings because of superimposed fragmented myocardial electrograms (Figure 5). Bundle branch reentry was excluded by the presence of dissociated left bundle potential or the absence of sequential activation between proximal and distal fascicle. In contrast, no repetitive Purkinje activity was observed during VF induction in eight patients with BrS.
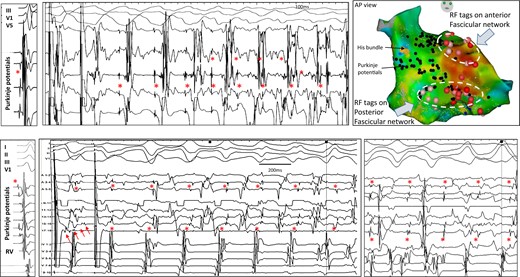
Inducible repetitive activity in distal Purkinje in hypertrophic cardiomyopathy. The upper panels show a recording in sinus rhythm and ventricular fibrillation induction with programmed stimulation in a 29-year-old man. A decapolar catheter along the distal fascicle indicates that each of the initial ventricular beats is associated with Purkinje activity (red asterisks); the latter has a more rapid cycle length (mean 219 ms) than the local ventricle (230 ms). The lower panels show a recording in sinus rhythm and ventricular fibrillation induction with programmed stimulation in a 63-year-old man. Ventricular fibrillation induction is associated with 1:1 Purkinje activity. The multispline catheter shows Purkinje activities on several bipoles (red asterisks); Purkinje cycle length (mean 237 ms) is shorter than local ventricular cycle lengths (252 ms). Another ventricular fibrillation window occurring 1 s later is also shown. Note that ventricular electrograms are significantly fractionated and disturb Purkinje recognition. This is clearly seen (five small arrows) in the last paced beat inducing ventricular fibrillation. In both patients, ventricular fibrillation was non-inducible after Purkinje ablation. The ablation lesions targeting the Purkinje arborization (red tags) are shown for the upper case. In both patients, the 12-lead electrocardiograms of ventricular fibrillation induction and voltage maps are shown in Supplementary material online, Figure S6.
Overall, including the trigger cases (see below), the distal Purkinje system was implicated as either a trigger (n = 9) or driver (n = 6) in 15 of 35 patients (43%) with ICM or non-ICM (Table 1).
Disorganized ventricular fibrillation
Disorganized VF was analysed during the 5 s preceding defibrillation. There was consistent fractionation of endocardial electrograms, with heterogeneous activity in simultaneous recordings in different leads. Less fractionation on body-surface potentials enabled CL measurements that were significantly shorter in the LV than RV (174.8 ± 23 vs. 179.9 ± 23 ms, P < 0.001).
Ventricular fibrillation activity originated from multiple areas producing complex wavefronts that changed from beat to beat; however, a subset of patients had stable (>5 activities) driver activity as during organized VF, particularly eight with ICM, four with cardiomyopathies, and two with BrS. In patients with initial Purkinje drivers, Purkinje activity was dissociated and slow.
Catheter ablation
Radiofrequency ablation was performed in 41 patients with recurrent VF [median seven episodes (IQR 4–16)]. Four patients had trigger ablation only (two patients with ICM and two with HCM), 10 patients had both trigger and substrate ablation, and 27 patients had substrate ablation only (Table 2). The total procedure time was 4.6 ± 2.1 h. Ventricular fibrillation occurred in 10 patients (24%) during catheter manipulation or radiofrequency delivery and one patient required pericardial drainage for cardiac tamponade.
Individual ablation results
| SHD | Sex | Age | #vf prior to ablation | Trigger | Substrate | RF delivery, min | VF inducible | Reablation (timing in months) | Total FU in months | Cause of death | Drug at last FU | VF recurrence (timing of 1st VF in months) |
|---|---|---|---|---|---|---|---|---|---|---|---|---|
| Isch CM | M | 65 | 31 | Purkinje | LV | 42 | VT Induc | 105 | BB | No VF 1 VT | ||
| Isch CM | M | 61 | 18 | Purkinje | 14 | NT | 104 | No VF 1 VT | ||||
| Isch CM | M | 64 | 15 | Purkinje | LV | 37 | NT | VT abl at 12 m | 86 | Non-CV | BB | No VF |
| Isch CM | F | 74 | 7 | LV | 22 | NT | 82 | BB | No VF | |||
| Isch CM | M | 71 | 15 | Purkinje | LV | 33 | NT | 1 | VF + HF | >3 VF (1 m) | ||
| Isch CM | M | 70 | 31 | Purkinje | LV | 68 | NT | 1 | VF + HF | 23 VF (1 m) | ||
| Isch CM | M | 57 | 16 | Purkinje | LV | 29 | N Induc | 45 | BB | No VF | ||
| Isch CM | M | 54 | 4 | Myocardial | LV | 40 | N Induc | 45 | BB | No VF | ||
| Isch CM | M | 63 | 21 | Purkinje | 15 | NT | 34 | BB | 1 VF (17 m) | |||
| Isch CM | M | 43 | 3 | LV | 45 | Induc | 23 | MI + HF | >2VF (4 m) | |||
| DCM | F | 23 | 3 | Myocardial | LV | 35 | NT | 51 | BB | No VF | ||
| DCM | M | 65 | 5 | LV + RV | 50 | N Induc | 44 | Non-CV | BB | No VF | ||
| DCM | M | 74 | 7 | LV | 45 | Induc | 10 | Cancer | >2 VF (8 m) | |||
| DCM | M | 53 | 8 | LV + Purkinjea | 20 | NT | 29 | Post-transpl | >6 VF (16 m) | |||
| DCM | F | 65 | 16 | LV + RV | 23 | NT | 33 | BB | 1 VF (1 m) | |||
| DCM | H | 35 | 3 | Myocardial | LV + RV | 38 | NT | 26 | No VF | |||
| HCM | M | 10 | 6 | Purkinje | 5 | NT | 102 | BB | 1 VF (92 m) | |||
| HCM | F | 17 | 2 | Purkinje | 9 | NT | 101 | BB | No VF | |||
| HCM | F | 24 | 12 | Purkinjea | 18 | Induc | 99 | BB | No VF | |||
| HCM | M | 16 | 3 | LV | 55 | Induc | 52 | BB | 11 VF (1 m) | |||
| HCM | M | 50 | 5 | Purkinjea | 42 | NT | 48 | BB Amio | 1 VF (29 m) | |||
| HCM | M | 63 | 5 | Purkinjea | 48 | N Induc | 23 | No | No VF | |||
| HCM | M | 58 | 4 | LV | 27 | Induc | 22 | BB | No VF | |||
| HCM | M | 29 | 7 | Purkinjea | 21 | N Induc | 12 | BB | No VF | |||
| BrS | M | 41 | 8 | RV | 57 | NT | 51 | HQuin | 3 VF (12 m) | |||
| BrS | M | 52 | 2 | RV | 20 | NT | 101 | HQuin | 2 VF (6 m) | |||
| BrS | M | 32 | 3 | RV | 22 | N Induc | 59 | No VF | ||||
| BrS | M | 32 | 5 | RV | 21 | Induc | 95 | 1 VF (23 m) | ||||
| BrS | M | 39 | 9 | RV | 34 | NT | VF abl at 66 m | 57 | HQuin | 2 VF (6 m) | ||
| BrS | M | 35 | 8 | RV | 12 | VT LV | VF abl at 30 m | 60 | No VF | |||
| BrS | M | 45 | 2 | RV | 29 | Induc | 54 | No VF | ||||
| BrS | M | 48 | 4 | RV | 30 | Induc | VT abl at 73 m | 90 | No VF | |||
| BrS | M | 63 | 2 | RVOT | 11 | NT | VPB abl at 6 m | 105 | No VF | |||
| BrS | M | 29 | 8 | RV | 16 | Induc | 62 | HQuid | 2 VF (16 m) | |||
| BrS | M | 59 | 3 | RVOT | 10 | VT Induc | 54 | No VF | ||||
| BrS | M | 56 | 20 | RV | 29 | Induc | 58 | No VF | ||||
| BrS | M | 35 | 46 | RV | 21 | N Induc | VF abl at 37 m | 36 | No VF | |||
| BrS | M | 32 | 23 | RV | 12 | VT Induc | 59 | No VF | ||||
| BrS | M | 60 | 5 | RV | NT | 54 | No VF | |||||
| BrS | M | 46 | 8 | RV | 23 | N Induc | 62 | No VF | ||||
| BrS | M | 53 | 24 | RV + LV | 62 | Induc | 50 | HQuin | 2 VF (11 m) | |||
| 35M (85%) | 47.7 ± 17 years | Mean 10.4 ± 9.8 Med 7 IQR 4;16 | 29.8 ± 15.6 28 IQR 19;40 | VF abl in 3 pts | 55.7 ± 30.2 51 IQR 34;82 | No VF recurrence in 25 pts (61%) |
Group results are presented as mean ± standard deviation or median [interquartile range (IQR)]. CL, cycle length; RF, radiofrequency; RV, right ventricle; pts, patients; m, months; LV, left ventricle; VF, ventricular fibrillation; NT non-tested; CV, cardiovascular; BB, beta-blocker; HQUIN, hydroquinidine; HF, heart failure; VT, ventricular tachycardia; RVOR, right ventricular outflow tract; FU, follow-up.
Purkinje driver.
Inducibility testing was performed using the pacing protocol which induced VF prior to ablation. In the column ‘substrate’, the total epicardial RV surface was separated into an upper half (anterior) and a lower half (inferior).
Trigger ablation
The ectopic origin was mapped to the Purkinje network in nine (seven with ICM and two with HCM) and ventricular myocardium in five (one with ICM, two with DCM, and two with BrS). It was located within areas of abnormal electrograms in 11 of 14 (79%) cases (Supplementary material online, Figure S5).
Substrate ablation
Substrate ablation was performed in 37 patients. Substrate in BrS was ablated on the epicardial aspect of the anterior RV in all, in the RV inferior wall in five, and LV area in one (Figure 4). Substrate in ICM was ablated on the endocardial LV including the septum in all patients. Substrate in DCM was ablated on the endocardial LV in five, Purkinje in one, and epicardium in three with additional areas in the RV in three. In patients with HCM, substrate electrograms were targeted in two patients; the six other patients had evidence for Purkinje arrhythmogenicity (Supplementary material online, Figure S6), manifesting as trigger or driver activities, and distal Purkinje system was targeted as shown in Figure 5. Overall, substrate ablation including Purkinje tissue was performed using 30 ± 16 min of radiofrequency energy applications.
Outcome
The results are detailed in Table 2. Two patients died within the month following ablation. During a mean follow-up of 56 ± 30 months, there was a significant reduction or elimination of VF recurrences in the patient group. The median number of VF recurrences was 0 (IQR 0–2) (mean 1.5 ± 4) as compared with a pre-procedural median of seven (IQR 4–16) (mean 10 ± 10, P < 0.001). Overall, 25 of 41 patients (61%) have had no VF recurrences on ICD interrogations, nine patients (22%) have had one or two recurrences, and seven patients (17%) have had >2 recurrences. Only four patients continued antiarrhythmic drugs.
A repeat ablation procedure was performed for recurrent VF in three patients with BrS. Repeat ablation involved the anterior RV previously targeted and an additional region in the inferior RV. Figure 6 shows individual outcome and actuarial survival curve, after one or two ablation procedures. Supplementary material online, Figure S7 shows actuarial survival curves for VF storm and all-cause mortality.
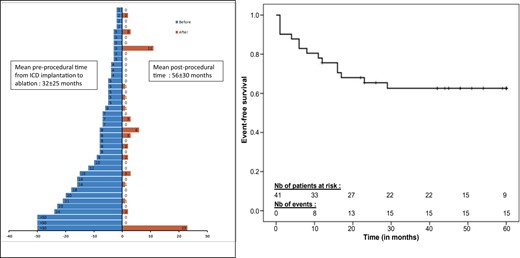
Number of ventricular fibrillation episodes terminated by implantable cardioverter-defibrillator shocks, before and after ablation—individually and full group. The left panel shows the number of ventricular fibrillation episodes terminated by implantable cardioverter-defibrillator shocks, before and after ablation, in individual patients. The right panel shows actuarial survival curve for ventricular fibrillation recurrence after catheter ablation.
Discussion
This study describes mapping results during the initial seconds of VF in a large number of patients with structural cardiac pathologies. It shows that (i) the activities maintaining VF are mainly generated from the Purkinje network and structural substrate, before spreading to establish disorganized VF; (ii) Purkinje activity may be elicited by programmed ventricular stimulation; and (iii) a multicomponent targeted ablation is associated with significant long-term reduction in VF burden (Structured Graphical abstract).
Mapping the ventricular fibrillation onset
The onset of VF has been mapped in few experimental studies. Repeated wavefront sequences have been described as originating from acutely ischaemic regions during spontaneous VF10; or specifically, that figure-of-eight reentry or 1–2 rotating waves were the very first activities in electrically induced VF.6,11 In patients with cardiomyopathies, VF has been mapped intraoperatively providing evidence for organized wavefronts and sustained reentries.7 In our study, we investigated the period from the initiating trigger to disorganized VF, which confirmed that reentries were also the dominant activity. We observed a rapid acceleration of reentries within these few seconds, leading to disorganized VF with heterogeneous activities consistent with complex wavefront dynamics.3–5 In some patients the use of burst pacing immediately induced disorganized VF bypassing the transitional organized phase. These dynamical changes in frequency and complexity that occur in early VF have been previously investigated and involve mechanisms such as atrial potential duration restitution properties, calcium dynamics, sympathetic discharge, and structural factors.4,8
The current study reports on the different components of the VF mechanism at its onset. A spontaneous initiating beat—a Purkinje or myocardial trigger—was identified in some patients, but could not be documented in others. Most patients required VF induction manoeuvers. The subsequent activities were mainly related to the underlying structural substrate when observed from body-surface mapping. In ICM, driver areas were associated with LV substrate, consistent with previous reports,7 while driver locations in DCM were heterogeneous, reflecting the variety of histopathological alterations. In BrS, the anterior RV was the dominant arrhythmogenic region as evidenced by reentries and especially focal breakthroughs.18 In HCM, driver activities dominated in the inferior-apical LV, suggesting the involvement of regional structures such as papillary muscles or the Purkinje network. Importantly, the interventricular region harboured driver activities in nearly all patients. This can be explained by the inclusion of cardiomyopathies often associated with septal scar, but is also in line with experimental studies describing the septal junction as the most common location for reentries, including in normal hearts, which was attributed to its anatomical heterogeneities.11,20,29
Purkinje system as a ventricular fibrillation driver
An important finding in the current study was the contribution of the Purkinje system in maintaining VF. In many previous studies, Purkinje ectopy was demonstrated to trigger spontaneous VF occurring after myocardial infarction or in a variety of cardiomyopathies; this however, represents a minority of patients presenting with VF.21,23 A maintaining role of the Purkinje system has been shown in experiments during late stages of VF, in dogs30 or in ex vivo human hearts.31 The present study shows that Purkinje activity may be elicited during programmed stimulation in 37% of patients with non-ICM, without identified triggers. Purkinje activity had faster activation rate when compared with local muscle and was present during 14 beats, i.e. about 3 s of VF. The distal location of activities and its polymorphic pattern on ECG were clearly distinct from bundle branch reentry previously described in patients with DCM. This Purkinje response to stimulation was not observed in patients with BrS; it has been reported in a few cases of idiopathic VF but not in normal patients during LV programmed stimulation.24 Its role in clinical VF was suggested by ablation of the distal Purkinje system resulting in favourable outcome, a result particularly relevant in HCM patients in whom no myocardial substrate was targeted. The propensity of distal fascicles to produce reentry has been shown in prior computer studies, especially in association with cardiac structural pathologies.21,31,32 A reduction in VF vulnerability has also been reported in experimental studies using modelling or ablation of the Purkinje network9,30,33,34; and a termination of long-lasting VF has recently been published using radiofrequency ablation.35
Clinical implications
The finding that initial organized VF arises mostly from the structural substrate and Purkinje system improves our understanding of human VF. The results show the rapid evolution of activities in the first seconds of VF, resulting in different mapping scenarios depending on their timing. This is exemplified in BrS—an RV pathology—during which mapping showed RV driving activities dominating for 5–6 s before being overcome by LV activities. In contrast, disorganized VF showed diffuse activities and a shorter VFCL in the LV, in line with prior studies.36 It may be speculated that drugs preventing dynamic changes in frequency and complexity may prolong the duration of slow organized VF and be of clinical interest by allowing better tolerance and survival rate.3
The Purkinje system was shown here to be an essential component of the VF mechanism, extending beyond its triggering role. It was overall involved in 43% of patients with ICM or non-ICM, an incidence possibly underestimated as a limited part of fascicles was mapped. The proof of Purkinje involvement required a stable catheter positioning during VF induction, using several recording bipoles to ascertain the recognition of Purkinje activity within the surrounding fractionated myocardial electrograms.
These results have significant implications for improvement of VF ablation. It expands upon prior studies which reported more limited groups of patients using substrate ablation alone or combined with trigger.15,23,28 Most of the VF drivers that we targeted, included common areas (as infarct region in ICM or anterior RV in BrS) related to fragmented electrograms which were ablated as described previously.16–20,26–28 In complement of current ablation strategies, we have also targeted two other areas of activity, the Purkinje system, and individual areas (in 6 patients) harbouring sustained rotational activity during VF, with short-duration fragmented electrograms at baseline. It is likely that the latter areas present functional abnormalities that could be exposed using dynamic testing such as pacing or drug infusion, as in other arrhythmic conditions.19,27,37 In cases where the VF mapping system is not available, detailed electrogram evaluation with functional testing, could allow to delineate such areas.19,37–39 Purkinje ablation was performed using a technique similar for trigger or driver, being different in the extent of targeted network; this tissue was more amenable to ablation than hypertrophic or scarred myocardium.40,41
In our study, the efficacy of ablation was demonstrated with a follow-up of almost 5 years, without antiarrhythmic drugs in most, suggesting favourable long-term outcome. Further studies are, however, needed to better specify the functional and structural abnormalities underlying VF reentries and the optimal extent of mapping and ablation required for its effective treatment.
Limitations
Our study has several limitations. First, we used body-surface mapping using the inverse solution. This approach has uncertainties especially during mapping in sinus rhythm42 but is able to epicardially map ongoing arrhythmias with clinically relevant accuracy.13,14 An alternate method using basket catheter is available to map VF in clinics, with its own limitations.15 We could not differentiate endocardial and mid-ventricular wall origins, and for instance, focal breakthroughs in BrS could express intramural reentries. We have only used driver activities ≥2 rotations as performed in prior studies8,43 to localize the most arrhythmogenic areas, rather than to evaluate the full spectrum of driver dynamics. Second, only a single VF episode was mapped in most patients, often electrically induced, which was likely to be insufficient to replicate all VF driver scenarios. However, the link between drivers and substrate was consistent and similar between induced and spontaneous episodes. Third, the protocol could not be uniform owing to the severe clinical conditions and a limited extent of Purkinje network could be mapped using the current catheters. Finally, although the long-term follow-up and VF burden data suggest ablation efficacy, the lack of a control group requires confirmatory studies.
Conclusions
In patients with structural abnormalities, the activities associated with the initial organized phase of VF relate to the Purkinje network and structural substrate, before disseminating throughout the ventricles. Targeted ablation results in effective reduction of VF burden.
Supplementary material
Supplementary material is available at European Heart Journal online.
Acknowledgments
The authors would like to thank Xavier Pillois (passed away to great sadness in August 2021), Rozenn Mingam, and Sophie Samson for the follow-up outcome. This work was supported by the National Research Agency (ANR-10-IAHU04-LIRYC), the European Research Council (FP7-SYMPHONY ERC-2012-ADG_20120314), the Leducq Foundation (Transatlantic Network of Excellence RHYTHM 16CVD02), and the Fondation Coeur et Artères (FCA17T2).
Conflict of interest
Dr Haissaguerre has received research grants from Biosense Webster and Medtronic. Dr Sacher has received honoraria and consulting fees from Biosense Webster. Dr Jais has received speaker fees from Boston Scientific and Biosense Webster. Dr Calkins is a consultant for Medtronic Inc. and St. Jude Medical. Dr Calkins has received research support from the St. Jude Medical Foundation and Boston Scientific Corp. Dr Nademanee has received research grant support from Medtronic and Biosense Webster. All other authors have reported that they have no relationships relevant to the contents of this paper to disclose.
References

