


Abstract
The aim of this study was to investigate the causal effects between atrial fibrillation (AF) and kidney function.
We performed a bidirectional summary-level Mendelian randomization (MR) analysis implementing the results from a large-scale genome-wide association study for estimated glomerular filtration rate (eGFR) by the CKDGen (N = 765 348) and AF (N = 588 190) to identify genetic instruments. The inverse variance weighted method was the main MR method used. For replication, an allele score-based MR was performed by individual-level data within a UK Biobank cohort of white British ancestry individuals (N = 337 138). A genetic predisposition to AF was significantly associated with decreased eGFR [for log-eGFR, beta −0.003 (standard error, 0.0005), P < 0.001] and increased risk of chronic kidney disease [beta 0.059 (0.0126), P < 0.001]. The significance remained in MR sensitivity analyses and the causal estimates were consistent when we limited the analysis to individuals of European ancestry. Genetically predicted eGFR did not show a significant association with the risk of AF [beta −0.366 (0.275), P = 0.183]. The results were similar in allele score-based MR, as allele score for AF was significantly associated with reduced eGFR [for continuous eGFR, beta −0.079 (0.021), P < 0.001], but allele score for eGFR did not show a significant association with risk of AF [beta −0.005 (0.008), P = 0.530].
Our study supports that AF is a causal risk factor for kidney function impairment. However, an effect of kidney function on AF was not identified in this study.
This study supports that atrial fibrillation is a causal factor for kidney function impairment, although causal effects from kidney function on the risk of atrial fibrillation was inapparent.
See page 2824 for the editorial comment on this article (doi:)
Introduction
Atrial fibrillation (AF) is the most common heart arrhythmia disease and affects over 30 million individuals worldwide.1 AF is an important cause of heart failure or stroke, which leads to an increased risk of death in AF patients. Due to the global aging trend, the prevalence of AF is predicted to further increase, and the related socioeconomic burden is growing.
Chronic kidney disease (CKD) is another major comorbidity in modern medicine with increasing prevalence and substantial socioeconomic impact.2 As CKD and AF are highly prevalent in elderly individuals and share common metabolic risk factors,3 , 4 the two comorbidities frequently coexist.5 , 6 Previous observational studies suggested that the two diseases are risk factors for each other, suggesting a bidirectional relationship.5 , 7 , 8 CKD and AF are considered to synergistically aggravate the risk of stroke, adverse cardiac outcomes, and mortality.9
On the other hand, because a large overlap is present in risk factors and because CKD and AF commonly occur in elderly individuals with complex comorbidities, identifying causality between CKD and AF is difficult. Thus, further evidence independent of reverse causation or confounding, which is inevitable in observational studies, is warranted to investigate causal effects between CKD and AF. The evidence would provide information on whether modification of one may lead to a decreased risk of the other, which would help clinicians identify targetable causal factors for AF or CKD. Furthermore, the information may guide clinicians to perform early screening for the causal factors in patients with prevalent AF or CKD, preventing delayed diagnosis of important causal factors.
Mendelian randomization (MR) is a useful tool for identifying causal effects from modifiable exposure on complex diseases.10 As MR utilizes a genetic instrument, a significant association between genetic predisposition for exposure and outcome suggesting causality, which is minimally affected by reverse causation or confounding. The method has been popularized in modern literature, identifying important causal factors for various complex diseases.11
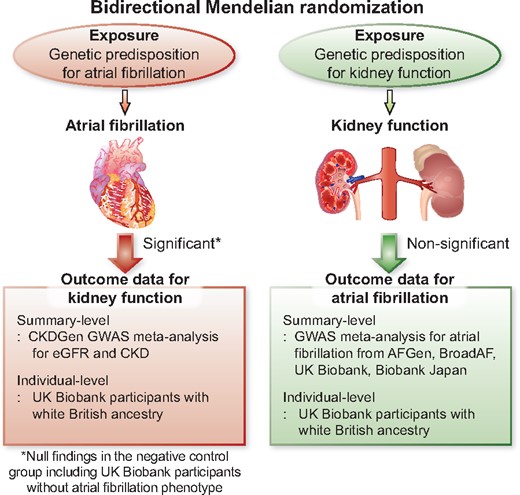
In this study, we performed a bidirectional MR analysis between AF and kidney function by utilizing recent large-scale meta-analysis genome-wide association studies (GWASs). We hypothesized that there may be a directional causal effect between AF and kidney function (Graphical abstract). We performed both a two-sample MR based on summary-level data and an allele score-based MR with individual-level data. Throughout the analyses, we identified a consistent result suggesting a causal effect of AF on kidney function impairment.
Methods
Ethical considerations
The study was performed in accordance with the Declaration of Helsinki. The study was approved by the institutional review boards of Seoul National University Hospital (No. E-2008-011-1145) and the UK Biobank consortium (application No. 53799). The genetic instrument implemented in this study has been previously published.12 , 13 The summary statistics for the CKDGen GWAS meta-analysis for kidney function traits are in the public domain (URL: https://ckdgen.imbi.uni-freiburg.de/, last accessed 2021-05-07). The summary statistics for the AF trait are available on the Cardiovascular Disease Knowledge Portal (URL: https://www.broadcvdi.org/, last accessed 2021-05-07). As the study investigated anonymous databases or summary-level data, the requirement for informed consent was waived.
GWAS meta-analysis for AF
We implemented a previous multi-ethnic GWAS meta-analysis for AF in this study.13 The study investigated >588 190 individuals (65 446 AF cases) mainly from the AFGen, Broad AF, UK Biobank, and Biobank Japan studies; of these, 84.2% were individuals of European ancestry, 12.5% were of East Asian ancestry, 2% were of African-American ancestry, and 1.3% were of Brazilian and Hispanic ancestry (Supplementary material online, Methods). The study reported 94 AF-associated independent sentinel variants reaching genome-wide significance with the AF trait by combined ancestry meta-analysis. Additional GWAS of individuals of European ancestry reported 84 sentinel single-nucleotide polymorphisms (SNPs) that were in genome-wide significant association with AF. The identified genetic variants implicate genes enriched within AF-related pathways, including cardiac development, electrophysiological mechanisms, and contractile or structural functions. We utilized the reported SNPs as the genetic instrument for AF in this study and the summary statistics as the outcome data for AF in our summary-level MR analysis (Figure 1).
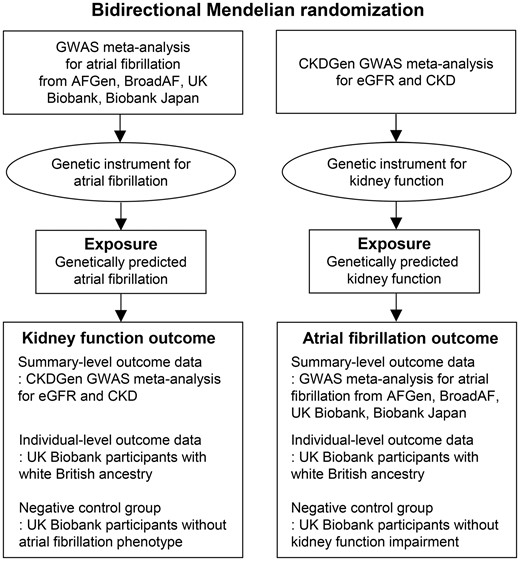
Study flow diagram. The study was a bidirectional Mendelian randomization analysis testing the causal effects between atrial fibrillation and kidney function. The genetic instrument for atrial fibrillation, derived from the previous genome-wide association study meta-analysis, was implemented to genetically predict atrial fibrillation and the causal estimates were calculated in the CKDGen genome-wide association study meta-analysis for estimated glomerular filtration rate and chronic kidney disease by summary-level Mendelian randomization. The genetic instrument for kidney function was introduced from the CKDGen genome-wide association study meta-analysis result and the causal estimates were calculated in the atrial fibrillation genome-wide association study meta-analysis result as a summary-level Mendelian randomization. Replication analysis was performed with the individual-level outcome data from the UK Biobank participants with white British ancestry as an ancestry-specific allele score-based Mendelian randomization analysis. The negative control groups, those without the phenotype of interest, were constructed including UK Biobank participants without atrial fibrillation or chronic kidney disease. If the causal estimates were not attenuated in the negative control groups, this would imply a presence of a pleiotropic pathway as there was no phenotype of interest to drive the causal effects from genetically predicted exposures to outcome traits. CKD, chronic kidney disease; eGFR, estimated glomerular filtration rate; GWAS, genome-wide association study; MR, Mendelian randomization.
GWAS meta-analysis for kidney function
The CKDGen consortium provides the largest GWAS meta-analysis results for kidney function traits to date.12 The study meta-analyzed 121 GWASs including 765 348 individuals, of whom 74.1% were of European ancestry, 23.4% were of East or South Asian ancestry, 1.8% were of African-American ancestry, and 0.6% were of Hispanic ancestry (Supplementary material online, Methods). The prevalence of CKD stage 3 or higher was ∼8%. A total of 264 SNPs that were associated with log-transformed estimated glomerular filtration rate (eGFR) based on creatinine values and replicated in the Millions Veterans Programs data, with the lowest P-value in the 1-Mb segment, were reported as the index SNPs. In addition, the study performed GWAS limited to individuals of European ancestry, reporting 256 index SNPs. The genetic variants reported in the study implicated genes expressed in kidney-related tissues. We utilized the reported SNPs as the genetic instrument for eGFR and the summary statistics as the outcome data for kidney function in our summary-level MR (Figure 1).
UK Biobank data
We utilized the UK Biobank data to perform additional GWASs to identify confounder-associated SNPs. In addition, allele score-based MR was performed with the data (Figure 1). The UK Biobank is one of the largest prospective cohorts, including >500,000 individuals aged 40–69 years across the UK, and the details have been published previously.14 , 15 The data have been extensively phenotyped and genotyped; thus, identifying confounder information in the individual-level data was possible. Moreover, the study measured baseline serum cystatin C, which has a distinct value as a biomarker for kidney function16; thus, we trimmed the genetic instrument for eGFR with this information. The details of the collected data from the UK Biobank are described in the Supplementary material online, Methods.
Methods to determine genetic instruments
The flow diagram showing the selection of SNPs used to assess the genetic instruments and perform MR investigations is presented in Figure 2. First, we trimmed the genetic instrument to attain the independence assumption,10 as the causal estimates should not be biased by a genetic variant that is strongly correlated to other possible confounders to reveal causal effects in MR analysis. We performed GWAS with the UK Biobank data adjusted for age, sex, age × sex, age2, and the first 10 principal components for phenotypes of obesity, hypertension, dyslipidaemia, and diabetes mellitus, which are the components related to metabolic syndrome and thyroid disorder in the UK Biobank data. The definitions for the variables are presented in the Supplementary material online, Methods. For the GWAS, unrelated individuals were included and those who were outliers due to heterozygosity or missing rates or had sex chromosome aneuploidy were excluded. The GWAS was performed with 337 138 individuals of white British ancestry in the UK Biobank. In addition, we looked up the reported associations for systolic blood pressure17 and body mass index18 of the SNPs available in the previous GWAS analyses (Supplementary material online, Methods). The SNPs not reaching the P < 1 × 10⁻⁵ level of association with the confounders in the results remained in the filtered genetic instrument. Additional filtering was applied to the genetic instrument for kidney function, as eGFR determined by serum creatinine levels can be biased by diet or body shape. We additionally excluded SNPs that did not reach the Bonferroni-adjusted significance level (0.05/tested number of SNPs) associated with the eGFR values determined by the CKD-EPI equation based on cystatin C levels or those with opposite direction of the betas for the cystatin C eGFR.19 In genetic instruments for AF, we reconfirmed that the SNPs were independent by pruning SNPs within a 1-Mb window with an r 2 < 0.001 threshold with the UK Biobank data, which did not identify any SNPs in a linkage disequilibrium state. The summary statistics for the genetic instrument utilized and variant filters applied is presented in Supplementary material online, Tables S1–S4.
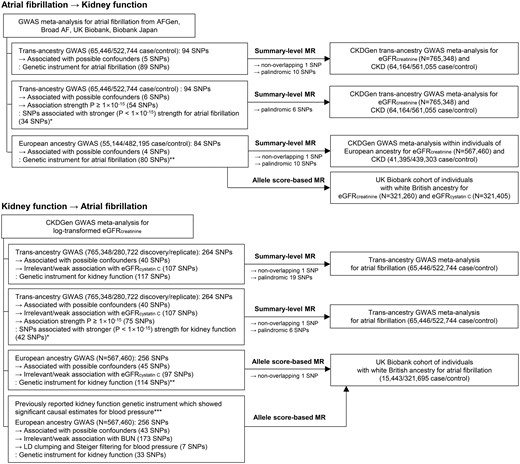
Flow diagram of the performed analysis and construction of the genetic instruments. *The analyses were performed out of concern for the issue of overlapping samples. **The analyses were performed out of concern for the effects from multiethnicity. ***The analysis was performed out of concern for a false-negative bias, and a previously reported genetic instrument that showed significant causal estimates for blood pressure was utilized. GWAS, genome-wide association study; MR, Mendelian randomization; SNP, single-nucleotide polymorphism.
Methods for summary-level MR
Bidirectional MR was first performed with trans-ethnic summary-level data, and the causal estimates between AF and CKD were identified (Figure 1). In the summary-level MR, the variants that were palindromic were excluded during the harmonization of the summary statistics.20 The main MR method was the fixed-effects inverse variance weighted method, and additional sensitivity MR analyses were performed. First, MR-Egger regression, which yields pleiotropy-robust causal estimates, was performed with bootstrapped standard errors.21 The MR-Egger test for directional pleiotropy was performed to detect the presence of a possibility for horizontal pleiotropy. Second, the penalized weighted median method was implemented, which derives valid causal estimates even under conditions when invalid instruments are present.22 Finally, MR-PRESSO was performed, which detects and corrects the effects from outliers, yielding causal estimates that are robust to heterogeneity.23 The summary-level MR analysis was performed by the TwoSampleMR package in R (version 4.0.2, the R foundation).24
Sensitivity analysis for summary-level MR
There was partial overlap in the samples for the two summary statistics implemented in the study (Supplementary material online, Methods), which may potentially cause bias towards confounded observational findings.25 For concerns of such bias, we implemented fewer SNPs with stronger (P < 1 × 10⁻¹⁵) association with the exposure of interests as the genetic instruments, as previously suggested, to inspect whether such an issue may alter the results.25
In addition, regarding concerns of different ethnic distributions in the populations for the previous GWAS meta-analyses, a sensitivity analysis was performed within the data from individuals of European ancestry. This approach also excluded major overlap between the populations of East Asian ethnicity (e.g. Biobank Japan). However, the causal estimates from eGFR to AF within the European ancestry samples were not performed by this summary-level MR, as the summary statistics of the GWAS for AF of individuals of European ancestry was unavailable.
Allele score MR based on individual-level data
To replicate the findings, allele score MR based on individual-level data was performed and the analysis was restricted to data from individuals of European ancestry to decrease the effects of multiethnicity (Figure 1).26 Within the UK Biobank data, the abovementioned 337 138 individuals of white British ancestry passing quality control for genetic information were included. The kidney function outcome was eGFR determined by the CKD-EPI equation based on serum creatinine level, which was available for 321 260 individuals, and CKD outcome was not tested, as the UK Biobank cohort has a very low prevalence of CKD due to healthy volunteer bias.14 We also tested the eGFR based on cystatin C level as the outcome, which was available for 321 405 individuals, as creatinine-based eGFR is affected by external factors, including muscle mass or diet. The AF outcome was collected from the hospital admission records or main causes of death, identified by an ICD-10 diagnostic code of I48 or ICD-9 diagnostic code of 4273.11 We calculated allele scores for exposure by multiplying the gene dosage matrix with the effect sizes of the genetic instrument in GWAS summary statistics within individuals of European ancestry by using PLINK 2.0 (version alpha 2.3).27 The association between genetically predicted eGFR or AF and phenotypical AF or eGFR was tested by linear or logistic regression analysis, adjusted for age, sex, genotype measurement batch, and the first 10 genetic principal components.11
Sensitivity analysis for allele-score-based MR
As genetic instruments explain a portion of a phenotype, false-negative bias is possible in MR, and for kidney function, we implemented a previously reported genetic instrument that showed significant causal effects from kidney function to blood pressure, also from the CKDGen study.28 The genetic instrument similarly included SNPs that were identified from the CKDGen study within individuals of European ancestry. The genetic instrument underwent additional variant filtering considering another alternate kidney function marker, blood urea nitrogen level, and linkage disequilibrium clumping, finally including 33 SNPs to calculate the allele scores for kidney function.
For additional inspection for the attainment of independence and the exclusion-restriction assumptions of MR, we retested the associations between (i) allele scores for AF and eGFR values after excluding those with phenotypical AF and (ii) eGFR-allele scores and AF trait after excluding those with established CKD stages 3–5 (eGFR <60 mL/min/1.73 m2 or self-reported or hospital records for kidney replacement therapy). If a significant association in the main analysis is attenuated in the negative controls, this may suggest that the exposure of interest mediated the identified effects from genetic predisposition. This analysis was performed to support the absence of a horizontal pleiotropic pathway,10 yet, a caution is necessary because of the possibility for a potential collider bias from selection by heritable phenotypes.29
Results
MR results from summary-level data
Of the 94 SNPs for AF in the trans-ancestry GWAS meta-analysis, 78 SNPs remained as the genetic instrument for AF in the summary-level MR after excluding 5 confounder-associated variants, 1 nonoverlapping SNP, and 10 palindromic SNPs (Figure 2). The results showed that genetically predicted AF was significantly associated with an increased risk of CKD and a decreased eGFR, and the causal estimates remained significant with all implemented MR methods (Table 1, Figure 3, and Supplementary material online, Figure S1). The significant causal estimates from AF to kidney function impairment were similarly identified in the sensitivity analysis results by 28 SNPs with stronger (P < 1 × 10⁻¹⁵) association with AF through all implemented MR methods (Supplementary material online, Table S5 and Supplementary material online, Figure S1). Furthermore, when we limited the analysis to the data from individuals of European ancestry, the genetically predicted AF was still significantly associated with an increased risk of CKD and lower eGFR with all implemented MR methods by 69 SNPs (Supplementary material online, Table S6).
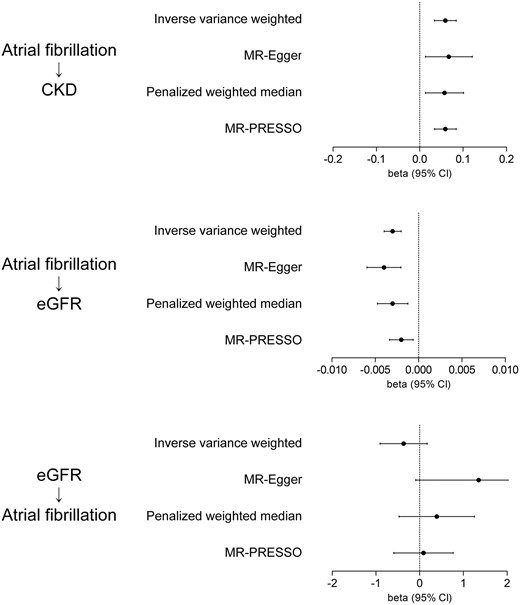
Summary-level Mendelian randomization analysis results. The arrows indicate the tested direction of the causal estimates. The x-axes indicate beta coefficients from the summary-level Mendelian randomization analysis and 95% confidence intervals (±1.96 × standard error). The unit of the summary statistics for atrial fibrillation was towards a relative risk determined by the previous genome-wide association study meta-analysis. The unit for genetical predisposition for estimated glomerular filtration rate was for 1 log-transformed value increase. eGFR, estimated glomerular filtration rate.
Causal estimates from the summary-level data-based Mendelian randomization from the trans-ethnic genome-wide association study summary statistics
| Genetically predicted exposure | Outcome | Cochran’s Q statistics for heterogeneity | MR-Egger pleiotropy test P value | MR method | Beta | Standard error | P-Value |
|---|---|---|---|---|---|---|---|
| Atrial fibrillationa | eGFRb | <0.001 | 0.542 | Inverse variance weighted | −0.003 | 0.0005 | <0.001 |
| MR-Egger | −0.004 | 0.0010 | <0.001 | ||||
| Penalised weighted median | −0.003 | 0.0009 | 0.003 | ||||
| MR-PRESSO | −0.002 | 0.0007 | 0.005 | ||||
| Atrial fibrillationa | CKDb | 0.004 | 0.458 | Inverse variance weighted | 0.059 | 0.0126 | <0.001 |
| MR-Egger | 0.067 | 0.0275 | 0.001 | ||||
| Penalised weighted median | 0.057 | 0.0222 | 0.011 | ||||
| MR-PRESSO | NAc | NAc | NAc | ||||
| eGFRb | Atrial fibrillationa | <0.001 | 0.130 | Inverse variance weighted | −0.366 | 0.275 | 0.183 |
| MR-Egger | 1.349 | 0.734 | 0.038 | ||||
| Penalised weighted median | 0.391 | 0.440 | 0.375 | ||||
| MR-PRESSO | 0.087 | 0.347 | 0.803 |
CKD, chronic kidney disease; eGFR, estimated glomerular filtration rate; MR, Mendelian randomization.
The unit of the summary statistics for atrial fibrillation was towards a relative risk determined by the previous genome-wide association study meta-analysis.
The CKDGen data for eGFR values are log-transformed and based on serum creatinine levels. CKD is defined as eGFR <60 mL/min/1.73 m2.
MR-PRESSO was not performed here, as the MR-PRESSO global test did not identify significant outliers in the genetic instrument, and no correction was necessary. Thus, the causal estimate calculated by MR-PRESSO was the same as that by the inverse variance weighted method.
The genetic instrument for kidney function consisted of 117 SNPs (Figure 2). After additionally disregarding 1 nonoverlapping SNP and 19 palindromic SNPs, the summary-level MR did not show significant causal estimates from kidney function to AF by the inverse variance weighted method (Table 1, Figure 3, and Supplementary material online, Figure S1). The null finding was again identified by utilizing 35 SNPs with a stronger (P < 1 × 10⁻¹⁵) association with eGFR as the genetic instrument (Supplementary material online, Table S5) throughout the inverse variance weighted and sensitivity MR analyses.
Descriptive statistics of the individual-level dataset
Among the 337 138 individuals of white British ancestry in the UK Biobank, the median age was 58 (interquartile range: 51–63) years, including 46.3% males and 53.7% females. The number of individuals with AF was 15 443 (4.6%), and their median eGFR was 92.5 (82.6–99.5) mL/min/1.73 m2. The explained variance in eGFR based on creatinine values was 1.6% (multiple R-squared method) and that in eGFR calculated by cystatin C values was 1.3% by the allele scores for kidney function. The explained variance in AF by the allele scores for AF was 2.4% (McFadden’s pseudo-R square).
MR results from individual-level data
The allele scores for AF based on the genetic instrument developed from the European ancestry population were significantly associated with reduced eGFR, determined either by creatinine or cystatin C levels, in the UK Biobank (Table 2). However, the allele scores for eGFR did not show a significant association with AF outcome. The association was nonsignificant even after we recalculated the allele scores from the previously reported genetic instrument, including 33 SNPs, which previously showed positive findings for blood pressure in the previous MR.
Causal estimates from the individual-level data based Mendelian randomization in the white British individuals of the UK Biobank
| Genetically predicted exposure | Outcome | Beta | Standard error | P-Value |
|---|---|---|---|---|
| Atrial fibrillation | eGFR (creatinine) | −0.079 | 0.021 | <0.001 |
| Atrial fibrillation | eGFR (cystatin C) | −0.079 | 0.027 | 0.004 |
| eGFR (by 113 SNPs)a | Atrial fibrillation | −0.005 | 0.008 | 0.530 |
| eGFR (by 33 SNPs)b | Atrial fibrillation | 0.004 | 0.009 | 0.650 |
CKD, chronic kidney disease; eGFR, estimated glomerular filtration rate; SNPs, single-nucleotide polymorphisms.
Effect sizes of a standard deviation increase in the allele scores are shown. The causal estimates were adjusted for age, sex, genotype measurement batch, and the first 10 principal components of the genetic information in the UK Biobank data.
The genetic instrument included SNPs showed genome-wide significant association with log-eGFR in the CKDGen data, also with strong/relevant association with eGFR (cystatin C) level in the UK Biobank data, and not associated with potential confounders.
The genetic instrument included SNPs showed genome-wide significant association with log-eGFR in the CKDGen data, also with strong/relevant association with blood urea nitrogen in the CKDGen data, not associated with potential confounders, and passing additional filtering (e.g. Steiger filtering for blood pressure traits).
The significant associations between genetic predisposition for AF and eGFR traits were attenuated after excluding individuals with AF, implying that the phenotypical AF possibly mediated the association (Supplementary material online, Table S7). When we excluded those with established CKD stage 3–5, the association between genetic predisposition for eGFR and phenotypical AF remained nonsignificant.
Discussion
In this MR analysis, significant causal effects from AF to kidney function impairment were demonstrated by utilizing the largest GWAS results to date for AF and kidney function. On the other hand, genetically predicted kidney function was nonsignificantly associated with AF, although the genetic instrument for eGFR explained similar variance as the genetic instrument for AF. Our study suggests that AF causally aggravates kidney function, but a direct effect of kidney function on AF remains uncertain.
A close association between CKD and AF has been repeatedly reported by observational studies.5–7 , 9 , 30 As the burden of CKD and AF will increase in the future along with the aging population, treatment of AF in CKD patients has been an important issue because appropriate anticoagulation may be different in the CKD population compared to those without kidney function impairment.31 Moreover, other studies focused on the bidirectional relationship between CKD and AF, and the diseases were suspected to concurrently increase the risk of one another.5–9 However, assessment of direct causality between CKD and AF was difficult, as undiagnosed AF or CKD is possible,32 , 33 the disorders share many risk factors raising the concerns of confounding, and the issue of reverse causality cannot be disregarded in observational studies.
In this study, we assessed the bidirectional causal effect between CKD and AF by implementing MR analysis. As MR tests the effect of genetic predisposition to exposure, which precedes any confounders or outcome occurrence, it can demonstrate causal effects but requires that three assumptions are met.10 First, the relevance assumption, meaning that the genetic instrument should be strongly associated with the exposure of interest, was fulfilled by the previous GWAS meta-analysis, which robustly provided the genetic variants with strong association with the exposures. Second, the restriction-exclusion assumption means that the effect should be through the exposure of interest. Although a direct test for this assumption is impossible, the weighted median method relaxes this assumption for a portion of the instruments, serving as a sensitivity analysis. In addition, our investigation in those without phenotypical AF supported that a horizontal pleiotropic pathway may not be present. Third, the independence assumption means that the genetic variant in the instrument should not affect the outcome through a confounder. We performed multiple pleiotropy-robust MR methods and disregarded variants that might have horizontal pleiotropic effects on our results.21–23 Thus, by performing extensive MR analysis, our study suggested that AF causally increases the risk of kidney function impairment; on the other hand, the causal effects from kidney function on AF were nonsignificant.
The clinical application of our study is suggested below. First, as AF is a causal risk factor for CKD, appropriate management of AF may lead to reduced risks of kidney function impairment. Thus, a future clinical trial may assess kidney function outcomes when performing interventions for AF, which previous studies reported related evidences.34 , 35 Second, as AF is a causal factor for CKD, clinicians may perform early screening for AF in CKD patients.32 In particular, those with common risk factors for AF or elderly patients may be the target group that warrants such a strategy, and such early diagnosis may lead to a reduced risk of progression of kidney function impairment. Third, clinicians may monitor kidney function in AF patients because they bear a burden of increased risk of CKD due to the presence of AF.
Explanation of the mechanism of the identified causal effects can be suggested by the current literature. Decreased cardiac output by AF causes systemic congestion,36 , 37 which would cause an increase in kidney venous pressure, further leading to a reduction in kidney perfusion pressure, which is the difference between kidney arterial and venous pressure. As kidney perfusion pressure is a major determinant of glomerular filtration rate, such impaired glomerular perfusion due to AF would cause kidney function impairment.38 In addition, chronic neurohormonal activation caused by AF, including upregulation of the renin–angiotensin–aldosterone system,39 may also adversely affect kidney function if it persists. In addition, thromboembolism may be caused by AF, leading to kidney infarcts; however, this may not be a general etiology for the causal effects identified through this MR investigation, considering the relatively low prevalence of kidney infarction.40
That kidney function did not show significant causal effects on AF should be interpreted with caution. Our study suggests that effects from AF to CKD may be prioritized over effects in the reverse direction in the general population. However, as the genetic instrument explains a portion of a phenotype, the possibility remains that kidney function may have a modest degree of effect on AF. In addition, as we tested the effects mostly from mild-to-moderate CKD, the cardiovascular effects from severe kidney failure or acute kidney injury may be different from the current findings. Moreover, as CKD and AF share risk factors, certain CKD events would still precede AF.30 However, considering that kidney function also did not show significant causal effects on heart failure in a previous study implementing MR,41 the direct effect of kidney function on AF or heart failure would be smaller than those of other important causal factors for AF.
There are several limitations in this study. First, there was overlap in samples in genetic instrument development and outcome assessment in certain MR investigations, which may cause bias towards observational findings.25 That we performed sensitivity analysis in concerns of such issue, including fewer but stronger SNPs, and replicated results in different outcome data may decrease the possibility of false-positive findings, yet the potential bias should be carefully inspected in MR investigations with summary statistics from large-scale genetic consortia. Second, although the causal effects from AF to CKD were demonstrated, whether the risk of kidney function impairment can actually be reduced through management of AF should be assessed in a future trial. Third, as genetic analysis is weak for detecting nonlinear effects and provides qualitative rather than quantitative information,42 the clinical effects may be different from the effect sizes of our genetic analysis. Particularly, the magnitude of the effects from paroxysmal AF and from persistent AF on kidney function may have certain differences. Fourth, the remaining possibility of the effects from shared risk factors for AF and CKD may be present, as causal estimates with a binary exposure, AF in our study, may represent the average causal effects from disease liability.43 Lastly, the study population included mainly individuals of European ancestry, and in the multiethnic analysis, consideration of the difference in ethnic diversity was limited due to data availability. A further study limiting the analysis to other ethnic populations may be helpful in confirming the generalizability of the results.
In conclusion, this study supports that AF is a causal risk factor for kidney function impairment. Clinicians may pay attention to AF in CKD patients and monitor kidney function in those with AF. A further study may consider whether appropriate management of AF may lead to a decreased risk of kidney function impairment.
Supplementary material
Supplementary material is available at European Heart Journal online.
Acknowledgements
The study was based on the data provided by the UK Biobank consortium (application No. 53799), the CKDGen consortium, and the Cardiovascular Disease Knowledge Portal. We thank the investigators who provided valuable genetic summary statistics for this study.
Funding
This work was supported by the Industrial Strategic Technology Development Program—Development of bio-core technology (10077474, Development of early diagnosis technology for acute/chronic renal failure) funded by the Ministry of Trade, Industry & Energy (MOTIE, Korea). The study was performed independently by the authors.
Data availability
The data underlying this article were accessed from the CKDGen consortium (URL: https://ckdgen.imbi.uni-freiburg.de/) and the Cardiovascular Disease Knowledge Portal (URL: https://www.broadcvdi.org/). The UK Biobank data for this study will be made available in the UK Biobank consortium (https://biobank.ctsu.ox.ac.uk, last accessed 7 May 2021).
Conflict of interest: none declared.
References

