


Abstract
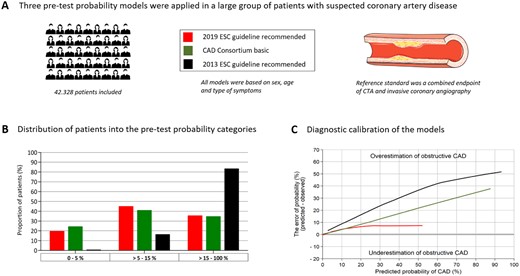
Estimation of pre-test probability (PTP) of disease in patients with suspected coronary artery disease (CAD) is a common challenge. Due to decreasing prevalence of obstructive CAD in patients referred for diagnostic testing, the European Society of Cardiology suggested a new PTP (2019-ESC-PTP) model. The aim of this study was to validate that model.
Symptomatic patients referred for coronary computed tomography angiography (CTA) due to suspected CAD in a geographical uptake area of 3.3 million inhabitants were included. The reference standard was a combined endpoint of CTA and invasive coronary angiography (ICA) with obstructive CAD defined at ICA as a ≥50% diameter stenosis or fractional flow reserve ≤0.80 when performed. The 2019-ESC-PTP, 2013-ESC-PTP, and CAD Consortium basic PTP scores were calculated based on age, sex, and symptoms. Of the 42 328 identified patients, coronary stenosis was detected in 8.8% using the combined endpoint. The 2019-ESC-PTP and CAD Consortium basic scores classified substantially more patients into the low PTP groups (PTP < 15%) than did the 2013-ESC-PTP (64% and 65% vs. 16%, P < 0.001). Using the combined endpoint as reference, calibration of the 2019-ESC-PTP model was superior to the 2013-ESC-PTP and CAD Consortium basic score.
The new 2019-ESC-PTP model is well calibrated and superior to the previously recommended models in predicting obstructive stenosis detected by a combined endpoint of CTA and ICA.
See page 1412 for the editorial comment on this article (doi: )
Introduction
Estimation of disease probability in patients with stable symptoms suggestive of coronary artery disease (CAD) is a frequent challenge. Approximately 1% of all contacts with general practitioners are related to chest discomfort, and millions of diagnostic CAD tests are performed worldwide.1 Because the disease prevalence is relatively low, the majority of these tests is normal.2 The European guideline has therefore recommend the performance of pre-test probability (PTP) estimations to guide decisions on whether diagnostic testing should be deferred or conducted and whether the initial test should be non-invasive or invasive.3
Traditionally, PTP tables based on sex, age, and type of symptoms have been used.4 The coefficients from the original Diamond–Forrester model from 1979 were updated in 2011 and this model (2013-ESC-PTP) was recommended in the 2013 European Society of Cardiology (ESC) guidelines.5 However, these tables are known to overestimate the PTP when used in contemporary patient cohorts.5–7
In 2012, the CAD Consortium proposed an updated basic model that included the same variables as the Diamond–Forrester PTP tables. The CAD Consortium basic model was calibrated to an endpoint of CAD based on invasive coronary angiography (ICA).8 However, the CAD Consortium model requires computed calculation of PTP and is infrequently used in the clinical setting.
The ESC guidelines published in 2019 a new PTP table (2019-ESC-PTP) based on the observed prevalence of coronary stenoses in a pooled analysis of three large studies: the CONFIRM study, the PROMISE study, and a study by Reeh et al.3 , 9–12
In the study by Reeh et al., the reference standard for CAD was ICA. In contrast, the definition of CAD in the CONFIRM and PROMISE studies was a 50% diameter stenosis at coronary computed tomography angiography (CTA). It is well known that coronary CTA overestimates the prevalence of obstructive CAD compared to invasive anatomical and functional measurements.
The calibration of this new basic 2019-ESC-PTP model and its ability to discriminate CAD have not previously been investigated in large-scale populations. Furthermore, no study has investigated the external validity of the model compared to established PTP models such as the 2013-ESC-PTP and CAD Consortium basic models.
The aim of this study was, therefore, to investigate the performance of the new 2019-ESC-PTP model in a large real-world cohort. In the present analysis, we used a combined endpoint of CTA and ICA as a reference standard. In addition, we studied the performance of the model when coronary CTA alone was used as a reference.
Methods
Study population
This cohort study was conducted using a Danish population-based quality assurance database, the Western Denmark Heart Registry (WDHR), from which we identified all patients who underwent first-time coronary CTA from 2008 to 2017 at 13 hospitals in the western part of Denmark (uptake area 3.3 million; 55% of the total Danish population). The cohort of interest comprised all adult patients without previously documented CAD.
Eligible patients were typically referred to outpatient clinics by general practitioners due to symptoms suggestive of chronic coronary syndrome. Adult patients with clinically relevant symptoms underwent a basic clinical workup including echocardiography and were referred to coronary CTA. In patients with more than one coronary CTA, only the primary test was used in the current analysis. Patients with missing information regarding the CTA result or chest pain symptoms were excluded (Figure 1 and Supplementary material online, Table S1). We excluded patients with myocardial infarction or death occurring within 120 days after the coronary CTA procedure. This was due to the potential that patient was referred for ICA after the coronary CTA, but this was not performed due to death or the coronary status was altered due to myocardial infarction.
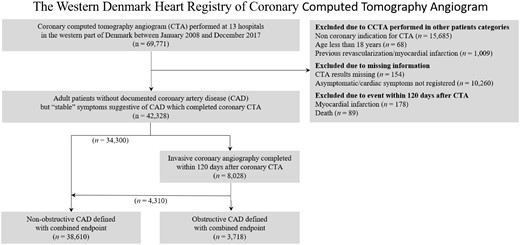
Flow diagram of the included patients. Stenosis at coronary computed tomography angiography was diagnosed in 23.6% and 8.8% of the population was diagnosed as having obstructive coronary artery disease based on the combined endpoint of computed tomography angiography and invasive coronary angiography.
The mandatory WDHR contains information on all coronary CTAs and ICAs performed in the western part of Denmark.13 The investigating cardiologist is responsible for the reporting of baseline characteristics and the coronary CTA and ICA results to the database. We used data regarding age, sex, symptom characteristics, and smoking from the WDHR. Data regarding diabetes, hypertension, dyslipidaemia, ICA findings, and revascularization procedures were based on information from (i) the WDHR, (ii) the National Patient Registry (information on all hospital/outpatient diagnoses, tests, and procedures performed in Denmark), or (iii) the Danish National Health Service Prescription Database (information on reimbursed medical prescriptions at all Danish pharmacies).13 The study was approved by the Danish Data Protection Agency (ID 2014-54-0922).
Age, sex, and symptom characteristics were used to calculate 2019-ESC-PTP, 2013-ESC-PTP, and CAD Consortium basic PTP scores.5 , 8 , 12
Coronary computed tomography angiography
Coronary CTA was performed according to the standard clinical practice. The examinations were performed using a variety of CT scanners with a minimum of 64 detector rows. Results of the coronary CTA were analysed locally and reported to the WDHR. No CAD was defined as no coronary artery calcium and no suspected stenosis. Stenosis suspected at coronary CTA was defined as a ≥50% diameter reduction in any coronary segment.
Invasive coronary angiography
We used a post-coronary CTA 120-day window to categorize patients as to whether an ICA or revascularization had been performed in connection with the CTA. ICA was performed according to the standard clinical practice. Fractional flow reserve (FFR) measurements were performed at the discretion of the investigating cardiologist. Results from the ICA were analysed locally and reported to the WDHR. The combined endpoint of obstructive CAD was based on information from the coronary CTA and ICA. Obstructive CAD was defined at ICA as a ≥50% diameter stenosis in any coronary segment or FFR ≤0.80 when performed. Non-obstructive disease was defined as no obstructive CAD at ICA or if obstructive CAD was ruled out by non-invasive imaging and no ICA was performed within 120 days after coronary CTA.
Statistical analyses
Continuous variables are presented as mean (± standard deviation), median [interquartile range], and categorical variables as n (%). Calibration and discrimination of the PTP scores were evaluated according to current recommendations.14 First, a calibration plot of the mean predicted probability and the mean observed proportion of minimal risk with flexible calibration (Loess bandwidth 0.8) were evaluated. The discrimination included area under the receiver-operator curve (AUC) and categorized net reclassification index with pre-specified cut-offs of 5%, 15%, and 50%. Significance between differences in AUC was estimated using DeLong et al. method. Binary diagnostic performance was evaluated by sensitivity and specificity, positive and negative predictive values, and likelihood ratios. Statistical analysis was performed using STATA-16 StataCorp, USA.
Results
A total of 42 328 patients without previously documented CAD, but with symptoms suggestive of obstructive CAD, were included (Figure 1). Baseline demographics of the included patients and the coronary CTA results are presented in Table 1. Distribution of patients and the prevalence and severity of CAD in subgroups according to sex, age, and symptom strata are presented in Figure 2.
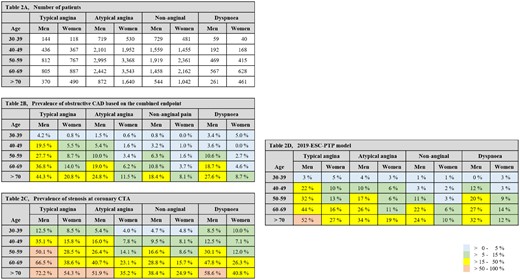
Number of patients in each subgroup in the Western Denmark Heart Registry (A), the obstructive coronary artery disease at the combined endpoint (B) and the prevalence of stenosis at coronary computed tomography angiography (C) and according to the outlined subgroups. The predicted pre-test probability table in 2019 European Society of Cardiology guidelines for the diagnosis and management of chronic coronary syndromes is presented for comparison (D).
Baseline characteristics of included patients and the results of coronary computed tomography angiography and invasive coronary angiography preformed within 120 days of the coronary computed tomography angiography
| All patients | |
|---|---|
| Number of patients | 42 328 (100) |
| Characteristics | |
| Sex, male | 19 453 (46.0) |
| Age (years) | 57.3 ± 11.3 |
| <40 | 2820 (6.7) |
| 40 to <50 | 8230 (19.4) |
| 50 to <60 | 13 106 (30.1) |
| 60 to <70 | 12 492 (29.5) |
| ≥70 | 5680 (13.4) |
| Smoking | |
| Never | 16 513 (39.0) |
| Former | 13 874 (32.8) |
| Active | 8927 (21.1) |
| Missing | 3014 (7.1) |
| Hypercholesterolaemia | 14 966 (35.4) |
| Hypertension | 19 782 (46.7) |
| Diabetes | 3718 (8.8) |
| Symptoms | |
| Typical chest pain | 5196 (12.3) |
| Atypical chest pain | 20 162 (47.6) |
| Non-specific chest pain | 13 710 (32.4) |
| Dyspnoea | 3260 (7.7) |
| Pre-test probability models | |
| 2019-ESC-PTP model | 11% [6–19] |
| 2013-ESC-PTP model | 30% [18–48] |
| CAD Consortium basic PTP model | 10% [5–20] |
| Coronary computed tomography angiography | |
| Coronary artery calcium scorea | 0 [0–83] |
| Disease severity | |
| No CAD (no coronary calcium or stenosis) | 19 544 (46.2) |
| Non-obstructive CAD (diameter stenosis <50%) | 12 769 (30.2) |
| Coronary stenosis (diameter stenosis ≥50%) | 10 015 (23.6) |
| Invasive coronary angiography and revascularization | |
| Invasive coronary angiography | 8028 (19.0) |
| Disease severity | |
| Obstructive coronary CAD (diameter stenosis ≥50% and/or FFR < 0.8) | 3718 (8.8) |
| Revascularization | |
| Percutaneous coronary intervention | 1985 (5.2) |
| Coronary artery bypass grafting | 635 (1.6) |
Values are n (%) or mean ± SD or median [interquartile range].
CAD, coronary artery disease; ESC, European Society of Cardiology; FFR, fractional flow reserve; PTP, pre-test probability; SD, standard deviation.
Coronary artery calcium score was missing in 6.7% of the patients.
In our cohort, the calculated median 2019-ESC-PTP for obstructive CAD at coronary CTA was 11% [IQR: 6.0–19.0]. The correlation between the 2019-ESC-PTP, the 2013-ESC-PTP, and the CAD Consortium basic scores is illustrated in Supplementary material online, Figure S1. The 2019-ESC-PTP and CAD Consortium model classified significantly more patients in the low probability group (PTP <15%) than the 2013-ESC-PTP model (64.5% and 65.3% vs. 16.7%, P < 0.001). In contrast, fewer patients were classified in the PTP subgroup <5% with the 2019-ESC-PTP compared to the CAD Consortium basic score (19.5% vs. 24.3%, P < 0.001).
Pre-test probability when a combined endpoint was used as a reference standard
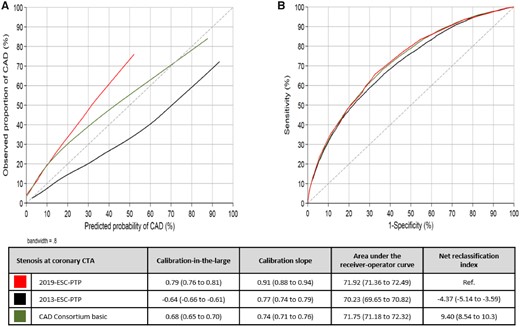
Of the total cohort, obstructive CAD using a combined endpoint of CTA and ICA was diagnosed in 3718 (8.8%) patients and ruled out in 38 610 (91.2%) patients (Supplementary material online, Table S2). Calibration plots and statistics of the PTP models are outlined in Figure 3. Sex- and age-specific calibration is illustrated in Supplementary material online, Figure S2. With the 2019-ESC-PTP model, there was a small overestimation of the prevalence of obstructive CAD in all patients regardless of the PTP. Similarly, the CAD Consortium basic model overestimated the CAD probability, most markedly in higher PTP groups. The 2013-ESC-PTP substantially overestimated the prevalence of obstructive CAD in all patients regardless of the PTP (Take home figure).
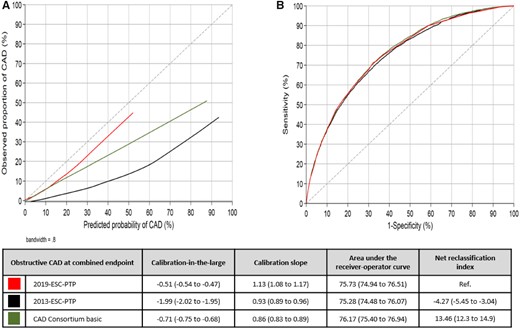
Calibration plot (A) and receiver-operator curve (B) for the three pre-test probability models compared to a reference of the combined endpoint. Perfect calibration should be on the ideal line in a calibration plot, described with an intercept alpha of 0 (calibration-in-the-large) and a slope beta of 1 (calibration slope). Discrimination is tested with area under the receiver-operator curve and categorized net reclassification index using cut-off of 5%, 15%, and 50%. Values are presented with 95% confidence interval.
Validation and comparison of three pre-test probability estimation models for obstructive coronary artery disease. All models were based on sex, age, and type of symptoms and the reference standard was a combined endpoint of computed tomography angiography and invasive coronary angiography. The new 2019 ESC pre-test probability model was found to be well calibrated and superior to the previously recommended models in predicting obstructive coronary artery disease.
Discrimination measured with AUC was similar in all models. Compared to the other models, the 2019-ESC-PTP model, AUC 75.7 (74.9–76.5), had slightly higher accuracy than the 2013-ESC-PTP model, AUC 75.3 (74.5–76.1) (P < 0.05), and slightly lower accuracy than the CAD Consortium basic model, AUC 76.2 (75.4–76.9) (P < 0.01) (Figure 3).
Net reclassification indices using cut-offs 5%, 15%, and 50% with the 2019-ESC-PTP model as reference were −4.27 (−5.45 to −3.04) and 13.46 (12.3 to 14.9) for the 2013-ESC-PTP and the CAD Consortium basic models, respectively (Figure 3, Supplementary material online, Tables S3 - S6).
Diagnostic parameters of binary classification of the models using 5% and 15% cut-offs are presented in Table 2. Distribution of the patients in the five PTP categories and sensitivity and specificity plots are illustrated in Figure 4.
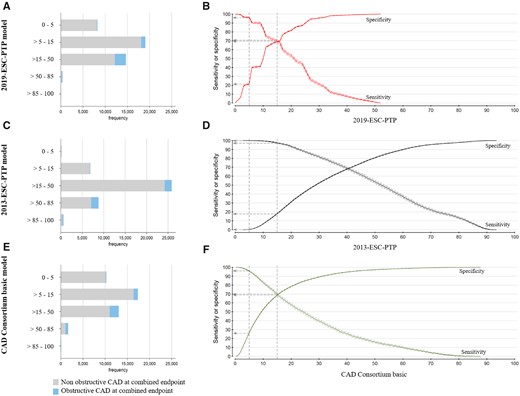
Distribution of the patients in the five pre-test probability categories and sensitivity and specificity plots for the three pre-test probability models based on the combined endpoint as a reference standard. Bars (A–C) and sensitivity plot (D–F) are shown according to the three pre-test probability models. The dotted lines represent a cut-off for 5% and 15%, and the vertical arrows present the sensitivity and specificity at these cut-offs.
The pre-test probability models diagnostic accuracy at cut-offs of 5% and 15%, with coronary stenosis at coronary computed tomography angiography and combined endpoint of computed tomography angiography and invasive coronary angiography as reference standard
| 2019-ESC-PTP model | 2013-ESC-PTP model | CAD Consortium basic model | |
|---|---|---|---|
| Pre-test probability cut-off <5% | |||
| Number of patients below cut-off | 8245 (19.5%) | 178 (0.4%) | 10 265 (24.3%) |
| Coronary CTA | |||
| Number of diseased patients below cut-off | 625 | 7 | 856 |
| Sensitivity | 93.8% (93.3–94.2) | 99.9% (99.9–100) | 91.5% (90.9–92.0) |
| Specificity | 23.6% (23.1–24.0) | 0.5% (0.5–0.6) | 29.1% (28.6–29.6) |
| Positive predictive value | 27.6% (27.1–28.0) | 23.7% (23.3–24.2) | 28.6% (28.1–29.1) |
| Negative predictive value | 92.4% (91.8–93.0) | 96.1% (92.1–98.4) | 91.7% (91.1–92.2) |
| Positive likelihood ratio | 1.23 (1.22–1.24) | 1.00 (1.00–1.01) | 1.29 (1.28–1.30) |
| Negative likelihood ratio | 0.26 (0.24–0.29) | 0.13 (0.06–0.28) | 0.29 (0.27–0.31) |
| Combined endpoint of CTA and ICA | |||
| Number of diseased patients below cut-off | 132 | 0 | 151 |
| Sensitivity | 96.4% (95.8–97.0) | 100% (99.9–100) | 95.9% (95.3–96.6) |
| Specificity | 21.0% (20.6–21.4) | 0.5% (0.4–0.5) | 26.2% (25.8–26.6) |
| Positive predictive value | 10.5% (10.2–10.9) | 8.8% (8.6–9.1) | 11.1% (10.8–11.5) |
| Negative predictive value | 98.4% (98.1–98.7) | 100% (97.9–100) | 98.5% (98.3–98.8) |
| Positive likelihood ratio | 1.22 (1.21–1.23) | 1.00 (1.00–1.01) | 1.30 (1.29–1.31) |
| Negative likelihood ratio | 0.17 (0.14–0.20) | Na | 0.29 (0.27–0.31) |
| Pre-test probability cut-off <15% | |||
| Number of patients below cut-off | 27 280 (64.5%) | 7062 (16.7%) | 27 625 (65.3%) |
| Coronary CTA | |||
| Number of diseased patients below cut-off | 4037 | 558 | 4156 |
| Sensitivity | 59.7% (58.7–60.7) | 94.4% (94.0–94.9) | 58.5% (57.5–59.5) |
| Specificity | 71.9% (71.4–72.4) | 20.1% (19.7–20.6) | 72.6% (72.1–73.1) |
| Positive predictive value | 39.7% (38.9–40.5) | 26.8% (26.4–27.3) | 39.8% (39.1–40.6) |
| Negative predictive value | 85.2% (84.8–85.6) | 92.1% (91.4–92.7) | 85.0% (84.5–85.4) |
| Positive likelihood ratio | 2.13 (2.08–2.18) | 1.18 (1.17–1.19) | 2.14 (2.09–2.19) |
| Negative likelihood ratio | 0.56 (0.55–0.57) | 0.28 (0.25–0.30) | 0.57 (0.56–0.59) |
| Combined endpoint of CTA and ICA | |||
| Number of diseased patients below cut-off | 1070 | 97 | 1120 |
| Sensitivity | 71.2% (69.7–72.7) | 97.4% (96.8–97.9) | 69.9% (68.4–71.3) |
| Specificity | 67.9% (67.4–68.3) | 18.0% (17.7–18.4) | 68.6% (68.2–69.1) |
| Positive predictive value | 17.6% (17.0–18.2) | 10.3% (10.0–10.6) | 17.7% (17.1–18.3) |
| Negative predictive value | 96.1% (95.8–96.3) | 98.6% (98.3–98.9) | 95.9% (95.7–96.2) |
| Positive likelihood ratio | 2.22 (2.16–2.27) | 1.19 (1.18–1.20) | 2.234 (2.17–2.29) |
| Negative likelihood ratio | 0.42 (0.40–0.45) | 0.14 (0.12–0.18) | 0.44 (0.42–0.46) |
Values are percentages (%) or ratios.
CTA, computed tomography angiography; ICA, invasive coronary angiography.
Pre-test probability when coronary computed tomography angiography alone is used as a reference standard
Suspected stenosis at coronary CTA was present in 10 015 (23.7%) patients and stenosis was ruled out in 32 313 (76.3%) patients (Supplementary material online, Table S2). Calibration plots and statistics of the three PTP models are outlined in Figure 5. The 2019-ESC-PTP model underestimated the prevalence of coronary stenosis at all PTP levels. In patients with low-to-intermediate PTP, the CAD Consortium model similarly underestimated the actual presence of coronary stenosis at coronary CTA. However, in patients with high PTP, the calibration was good for the CAD Consortium basic model. The 2013-ESC-PTP model overestimated the prevalence of stenosis at coronary CTA at all PTP levels.
Calibration plot (A) and receiver-operator curve (B) for the three pre-test probability models compared to a reference of the computed tomography angiography results.
Discrimination measured by AUC showed moderate accuracy of the 2019-ESC-PTP model, AUC 71.9 (71.4–72.5) (Figure 5). The 2019-ESC-PTP model was more accurate than the 2013-ESC-PTP model, AUC 70.2 (69.7–70.8) (P < 0.001), and had similar accuracy compared to the CAD Consortium basic model, AUC 71.8 (71.2–72.3 (P = 0.16).
Net reclassification indices using cut-offs 5%, 15%, and 50% with the 2019-ESC-PTP model as reference were −4.37 (−5.14 to −3.59) and 9.40 (8.54 to 10.3) for the 2013-ESC-PTP and the CAD Consortium basic models, respectively (Figure 5, Supplementary material online, Tables S3 - S6).
Diagnostic parameters of binary classification of the models using 5% and 15% cut-offs are presented in Table 2. Distribution of the patients in the five PTP categories and sensitivity and specificity plots are illustrated in Figure 6.
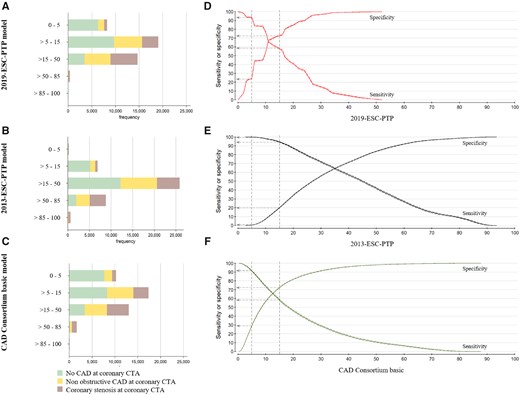
Distribution of the patients in the five pre-test probability categories and sensitivity and specificity plots for the three pre-test probability models based on the computed tomography angiography results as a reference standard. Bars (A–C) and sensitivity plot (D–F) are shown according to the three pre-test probability models. The dotted lines represent a cut-off for 5% and 15%, and the vertical arrows present the sensitivity and specificity at these cut-offs.
Discussion
Using a large real-world cohort, this study is the first to externally validate the calibration and diagnostic performance of the new 2019-ESC-PTP model proposed in the 2019 ESC guidelines for the diagnosis and management of chronic coronary syndrome.3 We demonstrated that, in relation to the combined endpoint of CTA and invasive measurements, the 2019-ESC-PTP model had a very good calibration with only minor overestimation of the prevalence of obstructive CAD.
The 2019-ESC-PTP model clearly outperformed the previously proposed 2013-ESC-PTP model with a substantial down-classification of the PTP score. Compared to the CAD Consortium basic model, which has the inconvenience of requiring computer calculation, the 2019-ESC-PTP model showed similar calibration in the majority of the patients with low-to-intermediate PTP of CAD but was better calibrated to combined endpoint in the higher PTP range. More patients were down-classified to PTP <5% with the CAD Consortium basic model than with the 2019-ESC-PTP model.
When the 2019-ESC-PTP model was compared against coronary CTA alone, the model underestimated the prevalence of suspected coronary stenosis. This is not surprising as it is well known that CTA overestimates the severity of obstructive CAD. The combined endpoint of CTA and invasive measurements allowed both accurate exclusion of obstructive CAD and confirmation of truly obstructive disease that is more likely leading to revascularization.
2019-ESC-PTP model
The 2019-ESC-PTP model reflects the probability of obstructive CAD in 15 815 symptomatic patients with chest pain and 1743 symptomatic patients with dyspnoea in a pooled analysis of three studies: the PROMISE (n = 4415), the CONFIRM (n = 8106), and the study by Reeh et al. (n = 3294).9–11 In the PROMISE and CONFIRM populations, coronary CTA was used as reference standard, while Reeh et al. used an endpoint of invasive tests. Therefore, the superior match between the 2019-ESC-PTP models with the combined endpoint than with the CTA results in this study is unexpected. The explanation may be related to patient characteristics, referral bias, and/or definition of CAD. However, in the three study cohorts used in the 2019-ESC-PTP estimations, the mean age (range 58–61 years) and sex distribution (men included, range 44–49%) were similar to our cohort. The overall prevalence of disease at coronary CTA in the subgroup of patients with chest pain and dyspnoea was 14.9% and 16.8%, which is lower compared to the two subgroups in our cohort (23.0% and 31.1%, respectively).
The PROMISE trial is a randomized multicentre study from North America including symptomatic outpatients without previously diagnosed CAD.9 Additional inclusion criteria were age above 54 years in men or above 64 years in women. Inclusion of younger patients required presence of at least one risk factor for CAD. Coronary stenosis, defined as diameter narrowing ≥50% by a core laboratory, was found in 13.9% of the participants. In contrast to the core laboratory analysis, the study sites reported disease at coronary CTA in 10.7%. However, disease at the study sites was defined as a ≥70% diameter stenosis in a major coronary vessel or a ≥50% diameter stenosis in the left main coronary artery. In our cohort, we did not have core laboratory analysis or data regarding ≥70% diameter stenosis that would enable a direct comparison of prevalence of a severe stenosis in the two cohorts. However, within 90 days, revascularization was performed in 6.2% in the PROMISE coronary CTA group, which is in line with the revascularization rate in our study (6.8%). Inclusion criteria and selection bias are of concern in multicentre studies, but the overall revascularization rate was similar in our cohort despite a difference in the prevalence of stenoses on coronary CTA. Hence, core laboratory analyses may be slightly different than real-world analyses of coronary CTA.
The study by Reeh et al.10 was a single-centre study performed independently from the present study in the Eastern part of Denmark. Clinical data were retrospectively collected from electronic health records. Obstructive CAD was defined from ICA as >70% stenosis of any epicardial vessel or 50–70% stenosis with an FFR of <0.8 or any lesion that was revascularized. Of the three studies, this study had the lowest prevalence of CAD (7.4%). However, no data were published regarding the prevalence of CAD in the coronary CTA subgroup alone or at other cut-off values for stenosis at ICA.
The CONFIRM registry included patients with a clinical indication of coronary CTA.11 Similar to our cohort, it was restricted to patients with suspected but without known CAD. In addition, the presence of coronary stenosis was defined as diameter narrowing ≥50% at coronary CTA assessed by the local site. Hence, the CONFIRM study had most similarities to the present study and also the study with the highest prevalence of coronary stenosis (18.4%) of the three cohorts included in the 2019-ESC-PTP model.
Recently, the 2019-ESC-PTP model was tested in the SCOT-Heart study CTA arm including 1613 patients.15 This study defined coronary stenosis as >70% diameter stenosis in a major epicardial vessel or >50% in the left main stem assessed by at least two assessors. Despite these strict criteria for coronary stenosis at CTA, the 2019-ESC-PTP model tended to slightly underestimate disease prevalence in this small cohort.
In summary, it seems plausible that the reference standard of CAD and use of core laboratory analysis might have reduced the prevalence of CAD seen in the 2019-ESC-PTP cohorts resulting in a better match with the combined endpoint of CTA and invasive measures as compared to coronary CTA alone as a reference in our real-world validation cohort.
Reference standards for pre-test probability models
Several PTP models have been developed for patients with symptoms suggestive of obstructive CAD.4 , 5 , 8 Classic models use reference values of 50% or 70% diameter stenosis at ICA, and these values have been used as cut-offs for revascularization procedures. To some degree, these cut-offs have previously been shown to predict the presence of reduced myocardial perfusion which drives patient symptomatology. However, when PTP models are validated using a myocardial perfusion imaging test as reference, model calibration is poor.
In contrast to obstructive CAD, a reference of no CAD at coronary CTA and no events during follow-up may identify patients without need for medical preventive treatment or revascularization. The PROMISE minimal risk tool uses this reference standard and identifies patients unlikely to benefit from diagnostic testing. This subgroup of individuals represents ∼50% of patients currently undergoing diagnostic testing. To date, the clinical utility of this model is uncertain.
Finally, a reference standard of suspected CAD at coronary CTA identifies patients who will likely benefit from preventive treatment and further downstream diagnostic testing.7
Clinical interpretation
The current study provides important information to clinicians regarding the 2019-ESC-PTP model, which appears to be closely calibrated to the observed prevalence of obstructive CAD defined by a combined endpoint of CTA and invasive measurements in our population.
The 2019-ESC-PTP model substantially down-classifies the PTP compared to earlier models used in the guidelines. As the majority of patients is classified into groups with <15% PTP, additional variables are needed to increase discrimination. This was also suggested by the Task Force of the new ESC guidelines by introducing the novel concept of Clinical Likelihood of CAD as a more comprehensive assessment of disease probability. The idea is that adding risk factors to a basic ‘age-gender-symptoms’ model will improve models for the identification of CAD.7 , 8
Nonetheless, using a 5% cut-off for no further downstream testing, the 2019-ESC-PTP model had a sensitivity of 94% and 96% and a negative predictive value of 92% and 98% for obstructive CAD at the combined endpoint, respectively. Applying 5% as a cut-off to the present validation cohort would have led to the deferral of 20% of the patients from diagnostic testing.
Limitations
Our study included a large real-world cohort of symptomatic patients from all hospitals in Western Denmark. Inherent to the observational design, there is a risk of referral and selecting bias. Patients were mainly excluded because coronary CTA was performed based on another indication than suspicion of coronary atherosclerosis or the fact that information on chest pain symptoms was lacking. However, the lack of information on symptoms did not alter the prevalence of risk factors and disease prevalence was only slightly lower and therefore did not indicate that this impacted the study results.
Conclusion
In this large real-world cohort, the 2019-ESC-PTP model was nicely calibrated to the prevalence of obstructive CAD detected by a combined endpoint of CTA and invasive measurements. When compared to other predictive models for CAD, the CAD Consortium basic model overestimated the prevalence of obstructive CAD when the combined endpoint was used as a reference for CAD. The 2013-ESC-PTP model markedly overestimated the prevalence of CAD. Discrimination was stable across the models regardless of reference standard (AUC difference <2%).
The benefit of the table-based 2019-ESC-PTP as compared to other models is that no computer calculations are needed. However, further studies are needed to clarify the clinical impact of the novel concept of Clinical Likelihood of CAD, which aims to provide more comprehensive and individualized assessment of disease probability.
Data availability
The data underlying this article were provided by Western Denmark Heart Registry steering commitee. Data can be shared on request to the corresponding author with permission of the Western Denmark Heart Registry steering commitee and the Danish Data Protection Agency.
Supplementary material
Supplementary material is available at European Heart Journal online.
Conflict of interest: S.W., S.E.S., and M.B. received support from Acarix in the form of an institutional research grant outside this work. M.B. discloses advisory board participation for NOVO Nordisk, AstraZeneca, Bayer, Sanofi, and Acarix outside this work. S.E.S. is a part-time consultant in Acarix and a minor shareholder of Acarix outside this work. J.K. discloses speaker fees from GE Healthcare, Merck, Lundbeck, and Bayer and study protocol constancy fees from GE Healthcare and AstraZeneca outside of the submitted work. J.K. was the first author of the 2019 ESC guidelines for the diagnosis and management of chronic coronary syndromes. The remaining authors have nothing to disclose.
References

