


Abstract
RV dysfunction is associated with increased mortality and morbidity in patients with heart failure. Due to the complex shape and position of the RV, assessing RV function from echocardiographic images remains a challenge.
We have previously found that global longitudinal strain from 2DSTE is superior to left ventricular ejection fraction (LVEF) in identifying HFrEF patients with high risk of mortality. In this study we wanted to examine RV 2DSTE in patients with HFrEF and compare its prognostic value to conventional RV measures.
Echocardiographic examinations were retrieved from 701 patients with HFrEF. RV estimates were analysed offline, and end point was all-cause mortality. During follow-up (median 39 months) 118 patients (16.8%) died. RV GLS and RV FWS remained associated with mortality after multivariable adjustment, independent of TAPSE (RV GLS: HR 1.07, 95% CI 1.02–1.13, p=0.010, per 1% decrease) (RV FWS: HR 1.05, 95% CI 1.01–1.09, p=0.010, per 1% decrease). This seemed to be caused by significant associations in men as TAPSE remained as the only independent prognosticator in women. All RV estimates provided prognostic information incremental to established risk factors and significantly increased C-statistics (TAPSE: 0.74 to 0.75; RVFAC: 0.74 to 0.75; RVFWS: 0.74 to 0.77; RVGLS: 0.74 to 0.77).
RV strain from 2DSTE was associated with mortality in patients with HFrEF, independent of TAPSE and established risk factors. Our results indicate that RV strain is particularly valuable in male patients, whereas in women TAPSE remains a stronger prognosticator.
NRI analyses on RV measures
| ACC/AHA Pooled Cohort Equation* | Net Reclassification Improvement |
|---|---|
| Continuous Variables | |
| All Patients | |
| TAPSE | 36.7% (95% CI 0.124–0.566‡ |
| RVFAC | 30.9% (95% CI 0.035–0.492‡ |
| RV FWS | 31.0% (95% CI 0.044–0.544‡ |
| RV GLS | 34.3% (95% CI 0.111–0.564‡ |
| Women | |
| TAPSE | 63.2% (95% CI 0.172–1.055‡ |
| RVFAC | 20.6% (95% CI −0.415–0.876) |
| RV FWS | 29.7% (95% CI −0.208–1.080) |
| RV GLS | 35.3% (95% CI −0.384–0.992) |
| Men | |
| TAPSE | 29.0% (95% CI −0.114–0.529) |
| RVFAC | 32.7% (95% CI 0.005–0.553‡ |
| RV FWS | 25.4% (95% CI −0.066–0.559) |
| RV GLS | 33.5% (95% CI 0.027–0.590‡) |
ACC/AHA Pooled Cohort Equation: age, sex, systolic blood pressure, hypertension, cholesterol levels, diabetes, smoking status and prevalent ischemic heart disease. Race excluded. Sex excluded when considering men and women respectively. NRI, net reclassification improvement. ‡Indicates a statistically significant result.
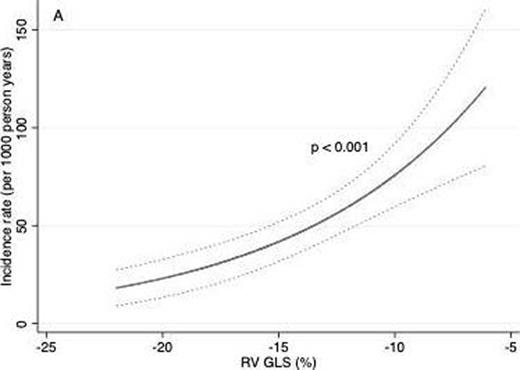
RV GLS and the risk of mortality
Type of funding source: Private company. Main funding source(s): PGJ reports receiving lecture fee from Novo Nordisk.

