


Abstract
Quantitative flow ratio (QFR) uses fast computational algorithms based on 3-dimensional quantitative coronary angiography and estimation of contrast flow velocity during invasive coronary angiography (ICA) to obtain QFR values equivalent to fractional flow reserve (FFR).
To compare the diagnostic performance of QFR with coronary computed tomography angiography (CCTA), single-photon emission tomography (SPECT), and positron emission tomography (PET) for diagnosing myocardial ischemia defined by FFR.
QFR computation was attempted in 109 patients (286 vessels without a subtotal/total lesion) of the 208 patients included in the PACIFIC-trial. Patients underwent 256-slice CCTA, Tetrofosmin SPECT, and [15O]H2O PET prior to ICA in conjunction with 3 vessel FFR measurements. ICA images were obtained without the use of a dedicated QFR acquistion protocol. QFR was calculated using a fixed empiric hyperemic flow velocity (fQFR) as well as using a patient specific flow velocity based on contrast passage through the coronary (cQFR). All analysis were performed on a per vessel level.
Fixed QFR computation succeeded in 152 (53%) vessels while cQFR analysis was successful in 140 (49%) vessels. A good correlation between FFR and fQFR/cQFR was observed (R=0.774, p<0.001/R=0.790, p<0.001). The diagnostic performance in terms of sensitivity, specificity, negative predictive value, positive predictive value, and accuracy is presented in table 1. In total, 133 vessels with matched FFR, fQFR, cQFR, CCTA, SPECT, and PET results were available for the comparative C-statistic analysis, figure 1. The diagnostic performance of fQFR and cQFR was comparable (p=0.451) and superior to CCTA (p=0.004/p=0.003), SPECT (p<0.001/p<0.001), and PET (p=0.008/p=0.006), figure 1. CCTA, and PET performed alike (p=0.568) and outperformed SPECT (p=0.023, p=0.002).
Table 1
| % (95% Confidence Interval) | fQFR n=152 | cQFR (n=140) | CCTA (n=152) | SPECT (n=150) | PET (n=149) |
|---|---|---|---|---|---|
| Sensitivity | 76 (59–89) | 71 (53–86) | 70 (51–84) | 30 (16–49) | 76 (58–89) |
| Specificity | 94 (88–98) | 93 (86–97) | 73 (64–81) | 96 (90–99) | 80 (72–87) |
| Negative Predictive Value | 93 (88–96) | 92 (86–95) | 90 (84–94) | 83 (79–86) | 92 (86–96) |
| Positive Predictive Value | 79 (64–89) | 74 (59–85) | 42 (33–51) | 67 (42–84) | 52 (42–62) |
| Accuracy | 90 (84–94) | 88 (81–93) | 72 (65–79) | 81 (74–87) | 79 (72–85) |
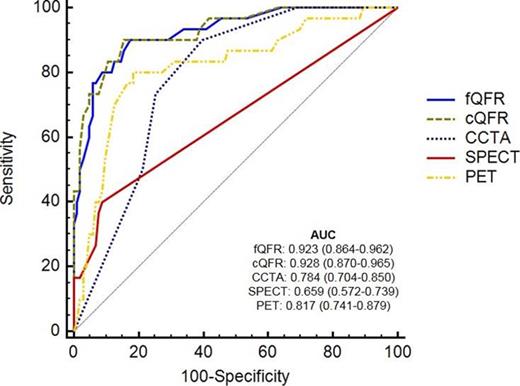
Figure 1.
Fixed QFR and cQFR correlate well with FFR with a high diagnostic accuracy as result. QFR outperformed CCTA, SPECT, and PET for the diagnosis of myocardial ischemia on a per vessel basis with the important footnote that fQFR and cQFR could only be computed in 53%, and 49% of the vessels.


