


Abstract
Cardiac troponin T (cTnT) is suggested as a predictor of amputation in patients with peripheral artery disease (PAD). However, cTnT-PAD association has not been systematically studied in a large study. This study evaluated the association of high-sensitivity cTnT (hs-cTnT) with PAD incidence and also explored whether natriuretic peptide (NT-proBNP), another representative cardiac marker, predicts PAD risk.
Among 12 288 middle-aged adults, the associations of hs-cTnT and NT-proBNP with incident PAD (hospitalizations with PAD diagnosis or leg revascularization [cases with rest pain or tissue loss considered as critical limb ischaemia (CLI)]) were quantified with multivariable Cox regression models. The risk discrimination was assessed by c-statistic. During a follow-up over 22 years, 454 participants developed PAD (164 CLI cases). In demographically adjusted models, the highest category of hs-cTnT (≥14 vs. <3 ng/L) and NT-proBNP (≥258.3 vs. <51.5 pg/mL) showed ∼8- and 10–20-fold higher risk of PAD and CLI, respectively. Even after adjusting for potential confounders and each other, hazard ratios were greater for CLI than for PAD (7.74 95% confidence interval [95% CI 4.43–13.55] vs. 2.84 [2.02–4.00] for the highest vs. reference hs-cTnT category and 4.63 [2.61–8.23] vs. 3.16 [2.23–4.49] for the highest vs. reference NT-proBNP category). The addition of these cardiac markers improved c-statistics for CLI.
High-sensitivity cTnT and NT-proBNP were independently associated with incident PAD, particularly its severe form, CLI. Although future studies are warranted to investigate pathophysiological mechanisms behind these associations, our study suggests the usefulness of cardiac markers to identify individuals at high risk of CLI.
Introduction
Cardiac troponin T (cTnT) is an essential protein for myocardial contraction. Cardiac troponin T is released into the blood circulation as a result of myocardial damage and thus is clinically used to diagnose myocardial infarction.1 However, cTnT measured with a high-sensitivity assay (hs-cTnT), can be detected in middle-aged and older general populations free of clinical signs of coronary artery disease2 , 3 and therefore is considered to reflect not only epicardial coronary lesions but other pathological processes like microvascular diseases, myocardial apoptosis or strain, and inflammation.4 , 5 Indeed, in the general population, hs-cTnT is more strongly associated with subsequent risk of heart failure than that of myocardial infarction.2
Recently, several studies have demonstrated that cTnT can predict adverse outcomes in patients with peripheral artery disease (PAD).5–9 Given that cTnT is a marker of cardiac damage, it is not surprising that cTnT is a strong predictor of mortality in this clinical population.5–9 However, cTnT has also been linked to the risk of limb amputation in one small study with 42 amputation cases.5 It is possible that cTnT may reflect a few clinical aetiologies potentially contributing to delayed wound healing, poor collateral formation, and limb microembolism (e.g. microvascular disease, atrial fibrillation, and heart failure).10–12
To explore hs-cTnT as a predictor of ischaemic limb outcomes, we quantified the association of hs-cTnT with subsequent risk of developing PAD and its severe form, critical limb ischaemia (CLI), using data from a community-based cohort, the Atherosclerosis Risk in Communities (ARIC) Study. We hypothesized that hs-cTnT is more strongly associated with CLI than PAD without CLI. Also, we analysed another representative cardiac marker, N-terminal pro-brain natriuretic peptide (NT-proBNP), predicting cardiovascular risk similarly as hs-cTnT,13 to evaluate whether the association with PAD is unique to hs-cTnT or is common to both cardiac markers.
Methods
Study population
The ARIC Study is a prospective cohort of 15 792 individuals who were 45 to 64 years of age at Visit 1 (1987–1989) and from four communities in the USA (Forsyth County, North Carolina; Jackson, Mississippi; suburban Minneapolis, Minnesota; and Washington County, Maryland). The ARIC Study has conducted follow-up examinations in 1990 to 1992 (Visit 2), 1993 to 1995 (Visit 3), 1996 to 1998 (Visit 4) and 2011 to 2013 (Visit 5). We used Visit 2 as baseline in this study, when hs-cTnT and NT-proBNP measurements were first available in the ARIC Study. Of the 14 348 participants who attended Visit 2, we excluded participants with race other than black or white (n = 42), with prevalent PAD (n = 641 defined by ankle-brachial index [ABI] ≤0.9, intermittent claudication, or leg revascularization at Visit 1 or any PAD outcomes summarized subsequently between Visits 1 and 2) or with missing data on hs-cTnT or NT-proBNP (n = 885) or covariates (n = 492), leaving a final sample of 12 288 participants. Although details were described elsewhere,14 ABI was evaluated at Visit 1 based on ankle blood pressure and brachial blood pressure measured by Dinamap Model 1846 SX. The ARIC Study was reviewed and approved by the Institutional Review Board of participating centres, and written informed consent was obtained from all participants.
Cardiac markers
Both hs-cTnT and NT-proBNP were measured between 2012 and 2013 using serum samples obtained at ARIC Visit 2 and stored at −70°C until the measurement. Serum hs-cTnT was measured using a sandwich immunoassay method on a Roche Elecsys 2010 Analyzer (Roche Diagnostics, Indianapolis, IN, USA), a novel highly sensitive assay with a lower measurable limit of 3 ng/L. Coefficient of variations were 6.0% at a mean concentration of 25 ng/L and <10% below 14 ng/L. N-terminal pro-brain natriuretic peptide was measured using the same Analyzer with a lower measurable limit of 5 pg/mL. Its coefficient of variation was 5.4% at a concentration of 133 pg/mL. For participants with unmeasurable concentrations of hs-cTnT (50%, n = 6177) and NT-proBNP (3%, n = 396), we assigned a value of 1.5 ng/L for hs-cTnT and 2.5 pg/mL for NT-proBNP (i.e. half the lower measurable limit of each marker).
Outcome assessment
Based on previous literature,15 , 16 clinical PAD in this study was identified based on hospitalizations with the following IInternational Classification of Diseases (ICD)-9 discharge codes: 440.20 (atherosclerosis of native arteries of the extremities, unspecified); 440.21 (atherosclerosis of native arteries of the extremities with intermittent claudication); 440.22 (atherosclerosis of native arteries of the extremities with rest pain); 440.23 (atherosclerosis of native arteries of the extremities with ulceration); 440.24 (atherosclerosis of native arteries of the extremities with gangrene); 440.29 (other atherosclerosis of native arteries of the extremities); 440.3 (atherosclerosis of bypass graft of the extremities); 440.4 (chronic total occlusion of artery of the extremities); 38.18 (endarterectomy, lower limb arteries); 39.25 (aorta-iliac-femoral bypass); 39.29 (other (peripheral) vascular shunt or bypass); and 39.50 (angioplasty or atherectomy of other non-coronary vessel(s)).
PAD cases with discharge codes indicative of rest leg pain, ulcer, and gangrene were considered as CLI. Specifically, CLI included cases with 440.22, 440.23, and 440.24 and those with any of the PAD code above with concurrent ICD-9 codes of ulcer (707.1), gangrene (785.4), and leg amputation (84.1x). Follow-up of participants who were free of PAD ended on the date of death, date of last contact, or 31 December 2013, whichever came first.
Covariates
Participants’ baseline demographic, lifestyle, and clinical characteristics were collected at Visit 2, unless otherwise specified. Age, sex, and race were ascertained through interviews at Visit 1. Education information was obtained at Visit 1 as well and was categorized into basic (less than high school), intermediate (high school graduate or vocational school), and advanced (college, graduate school, or professional school). Smoking status were self-reported and categorized into current, former, or never. Body mass index (BMI) was calculated as weight in kilogram divided by height in metres squared. Sitting blood pressures were measured three times by sphygmomanometer after a 5-min rest, and the mean of the last two measurements was recorded. Diabetes was defined as fasting glucose concentration ≥126 mg/dL (≥7.0 mmol/L), non-fasting glucose ≥200 mg/dL (≥11.1 mmol/L), self-reported physician diagnosis of diabetes, or use of anti-diabetic medications. Total and high-density lipoprotein (HDL) cholesterols were measured using automated enzymatic procedures.17 , 18 History of coronary heart disease was defined as self-reported clinical history, evidence of prior myocardial infarction by electrocardiogram obtained at Visit 1, or cases adjudicated by physician panel between Visits 1 and 2. History of stroke was similarly defined by self-reported history at Visit 1 and any adjudicated cases between Visits 1 and 2. History of heart failure was defined as Gothenburg Stage 319 at Visit 1 or hospitalization with a heart failure discharge code between Visits 1 and 2. Medications were determined by self-report usage in the past 2 weeks and inspection of medication bottles brought to the visit. Estimated glomerular filtration rate (eGFR) was calculated using the Chronic Kidney Disease Epidemiology Collaboration creatinine equation.20
Statistical analysis
We first categorized hs-cTnT into five groups based on the measurable limit of the assay (3 ng/L), limit for reliable detection (5 ng/L), and a clinical threshold specified by the manufacturer corresponding to the 99th percentile in healthy individuals (14 ng/L): <3 (unmeasurable), 3 to 5, 6 to 8, 9 to 13, and ≥14 ng/L. These thresholds corresponded to the 51st, 71st, 87th, and 95th percentiles of hs-cTnT in our study sample. For a fair comparison of the two cardiac markers, we also divided NT-proBNP into five groups according to these same percentiles, corresponding to cut-offs at 51.53, 86.44, 140.9, and 258.3 pg/mL, respectively. We summarized baseline characteristics by these five categories of hs-cTnT and NT-proBNP and assessed the difference across categories using analysis of variance and χ2 test, as appropriate.
For survival analysis, we first estimated the incidence rate of PAD and CLI, adjusting for age, gender, and race, using Poisson regression models. The two cardiac markers were log-transformed and modelled as linear splines with four knots at the aforementioned cut-offs for the five categories. Subsequently, we quantified the association with incident PAD and CLI for hs-cTnT and NT-proBNP across five categories using Cox proportional hazards regression model, with the lowest category of each marker as reference. We implemented three models to evaluate the impact of potential confounders. Model 1 included age, gender, and race. Model 2 further adjusted for education level, BMI, total and HDL cholesterol levels, systolic blood pressure, use of anti hypertensive medication, smoking status, diabetes, a history of coronary disease, stroke, and heart failure, and eGFR. Model 3 additionally incorporated the other cardiac marker (i.e. NT-proBNP in the analysis of hs-cTnT, and vice versa). As a sensitivity analysis, we investigated whether stratification by or additional adjustment for ABI at Visit 1 alter the results. We used seemingly unrelated regression21 to compare the strength of association between each cardiac marker and PAD without CLI vs. CLI.
We repeated our analyses stratifying by key demographic and clinical subgroups of age (<57 vs. ≥57 years [median at baseline]), gender, race (whites vs. blacks), smoking status (current vs. former/never), and the presence/absence of diabetes mellitus, hypertension (defined as systolic blood pressure ≥140 mmHg, diastolic blood pressure ≥90 mmHg, or taking any anti-hypertensive medication), history of cardiovascular disease (coronary heart disease, stroke, or heart failure), and kidney function (eGFR <60 vs. ≥60 mL/min/1.73 m2) at baseline. The likelihood ratio test was used to test potential effect modification by the aforementioned factors comparing models with and without interaction terms of interest.
Finally, we evaluated whether the addition of hs-cTnT or NT-proBNP would improve the prediction of PAD and CLI in 10-year time frame. We used Model 2 (including known risk factors of atherosclerosis) as a base model and quantified changes in Harrell’s c-statistic, a parameter of risk discrimination accounting for censoring,22 after adding hs-cTnT and/or NT-proBNP. The two cardiac markers were modelled as a continuous variable after log-transformation. All analyses were performed using Stata, version 13.0 (StataCorp LP, College Station, TX, USA), and a P-value <0.05 was considered statistically significant.
Results
Baseline characteristics
The mean age of the participants was 56.8 (standard deviation [SD] 5.7) years old, with 55.7% (n = 6840) women and 24.7% (n = 3033) blacks. Compared to those with unmeasurable hs-cTnT (<3 ng/L), participants with higher hs-cTnT levels were more likely to be older, black, male, and less educated (Table 1). There was a U-shaped association for the proportion of current smokers across hs-cTnT categories. These participants in the higher hs-cTnT categories also had poorer cardiovascular risk profile (e.g. higher BMI and systolic blood pressure, lower HDL cholesterol level and eGFR level, and higher prevalence of diabetes and cardiovascular diseases) than those with unmeasurable hs-cTnT. Largely similar patterns were observed for participants with higher NT-proBNP levels (Supplementary material online, Table S1), but U-shaped patterns were observed for the proportion of blacks, men, and diabetes and mean BMI and HDL cholesterol (inverse U-shaped) across NT-proBNP categories. The Spearman’s correlation coefficient for hs-cTnT and NT-proBNP was 0.10.
Baseline characteristics by high-sensitivity cardiac troponin T categories at baseline
| hs-cTnT category (ng/L) | ||||||
|---|---|---|---|---|---|---|
| <3 | 3 to 5 | 6 to 8 | 9 to 13 | ≥14 | P-value | |
| n | 6177 | 2634 | 1819 | 1058 | 600 | |
| Age (years) | 55.5 (5.4) | 57.1 (5.6) | 58.4 (5.6) | 59.5 (5.6) | 60.0 (5.3) | <0.001 |
| Male (%) | 1884 (30.5%) | 1348 (51.2%) | 1059 (58.2%) | 729 (68.9%) | 428 (71.3%) | <0.001 |
| Black race (%) | 1381 (22.4%) | 581 (22.1%) | 477 (26.2%) | 334 (31.6%) | 260 (43.3%) | <0.001 |
| Education level | <0.001 | |||||
| Basic (%) | 1095 (17.7%) | 521 (19.8%) | 427 (23.5%) | 310 (29.3%) | 218 (36.3%) | |
| Intermediate (%) | 2742 (44.4%) | 1107 (42.0%) | 693 (38.1%) | 382 (36.1%) | 207 (34.5%) | |
| Advanced (%) | 2340 (37.9%) | 1006 (38.2%) | 699 (38.4%) | 366 (34.6%) | 175 (29.2%) | |
| Body mass index (kg/m2) | 27.5 (5.2) | 28.1 (5.2) | 28.4 (5.3) | 29.0 (5.8) | 29.5 (6.0) | <0.001 |
| Systolic blood pressure (mmHg) | 118.0 (16.8) | 122.0 (18.2) | 124.1 (18.9) | 127.1 (19.4) | 132.5 (25.0) | <0.001 |
| Diastolic blood pressure (mmHg) | 71.2 (9.7) | 72.6 (9.9) | 73.1 (10.6) | 74.0 (10.8) | 74.1 (13.0) | <0.001 |
| Antihypertensitive medication (%) | 1572 (25.4%) | 838 (31.8%) | 678 (37.3%) | 490 (46.3%) | 373 (62.2%) | <0.001 |
| Total cholesterol (mmol/L) | 5.4 (1.0) | 5.4 (1.0) | 5.4 (1.0) | 5.4 (1.0) | 5.5 (1.3) | 0.045 |
| HDL cholesterol (mmol/L) | 1.4 (0.4) | 1.2 (0.4) | 1.2 (0.4) | 1.2 (0.4) | 1.1 (0.4) | <0.001 |
| Current smoking (%) | 1556 (25.2%) | 482 (18.3%) | 298 (16.4%) | 188 (17.8%) | 127 (21.2%) | <0.001 |
| Diabetes mellitus (%) | 611 (9.9%) | 339 (12.9%) | 342 (18.8%) | 252 (23.8%) | 252 (42.0%) | <0.001 |
| Prevalent stroke (%) | 58 (0.9%) | 29 (1.1%) | 33 (1.8%) | 40 (3.8%) | 49 (8.2%) | <0.001 |
| Prevalent heart failure (%) | 212 (3.4%) | 78 (3.0%) | 88 (4.8%) | 95 (9.0%) | 86 (14.3%) | <0.001 |
| Prevalent coronary heart disease (%) | 161 (2.6%) | 121 (4.6%) | 139 (7.6%) | 128 (12.1%) | 115 (19.2%) | <0.001 |
| eGFRcr (mL/min/1.73 m2) | 99.3 (13.7) | 96.3 (14.4) | 94.5 (15.0) | 91.5 (16.8) | 83.2 (25.9) | <0.001 |
| NT-proBNP (pg/mL) | 49.6 [26.7, 86.5] | 46.1 [24.6, 87.8] | 52.7 [27.1, 97.9] | 59.1 [31.8, 130.3] | 102.7 [40.4, 319.0] | <0.001 |
Values are mean (SD), n (%), or median [IQI]. P-values are based on one-way analysis of variance test for continuous variables and χ2 test for categorical variables.
IQI, interquartile interval.
Associations of cardiac markers with peripheral artery disease and critical limb ischaemia in the overall study population
Out of 12 288 participants who were free of PAD at baseline, 454 participants had at least one hospitalization with diagnosis of PAD (crude incidence rate: 1.9 per 1000 person-years) during a median follow-up of 21.6 years. Of these, 164 participants were considered to have had CLI (crude incidence rate: 0.7 per 1000 person-years). The demographically adjusted incidence rate of PAD continuously increased across both TnT and NT-proBNP levels (green lines in Supplementary material online, Figure S1A and B). A similar pattern, although at a lower rate, was observed for CLI (red lines in Supplementary material online, Figure S1A and B). The risk gradient of CLI appeared to be sharper for hs-cTnT as compared to that for PAD although the risk slopes for PAD and CLI were largely parallel for NT-proBNP.
We confirmed an independent dose-response association of hs-cTnT and NT-proBNP with incident PAD when the two cardiac markers were modelled using five categories (Table 2). In demographically adjusted models (Model 1), the highest category of hs-cTnT (≥14 ng/L) and NT-proBNP (≥258.3 pg/mL) showed ∼8-fold higher risk of PAD compared to their reference categories (<3 ng/L and <51.53 pg/mL, respectively). The associations were attenuated but the patterns remained similar after accounting for traditional cardiovascular risk factors (Model 2) and the other cardiac marker (Model 3). The hazard ratio (HR) of incident PAD at a given category was slightly but consistently higher for NT-proBNP over hs-cTnT.
Hazard ratio of peripheral artery disease and critical limb ischaemia according to high-sensitivity cardiac troponin T and N-terminal pro-brain natriuretic peptide categories
| hs-cTnT categories (ng/L) | ||||||
|---|---|---|---|---|---|---|
| Outcome | Model | <3 | 3 to 5 | 6 to 8 | 9 to 13 | ≥14 |
| PAD | 1 | 1 (Referent) | 1.24 (0.94, 1.64) | 1.89 (1.43, 2.50) | 2.79 (2.05, 3.80) | 7.41 (5.46, 10.04) |
| PAD | 2 | 1 (Referent) | 1.19 (0.90, 1.58) | 1.60 (1.21, 2.13) | 1.78 (1.29, 2.46) | 3.51 (2.52, 4.89) |
| PAD | 3 | 1 (Referent) | 1.17 (0.88, 1.55) | 1.53 (1.15, 2.03) | 1.61 (1.17, 2.23) | 2.84 (2.02, 4.00) |
| CLI | 1 | 1 (Referent) | 2.17 (1.29, 3.66) | 3.27 (1.93, 5.52) | 6.95 (4.10, 11.80) | 23.66 (14.31, 39.12) |
| CLI | 2 | 1 (Referent) | 1.95 (1.15, 3.30) | 2.41 (1.41, 4.11) | 3.98 (2.30, 6.89) | 9.55 (5.53, 16.51) |
| CLI | 3 | 1 (Referent) | 1.93 (1.14, 3.27) | 2.29 (1.35, 3.91) | 3.54 (2.05, 6.14) | 7.74 (4.43, 13.55) |
NT-proBNP categories (pg/mL) | ||||||
| Outcome | Model | <51.53 | 51.53 to <86.44 | 86.44 to <140.9 | 140.9 to < 258.3 | ≥258.3 |
| PAD | 1 | 1 (Referent) | 1.68 (1.29, 2.19) | 2.54 (1.92, 3.34) | 2.83 (2.06, 3.90) | 8.25 (6.15, 11.07) |
| PAD | 2 | 1 (Referent) | 1.57 (1.20, 2.05) | 2.18 (1.64, 2.89) | 2.30 (1.65, 3.21) | 3.99 (2.83, 5.64) |
| PAD | 3 | 1 (Referent) | 1.55 (1.19, 2.03) | 2.10 (1.59, 2.79) | 2.08 (1.49, 2.90) | 3.16 (2.23, 4.49) |
| CLI | 1 | 1 (Referent) | 2.13 (1.37, 3.32) | 3.07 (1.94, 4.86) | 3.19 (1.85, 5.49) | 10.40 (6.45, 16.79) |
| CLI | 2 | 1 (Referent) | 2.29 (1.46, 3.58) | 3.31 (2.06, 5.32) | 3.67 (2.09, 6.47) | 7.22 (4.09, 12.76) |
| CLI | 3 | 1 (Referent) | 2.38 (1.52, 3.72) | 3.16 (1.96, 5.09) | 2.97 (1.68, 5.24) | 4.63 (2.61, 8.23) |
Model 1 adjusted for age, gender, and race.
Model 2 adjusted for covariates in Model 1, plus education, BMI, total and HDL cholesterols, systolic blood pressure, antihypertensive drugs, smoking, diabetes, history of stroke/CHD/HF, and eGFR.
Model 3 adjusted for covariates in Model 2, plus log hs-cTnT/log NT-proBNP, as appropriate. CHD/HF, coronary heart disease/heart failure.
For CLI, in a demographically adjusted model (Model 1 in Table 2), the highest category of hs-cTnT had an extremely high HR of 23.66 (95% confidence interval [95% CI 14.31–39.12]). The HR of CLI for the highest category of NT-proBNP was 10.40 (95% CI 6.45–16.79). In this model, even the second highest category of hs-cTnT carried ∼7-fold greater risk of CLI (HR 6.95 [95% CI 4.10–11.80]). The associations remained significant after adjustment for traditional cardiovascular risk factors (Model 2) and for each other cardiac marker (Model 3). Even in Model 3, the HRs for the highest category of hs-cTnT and NT-proBNP levels were 7.74 (4.43–13.55) and 4.63 (2.61–8.23), respectively. The HRs of CLI in the two highest categories were consistently higher for hs-cTnT than for NT-proBNP whereas opposite patterns were seen in the other two lower categories. The stratification by and additional adjustment for Visit 1 ABI did not materially altered the results (Supplementary material online Tables S2–S4,). We also confirmed that NT-proBNP based on clinical thresholds23 were significantly associated with incident PAD and CLI (Supplementary material online, Table S5).
We confirmed the independent and multiplicative associations of hs-cTnT and NT-proBNP with both incident PAD and CLI in the cross-categories of these two cardiac markers (Figure 1). To obtain a reliable estimate in each cell, the highest two categories and the intermediate two categories of each cardiac marker were merged for this analysis. HR at a given cross-category was greater for CLI than for PAD. HRs of CLI exceeded 10 for those with hs-cTnT ≥ 9 ng/L when NT-proBNP was >51.5 pg/mL. Multiplicative contributions of hs-cTnT and NT-proBNP, as continuous exposures, to PAD and CLI are shown in Supplementary material online, Figure S2.
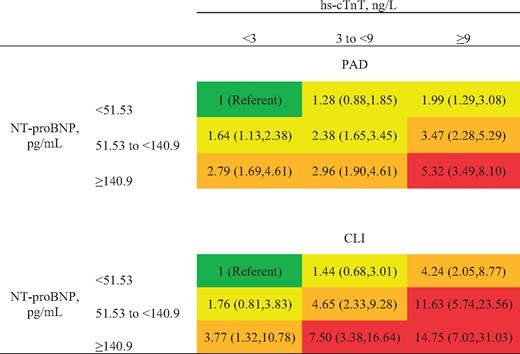
Hazard ratio of peripheral artery disease and critical limb ischaemia by cross-categories of high-sensitivity cardiac troponin T and N-terminal pro-brain natriuretic peptide. Models adjusted for covariates in Model 2 (age, gender, race, education, body mass index, total and high-density lipoprotein cholesterols, systolic blood pressure, antihypertensive drugs, smoking, diabetes, history of stroke/CHD/HF, and estimated glomerular filtration rate). Red indicates hazard ratio >5, orange 2.5–4.9, and yellow 1.25–2.49. CHD/HF: coronary heart disease/heart failure.
Using seemingly unrelated regression, we formally compared coefficients of CLI vs. PAD without CLI for each cardiac marker. To provide overall comparison, we modelled cardiac markers as linear terms after log-transformation. As shown in Supplementary material online, Table S6, hs-cTnT and NT-proBNP were more strongly associated with CLI than with PAD without CLI regardless of Models (P ≤ 0.001 in all Models), although the difference was more evident for hs-cTnT. Specifically, the HR for CLI was 1.6-fold (=exp[0.456]) greater than that for PAD without CLI for hs-cTnT but 1.1-fold (=exp[0.110]) for NT-proBNP in Model 3.
Subgroup analysis for the associations of cardiac markers with peripheral artery disease and critical limb ischaemia
With log-transformed cardiac markers as continuous variables, the interaction was significant for several subgroups (Figure 2). Specifically, we observed significantly stronger associations with incident PAD (borderline significance for CLI) in women, non-current smokers, and those with reduced kidney function for hs-cTnT and in those without diabetes for NT-proBNP. For CLI, the associations of both hs-cTnT and NT-proBNP were consistently stronger among those without hypertension. Nonetheless, hs-cTnT and NT-proBNP were significantly associated with increased risk of both PAD and CLI in every subgroup evaluated (all P-values ≤0.004 in Figure 2).
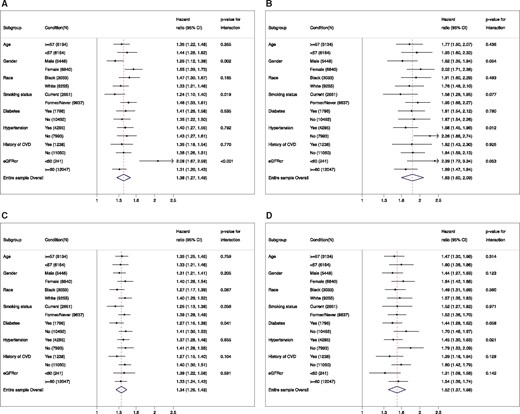
Hazard ratio of peripheral artery disease (A and C) and critical limb ischaemia (B and D) for 2-fold increment of high-sensitivity cardiac troponin T (A and B) and N-terminal pro-brain natriuretic peptide (C and D) in demographic and clinical subgroups.
Risk discrimination improvement for peripheral artery disease and critical limb ischaemia with high-sensitivity cardiac troponin T and N-terminal pro-brain natriuretic peptide
Harrell’s c-statistic was high in a base model with all covariates in Model 2 for PAD (0.879 [0.858–0.899]) and CLI (0.919 [0.889–0.949]) (Table 3). Despite this high base c-statistic, the addition of NT-proBNP and both cardiac markers significantly improved the discrimination for CLI (Δc-statistic 0.020 [95% CI 0.011–0.029] and 0.023 [0.008–0.038], respectively). The addition of hs-cTnT itself did not significantly improve the risk discrimination of CLI. However, after the addition of hs-cTnT, the association of gender with CLI was substantially attenuated (HR 1.18 [95% CI 0.83–1.69] vs. 0.73 [0.51–1.05] comparing men and women before vs. after including hs-cTnT, respectively). When we incorporated interaction terms between log-transformed hs-cTnT and gender, the addition of hs-cTnT significantly improved risk discrimination (Δc-statistic 0.017 [95% CI 0.002–0.031]).
C-statistic improvement by adding high-sensitivity cardiac troponin T and/or N-terminal pro-brain natriuretic peptide
| Harrell’s C (95% CI) | C-statistic difference from base model | P-value for difference | |
|---|---|---|---|
| PAD | |||
| Base model | 0.879 (0.859, 0.899) | — | |
| +Log hs-cTnT | 0.885 (0.865, 0.905) | 0.006 (−0.002, 0.014) | 0.138 |
| +Log NTpro-BNP | 0.887 (0.866, 0.907) | 0.008 (−0.003, 0.019) | 0.160 |
| +Log hs-cTnT+log NTpro-BNP | 0.890 (0.870, 0.911) | 0.011 (−0.001, 0.023) | 0.065 |
| CLI | |||
| Base model | 0.919 (0.889, 0.949) | — | |
| +Log hs-cTnT | 0.932 (0.896, 0.967) | 0.013 (−0.005, 0.030) | 0.151 |
| +Log NTpro-BNP | 0.939 (0.914, 0.964) | 0.020 (0.011, 0.029) | <0.001 |
| +Log hs-cTnT+log NTpro-BNP | 0.942 (0.911, 0.973) | 0.023 (0.008, 0.038) | 0.003 |
Base model included covariates in Model 2: age, gender, race, education, BMI, total and HDL cholesterols, systolic blood pressure, antihypertensive drugs, smoking, diabetes, history of stroke/CHD/HF, and eGFR. CHD/HF, coronary heart disease/heart failure.
Discussion
In this community-based bi-racial cohort with over two decades of follow-up, we observed robust associations of both hs-cTnT and NT-proBNP with PAD risk. These associations were independent of each other and well-known risk factors for atherosclerotic disease. We observed largely consistent results in all demographic and clinical subgroups examined (including those with vs. without diabetes). Of note, both cardiac markers, especially hs-cTnT, demonstrated stronger associations with CLI than overall PAD. Consequently, both cardiac markers improved risk discrimination of CLI beyond traditional risk factors.
Our results confirm and extent the existing literature. First, we found that hs-cTnT was associated with incident clinical PAD beyond leg amputation reported in a previous study,5 although its association was more evident with CLI. Second, this association was for the first time confirmed in the general population. Third, since strong associations do not necessarily lead to risk prediction improvement,24 it is important that we verified improvement in risk discrimination of CLI beyond established atherosclerotic risk factors. Fourth, based on our large sample size, we were also able to confirm this association in a wide range of demographic and clinical subgroups (e.g. persons with and without diabetes). Fifth, to our knowledge, this is the first study reporting the association between NT-proBNP and incident PAD. Finally, although the 2017 ESC Guidelines on the Diagnosis and Treatment of PAD recognize a few non-conventional predictors of PAD, such as high-sensitivity C-reactive protein and interleukin 6,25 our study suggests the need for attention to hs-cTnT and NT-proBNP in this context.
There are several plausible mechanisms to help explain the robust associations we observed for hs-cTnT and NT-proBNP with incident PAD. Both markers are known to be strongly associated with risk factors for atherosclerotic diseases (e.g. hypertension and diabetes), which is in line with stronger associations in demographically adjusted models (Model 1) than in extended models (Models 2 and 3). Nonetheless, the significant associations in Models 2 and 3 suggest that confounding by atherosclerotic risk factors would not fully explain the associations. These two cardiac markers have been previously shown to be strongly associated with heart failure and atrial fibrillation,4 clinical conditions increasing the risk of systemic embolism, which could trigger leg symptoms and signs and thus lead to PAD hospitalization and procedures.12 Another possibility is that hs-cTnT and NT-proBNP may be elevated in those with subclinical peripheral atherosclerosis that was not detected at the start of follow-up. Indeed, both aortic and arterial function are known to play an important role in effective cardiac function, a concept of ventricular/vascular coupling.26 Nonetheless, these potential mechanisms require further investigations.
The robust association of hs-cTnT with CLI in our study was particularly striking. Many PAD patients have a single proximal arterial lesion, and thus often PAD is considered as a large artery disease.27 However, patients with CLI are more likely to have multi-segmental stenosis including distal small arteries,27 and some investigators suggest the involvement of the microcirculation in the development of CLI, impairing collateral formation and wound healing.10 , 11 Indeed, ABI does not necessarily correlate with severity of CLI.28 In this context, it is of interest that a few studies have indicated that hs-cTnT may reflect microvascular damage of the heart as well as other organs.29 , 30 Nonetheless, future studies are warranted to investigate pathophysiological links between hs-cTnT and CLI.
There are several clinical implications of our results. CLI is a devastating condition, with substantial impact on patients’ prognosis and quality of life as well as medical expenditure.31 , 32 Within 1 year after the diagnosis, ∼25% of patients with CLI die and ∼30% undergo leg amputation.10 , 33 Of note, CLI is the first manifestation of PAD in 30-50% of CLI patients.34 Thus, the early-stage prevention of CLI is claimed to be a high priority.10 , 35 Our findings suggest that elevated cTnT and NT-proBNP may be useful to identify those at high risk of developing CLI. Both cardiac markers are currently used in clinical practice to diagnose cardiac diseases, and when elevated levels of these cardiac markers are detected in such a scenario, clinical attention should be paid to leg signs and symptoms (e.g. leg pulse and intermittent claudication). Such an approach may be particularly relevant to those with diabetes, among whom regular foot care is recommended but its adherence is only ∼30%.36 Targeted foot care may be useful for diabetic patients with elevated hs-cTnT and/or NT-proBNP.
Our results need to be interpreted in the context of several limitations. First, although ICD codes for hospital discharges have often been used to detect incident PAD cases in epidemiological and clinical research,15 , 37 it is likely that this approach will not capture mild PAD cases. However, our outcome definition is likely to be highly specific and has relevance for relatively severe cases of PAD which have particularly poor prognosis and account for a high proportion of medical expenditure.38 Also, this approach might misclassify CLI (e.g. ulcer might be due to other coexisting causes like venous ulcer). Second, our study population consists of whites and blacks aged 48–67 years old and may not be generalizable to other populations. Third, although we conducted a few sensitivity analyses with ‘baseline’ ABI, ABI was not concurrently measured at Visit 2, the baseline visit of the present study. Finally, as is true in any observational study, there remains possibility of residual confounding.
In conclusion, hs-cTnT and NT-proBNP were associated with future risk of PAD, particularly its severe form, CLI, independently of each other and known atherosclerotic risk factors. Although future studies are warranted to investigate pathophysiological mechanisms behind the associations of these cardiac markers with incident PAD, our study suggests the usefulness of these cardiac markers to identify individuals at high risk of CLI.
Supplementary material
Supplementary material is available at European Heart Journal online.
Acknowledgements
The authors thank the staff and participants of the ARIC study for their important contributions. The authors dedicate this paper to Dr Hirsch's memory and research legacy.
Funding
The Atherosclerosis Risk in Communities Study is carried out as a collaborative study supported by National Heart, Lung, and Blood Institute contracts (HHSN268201100005C, HHSN268201100006C, HHSN268201100007C, HHSN268201100008C, HHSN268201100009C, HHSN268201100010C, HHSN268201100011C, and HHSN268201100012C). This study is supported by a grant from the American Heart Association (#14CRP20380886) and a grant from the National Heart, Lung, And Blood Institute (R21HL133694) to K.M. Reagents for the hsc-TnT and NT-proBNP assays were donated by Roche Diagnostics.
Conflict of interest: K.M. reports grants from NIH, grants from AHA during the conduct of the study; grants and personal fees from Fukuda Denshi outside the submitted work. R.C.H. reports non-financial support from Roche Diagnostics during the conduct of the study; grants from Denka Seiken outside the submitted work; In addition, R.C.H. has a patent Provisional patent (patent no. 61721475) entitled “Biomarkers to Improve Prediction of Heart Failure Risk” filed by Baylor College of Medicine and Roche pending. C.M.B. reports grants, personal fees, and other from Roche during the conduct of the study; In addition, C.M.B. has a patent Provisional patent (Patent No. 61721475) entitled ‘Biomarkers to Improve Prediction of Heart Failure Risk’ filed by Baylor College of Medicine and Roche pending. All other coauthors have nothing to disclose.
Footnotes
See page 2420 for the editorial comment on this article (doi: )
References

