


Abstract
Both contrast enhanced (CE) two-dimensional echocardiography (2DE) and three-dimensional echocardiography (3DE) have been proposed as techniques to improve the accuracy of left ventricular (LV) volume measurements. We sought to examine the accuracy of non-contrast (NC) and CE-2DE and 3DE for calculation of LV volumes and ejection fraction (EF), relative to cardiac magnetic resonance imaging (MRI).
We studied 50 patients (46 men, age 63 ± 10 year) with past myocardial infarction who underwent echocardiographic assessment of LV volume and function. All patients sequentially underwent NC-2DE followed by NC-3DE. CE-2DE and CE-3DE were acquired during contrast infusion. Resting echocardiographic image quality was evaluated on the basis of NC-2DE. The mean LV end-diastolic volume (LVEDV) of the group by MRI was 207 ± 79 mL and was underestimated by 2DE (125 ± 54 mL, P = 0.005), and less by CE-2DE (172 ± 58 mL, P = 0.02) or 3DE (177 ± 64 mL, P = 0.08), but EDV was comparable by CE-3DE (196 ± 69 mL, P = 0.16). Limits of agreement with MRI were similar for NC-3DE and CE-2DE, with the best results for CE-3D. Results were similar for calculation of LVESV. Patients were categorized into groups of EF (≤35, 35–50, >50%) by MRI. NC-2DE demonstrated a 68% agreement (kappa 0.45, P = 0.001), CE-2DE a 62% agreement (kappa 0.20, P = 136), NC-3DE a 74% agreement (kappa 0.39, P = 0.005) and CE-3DE an 80% agreement (kappa 0.56, P < 0.001).
CE-2DE is analogous to NC-3DE in accurate categorization of LV function. However, CE-3DE is feasible and superior to other NC- and CE-techniques in patients with previous infarction.
Introduction
Accurate quantification of left ventricular (LV) volumes and ejection fraction (EF) is of critical importance. Current clinical guidelines recommend that a variety of therapeutic decisions should be on the basis of volumetric and EF measures in various patient groups, including those with cardiomyopathy and valvular heart disease. 1 , 2 Although two-dimensional echocardiography (2DE) is the most commonly used method for these assessments, the accuracy and reproducibility of this technique have significant limitations. 3–6
Some of the inaccuracy of 2DE pertains to suboptimal image quality. Comparisons with computed tomography and magnetic resonance imaging (MRI) have shown LV opacification (LVO) using transpulmonary contrast agents to improve endocardial resolution and therefore the accuracy of 2DE volume and EF assessment. 7–9 Importantly, LVO increases inter-observer reproducibility to a level comparable with MRI. 10 However, this improvement is not restricted to patients with poor baseline image quality, 8 so the benefit of LVO may not completely relate to improved endocardial resolution. An alternative mechanism may be the avoidance of off-axis image projections with LVO—in patients with good resting images, avoidance of problems with image alignment likely explains the better accuracy of LV volume and EF calculations with real-time three-dimensional echocardiography (3DE) compared with 2DE. 11 The incremental benefit of LVO to 3DE is uncertain—one study suggested that its use actually increased the variation between 3DE and MRI. 12 We sought to examine the relative accuracy of non-contrast (NC) and contrast enhanced (CE) 2DE and 3DE for calculation of LV ventricular volumes and EF, using quantitative MRI as a gold standard.
Methods
Study design
We prospectively recruited 60 patients (53 men, age 63 ± 12 years) with a history of myocardial infarction who were undergoing evaluation of LV volume and function in the course of studies approved by the human Ethics Committee of the Princess Alexandra Hospital. All patients were in sinus rhythm and sequentially underwent NC-2DE followed by NC-3DE. Contrast was then infused enabling CE-2DE and CE-3DE acquisition. MRI was performed on a subsequent day. Patients were excluded if they had contra-indications to the contrast agent or to MRI scanning. LV measurements were made blinded to other data. Separate personnel measured each modality, all were experienced at performing the measurements (the average imaging experience was 7.5 years, ranging from 5 to 20 years). Images for measurement were chosen on the basis of optimal alignment and image quality; multiple measurements were made per patient (usually three).
Non-contrast two-dimensional echocardiography
An experienced sonographer acquired transthoracic apical views of the LV, using harmonic imaging with a 3-MHz phased array transducer (Sonos 7500, Philips Medical Systems, Andover, MA, USA). Image quality was determined at rest without the use of contrast. Images were scored using two criteria; first, as technically difficult or not, 13 and second, by using a five point scale 14 in which 1, complete endocardial definition and wall thickening in multiple views; 2, visualization of all wall segments but not as adequately as in 1; 3, inadequate visualization of one or two segments in one view but adequate visualization of adjacent segments within the same territory; 4, inadequate visualization of three or more segments in multiple views but adequate visualization of adjacent segments of the same territory; and 5, inadequate visualization of segments comprising one or more entire coronary artery territories.
Volumes were obtained using biplane Simpson’s rule from the apical 4- and 2-chamber views. The endocardial border was manually traced by an experienced sonographer according to the recommendations of the American Society of Echocardiography, leaving the papillary muscles and trabeculations within the cavity. 15 Measurements of LV end-diastolic volume (LVEDV), LV end-systolic volume (LVESV), and EF were obtained off-line, with LVEDV measurements at the frame just prior to mitral valve closure and LVESV measured on the image with the smallest LV cavity. Additionally in the apical 4-chamber view the ventricular length was measured in end-diastole, from the plane of the annulus to the apex.
Non-contrast three-dimensional echocardiography
Two full volume real-time 3DE images were obtained from an apical window with the patient in the same position. Images were gathered over four cardiac cycles using a matrix array ultrasonographic transducer (X4 transducer, Philips Medical Systems). Measurements of 3DE volumes and EF were performed off-line (4D analysis, Tomtec Gmbh, Unterschleissheim, Germany). All measurements were performed by an experienced blinded sonographer. From an apical full volume acquisition, frames for LVEDV and LVESV measurement were identified by the same method as 2DE, and endocardial contours were marked in 12 long-axis slices (i.e. 15°/slice). 16 Contour tracing was performed with semi-automatic border detection and adjusted as required—after first identifying the apex and mitral annulus on each slice, a pre-configured ellipse was fitted to the endocardial borders of each frame and adjusted as required. LVEDV and LVESV were measured from the resulting 3D volume.
Contrast-enhanced two-dimensional echocardiography
CE images were performed using Optison (Amersham, Little Chalfont, UK) and Definity (Bristol-Myers Squibb, North Billerica, MA, USA) infused through the most proximal available vein. Optison was delivered as an initial bolus of 0.5–1 mL, followed by a slow saline flush until contrast was seen in the right ventricle. Likewise, 1.3 mL of Definity was added to 20 mL of saline, with an initial infusion of 1–1.5 mL/min depending on body habitus. Additional doses of contrast agent were titrated to maintain attenuation at the mitral valve level. 17 Real-time second harmonic LVO imaging was performed using the same commercially available machine and transducer as for standard 2DE. The apical 4- and 2-chamber views were repeated following LVO with machine settings optimized for each patient to minimize apical bubble destruction and basal/annular attenuation. The mechanical index was set between 0.2 and 0.3 with the highest possible frame rate, generally >20/s. Volumetric and EF calculations were repeated using the same biplane Simpson’s method used in the standard 2DE. Finally, the ventricular length was measured in the apical-4 chamber view in end-diastole, from the plane of the annulus to the apex.
Contrast-enhanced three-dimensional echocardiography
Immediately following acquisition of CE-2DE images, CE-3DE imaging was obtained using harmonic imaging. The same commercially available equipment and transducer were used as for standard 3DE. The initial infusion was the same as CE-2DE, but in most cases, maintaining attenuation at mitral level required the dose to be uptitrated, due to greater bubble destruction with 3DE. The mechanical index was set between 0.2 and 0.3 with the highest possible frame rate. Volumetric and EF calculations were repeated by an experienced blinded sonographer, using the same off-line software and technique as for standard 3DE.
Magnetic resonance imaging
Cardiac MRIs were obtained using a Sonata 1.5-T scanner (Siemens Medical Solutions AG, Erlangen, Germany). LV anatomy and function images were acquired in horizontal and vertical long- and short-axis views using free induction, steady-state precession imaging during a breath-hold. Acquisition time for cardiac MRIs was ∼40–50 min. Off-line calculations of the LVEDV, LVESV, and EF were performed using Cardiac Image Modelling software (CIM version 4.2; Auckland University, Auckland, New Zealand). LV volume calculation with this method is analogous to that used for 3DE and has previously been described. 11 Using two long-axis and six or more short-axis views, markers were placed on the right ventricle and LV annulus, and the endocardial border was detected automatically ( Figure 1 ). The same method was utilized to detect the epicardial border in the long- and short-axis views.
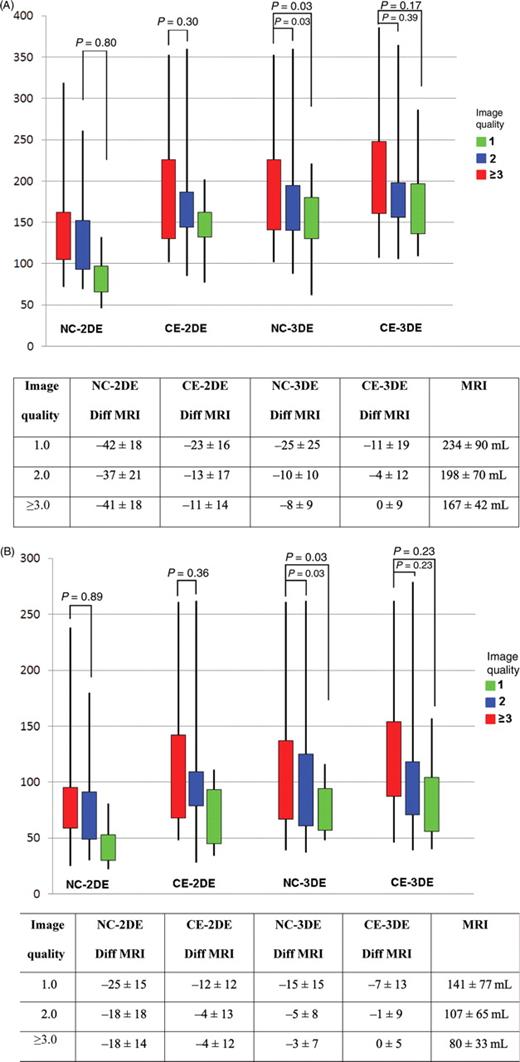
( A ) Measured end-diastolic volume (mL, Figure) and difference from magnetic resonance imaging (Table) in groups of different image quality (1, 2, and ≥3) using non-contrast two-dimensional echocardiography, contrast enhanced two-dimensional echocardiography, non-contrast three-dimensional echocardiography, and contrast enhanced three-dimensional echocardiography. ( B ) Measured end-systolic volume (mL, figure) and difference from magnetic resonance imaging (Table) in groups of different image quality (1, 2, and ≥3) using non-contrast two-dimensional echocardiography, contrast enhanced two-dimensional echocardiography, non-contrast three-dimensional echocardiography, and contrast enhanced three-dimensional echocardiography.
Statistical analysis
The sample size allowed a 20% difference between EDV measurements and a 34% difference in ESV measurements to be identified at 80% power.
Results for LVEDV, LVESV, and EF are represented as mean and standard deviation. Agreement was expressed according to the method of Bland and Altman. Multiple (usually three) measurements were made and the analyzed measurements for each technique were based on arithmetic means. Comparisons were made using ANOVA with Bonferroni correction for multiple tests. A subgroup ( n = 20) was studied for inter-observer variability, which was determined by using the same set of NC-2DE, CE-2DE, NC-3DE, and CE-3DE images measured from the same data-set by two separate experienced and blinded sonographers. Intra-observer repeated measurements were also performed an average 1 week apart; repeated analysis was performed in random order.
Patients were categorized into three groups on the basis of the EF (<35, 35–50, and >50%). Weighted kappa statistics were calculated to measure agreement between MRI and the various echocardiographic techniques for categorization of EF. Data analyses were performed using SPSS statistical software (SPSS 12.0; SPSS Corporation, Chicago, IL, USA). Tests were two-sided and a value of P < 0.05 was considered to be significant.
Results
Study population
Of the 60 patients recruited 10 were excluded, three were unable to complete the MRI scan due to claustrophobia and one due to body habitus. Five patients did not give consent for contrast injection and one patient was unable to have intravenous access. Of the 50 patients recruited, all had prior history of myocardial infarction and all had resting regional wall motion abnormalities ( Table 1 ).
Patient characteristics for the total group ( n = 50) and inter-/intra-observer group ( n = 20)
| Total patients ( n = 50) | Inter-/intra-observer group ( n = 20) | |
|---|---|---|
| Age (years) | 63 ± 10 | 63 ± 8 |
| Gender (males) | 46 | 19 |
| Body measurements | ||
| Height (cm) | 173 ± 6 | 171 ± 7 |
| Weight (kg) | 83 ± 16 | 81 ± 16 |
| BMI (kg/cm 2 ) | 28 ± 5 | 28 ± 4 |
| MRI volumes indexed to BSA | ||
| EDV (mL/m 2 ) | 69 ± 26 | 76 ± 25 |
| ESV (mL/m 2 ) | 39 ± 24 | 44 ± 26 |
| Regional wall motion score | 1.77 ± 0.51 | 1.87 ± 0.52 |
| Regional territories | ||
| Anterior (%) | 46 | 53 |
| Inferior (%) | 41 | 65 |
| Lateral (%) | 19 | 12 |
| >2 Territories (%) | 22 | 29 |
| Revascularization | ||
| PTCA (%) | 7 | 6 |
| CABG (%) | 44 | 41 |
| Medical therapy (%) | 48 | 35 |
Image quality and feasibility
All measures were completed in all patients and the mean image quality score was 1.96 ± 0.87. Ten patients (20%) had technically difficult studies based on resting echocardiographic images and all based on body habitus. Patients were divided into image quality of 1.0 ( n = 18), 2.0 ( n = 19), and 3 or greater ( n = 13). The differences between MRI were similar at each level of image quality ( Figure 1 ). The only significant difference found between image qualities was with NC-3DE for both EDV ( Figure 1 A ) and ESV ( Figure 1 B ).
The time requirement for NC-2DE was the least for acquisition and measurement ( Table 2 ). Times for CE-2DE and CE-3DE were longer than NC due to cannulation and bubble preparation, although measurements of CE and NC were similar. Although contrast aids in viewing the endocardial borders, it can also inhibit the view of the mitral valve opening and closure, therefore time is needed to ensure the timing of LVEDV and LVESV are correct.
Mean acquisition and measurement times ( n = 20)
| NC-2DE | CE-2DE | NC-3DE | CE-3DE | |
|---|---|---|---|---|
| P vs. NC-2DE | P vs. NC-2DE | P vs. NC-2DE | ||
| Acquisition time (s) | 120 ± 60 | 476 ± 29 | 50 ± 19 | 400 ± 32 |
| P < 0.001 | P < 0.001 | P < 0.001 | ||
| Measurement time (s) | 90 ± 27 | 94 ± 24 | 630 ± 60 | 624 ± 59 |
| P = 0.16 | P < 0.001 | P < 0.001 |
Left ventricular volumes
The mean LVEDV of the group by MRI was 207 ± 79 mL. NC-2D imaging (125 ± 54 mL, P < 0.001) markedly underestimated the LVEDV. CE-3DE (196 ± 69 mL), CE-2DE (172 ± 58 mL), and NC-3DE (177 ± 64 mL) slightly underestimated LVEDV but results were similar.
Similarly, the LVESV of 117 ± 71 mL by MRI was significantly underestimated by both NC-2DE (73 ± 44 mL) and CE-2DE (100 ± 51 mL), but neither NC-3DE (100 ± 57 mL) nor CE-3DE (111 ± 59 mL) images were significantly different. Similar to the mean LVEDV, there was a narrowing of the limits of agreement with each additional modality ( Figure 2 ). The mean EF by MRI was 47 ± 13%; other techniques were comparable, NC-2DE (43 ± 10%), CE-2DE (44 ± 12%), NC-3DE (47 ± 12%), and CE-3DE (46 ± 12%) ( Figure 2 ). Using 5% as being the clinically acceptable degree of variation between MRI and other measures, only 3D volumes were acceptable, but all EF measurements were acceptable.
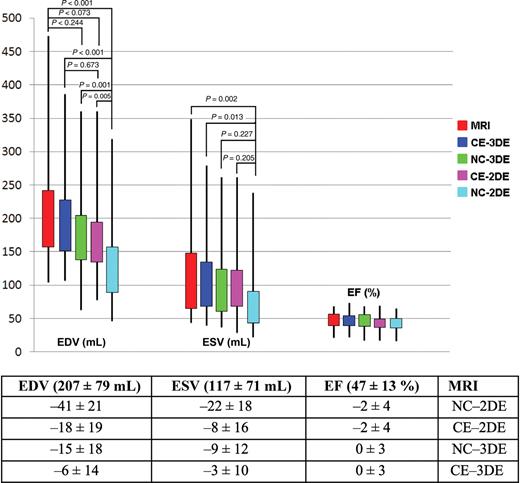
Comparison of end-diastolic volume (mL), end-systolic volume (mL) and ejection fraction (%) measured by magnetic resonance imaging and echo measures using non-contrast two-dimensional echocardiography, contrast enhanced two-dimensional echocardiography, non-contrast three-dimensional echocardiography, and contrast enhanced three-dimensional echocardiography.
When patients were categorized into preserved and reduced LV function using a cutoff of 50% by MRI, there were significant differences in the identification of preserved LV function using 3D compared with 2D methods ( Table 3 ). Additionally, using NC-2DE, 12 of the 50 patients (24%) had a >10% difference in EF between the echocardiogram and MRI, with EF underestimated in nine and overestimated in three. With CE-2DE, this was similar with 15 patients (30%) having a >10% difference (12 underestimated and three overestimated). Using NC-3DE and CE-3DE, four patients (8%) had a >10% difference in EF (two underestimated and two overestimated).
Classification of ejection fraction (%) categories
| EF (%) | MRI | Agreement with MRI classification | P -value | |||
|---|---|---|---|---|---|---|
| NC-2DE | CE-2DE | NC-3DE | CE-3DE | |||
| <50 | 28 | 26 (93%) | 27 (96%) | 25 (89%) | 26 (93%) | 0.78 |
| ≥50 | 22 | 12 (55%) | 11 (50%) | 18 (82%) | 19 (86%) | 0.02 |
| EF (%) | MRI | Agreement with MRI classification | P -value | |||
|---|---|---|---|---|---|---|
| NC-2DE | CE-2DE | NC-3DE | CE-3DE | |||
| <50 | 28 | 26 (93%) | 27 (96%) | 25 (89%) | 26 (93%) | 0.78 |
| ≥50 | 22 | 12 (55%) | 11 (50%) | 18 (82%) | 19 (86%) | 0.02 |
Assessment of left ventricular length
The measured mean ventricular length in the apical-4 chamber view was significantly longer following contrast administration (8.88 ± 0.9 vs. 9.49 ± 0.9, P < 0.001). In only seven patients was the measured LV length shorter following contrast administration.
Variability
Inter-observer variability was tested in 20 patients. There were significant differences between observers for LVEDV NC-2DE (138 ± 43 and 152 ± 42 mL, P = 0.02), but not for LVESV NC-2DE (83 ± 33 and 85 ± 33 mL, P = 0.57) or for CE-2DE LVEDV (194 ± 48 and 196 ± 57 mL, P = 0.68) and for LVESV (114 ± 45 and 115 ± 56 mL, P = 0.76), or either CE-3DE LVEDV (198 ± 65 and 199 ± 62 mL, P = 0.64) and for LVESV (114 ± 59 and 114 ± 56 mL, P = 0.98) or NC-3DE LVEDV (212 ± 64 and 212 ± 62 mL, P = 0.90) and for LVESV (126 ± 62 and 127 ± 61 mL, P = 0.69). Because the difference between observers increased at increasing volumes, these were expressed as a percentage of the mean volume ( Figure 3 A and B ). Using 5% as being the clinically acceptable degree of variation between observations, only 3D techniques appeared to be acceptable.


( A ) Inter-observer differences of agreement between end-diastolic volume (top graphs) and end-systolic volume (bottom graphs) measured by magnetic resonance imaging and echo measures using non-contrast two-dimensional echocardiography, contrast enhanced two-dimensional echocardiography, non-contrast three-dimensional echocardiography, and contrast enhanced three-dimensional echocardiography. Percentage of average measure on the Y -axis with the average measure on the X -axis. ( B ) Intra-observer differences of agreement between end-diastolic volume (top graphs) and end-systolic volume (bottom graphs) measured by magnetic resonance imaging and echo measures using non-contrast two-dimensional echocardiography, contrast enhanced two-dimensional echocardiography, non-contrast three-dimensional echocardiography, and contrast enhanced three-dimensional echocardiography. Percentage of average measure on the Y -axis with the average measure on the X -axis.
Discussion
The main findings of this study of patients with previous infarction are that the improvement in accuracy of estimation of LV volume and EF with CE-2DE is analogous to that of NC-3DE, and that techniques led to similar improvement in categorization of patients according to EF. However, CE-3DE is feasible and technically superior to NC-2DE, NC-3DE, and CE-2DE. With an average image quality score of 1.96 ± 0.87, all patients had one or more walls that were not visualized and therefore all were indicated for LVO.
Limitations of left ventricular volume and ejection fraction calculation with two-dimensional echocardiography
In patients with coronary artery disease, idiopathic cardiomyopathy, and valvular heart disease, even relatively small increases in ventricular volume are associated with increased mortality. Moreover, recognition of poorer prognosis with negative remodelling and reduced EF has led current clinical guidelines for management of patients with coronary disease (for example, indications for automatic implantable cardiac defibrillators and cardiac resynchronization therapy) and non-coronary disease (for example, indications for valve intervention in mitral regurgitation) to be based on measurement of EF. 1 , 2 Similarly, in patients with valvular heart disease, evidence of adverse remodelling alone may be an indication for intervention. 2 In most instances, these critical and expensive clinical decisions are being made with NC-2DE, which has significant limitations in accuracy and reproducibility. The underestimation of mean LVEDV (by 40%) and LVESV (by 38%) in our patients with past myocardial infarction is similar to that reported by Thomson (underestimated by 40 and 31%, respectively) 9 and Malm (32 and 30%, respectively). 8 The absolute difference in EF between MRI and NC-2DE was 5% in our work, compared with a 3–6% underestimation in other studies. 7–9
Contrast enhanced two-dimensional echocardiography and unenhanced three-dimensional echocardiography
The benefit of CE-2DE is consistent with previous reports, 7–9 although the improvement of LV volume estimation by CE-2DE, while clearly beneficial, was less impressive than in those publications. Although this is a single centre study, other multicentre studies have shown similar results for CE-2DE having a higher inter-observer agreement than NC-2DE. 18 , 19 The more accurate estimation of volumetric and EF data with CE-2DE, with greater proximity of mean values to MRI, and improved limits of agreement, was matched by NC-3DE in this study.
The similar results for NC-3DE and CE-2DE across a range of patients including those with poor resting images suggest that the effect of CE-2DE imaging may not just improve image quality. It is possible that LVO enables the sonographer to obtain superior image alignment with less foreshortening. The demonstration of a highly significant increase in measured cavity length in the LVO images lends weight to this explanation.
Contrast three-dimensional echocardiography
Previous reports suggested that the incremental benefit of LVO to 3DE was uncertain. Caini et al . 12 reported the use of LVO to actually increase the variation between 3DE and MRI, in a group of 14 patients selected with good resting images, using customized software interrogating the ventricle in only four long-axis planes. They hypothesized that excessive micro-bubble destruction was the cause and demonstrated that triggered 3DE could improve their results. 12 In our study, CE-3DE appeared superior to all other parameters, with mean absolute volumes <5% from MRI values. There was a 2% difference in mean EF with r = 0.89. Image acquisition in our study was performed during a mechanically controlled continuous infusion of contrast. For each 3DE image acquisition, the mechanical index and the rate of contrast infusion were strictly adjusted to minimize any bubble destruction in the apex. In addition, our off-line analysis was with commercially available software assessing the left ventricle in 12 long-axis planes, which should improve accuracy particularly as our patients all had resting wall motion abnormalities. 16 , 20
Limitations of each technique
LV volume measurements by NC-2DE have poor test–retest reliability, high inter-/intra-observer variability and underestimate MRI estimations of LV volumes. These limitations in NC-2DE are most likely attributable to inconsistent positioning of standard imaging views, resulting in a high percentage of off-axis images, with resultant variations in LV measurements. 21 The underestimation of LV volumes with 2DE is probably attributable to tangential imaging planes and fore-shortening, although the ‘bright blood’ display of the MRI images may increase the measured LV cavity size by filling the space between the trabeculae. Contrast enhancement using low mechanical index not only increases the visualization of the endocardial walls but allows improved assessment of wall motion abnormalities; however, it is subject to blooming and attenuation artefacts which may hinder volumetric assessment.
LVO may improve the visualization of the true apex. During CE-2DE, this allows the sonographer to follow the window to the longest LV cavity, therefore avoiding foreshortening of volumetric measures. During 3DE, this is less of a problem as long as the apex is included in the data-set. In the absence of contrast, 3DE avoids foreshortening and also avoids cut-plane variation and dependence on geometric assumptions. This study shows that each is similarly effective, but each has limitations. For technically difficult patients, the variability for CE-2DE and CE-3DE were similar, while NC-3DE had more variability, and was the only test in which image quality had a significant impact on accuracy. Although the analysis of CE-2DE is rapid, there is time and expertise required for insertion of an IV cannula, and machine settings should be optimized for contrast, preferably using low MI real-time imaging. 22 Conversely, although NC-3DE images can be rapidly acquired, analysis of volumes and EF (as performed in our study) is off-line, time-consuming and requires expertise. Although CE-3DE shares the limitations of both techniques, the results of this study demonstrate that this is the optimal echocardiographic technique for accurate assessment of LV volumes and EF.
The frame rate for CE (>20/s) may cause undersampling of volumes, leading to potential underestimation of EDV and over-estimation of ESV. Nonetheless, given that the images were obtained at rest, this puts a temporal resolution of <50 ms in the context of a cycle interval of 1000 ms. The temporal resolution of CE is similar to that obtained with MRI.
Clinical utility
Standard NC-2DE is a convenient technique for calculation of EF, as it is portable, requires no ‘specialized’ machine settings for acquisition, and volumetric calculations and EF can be assessed and reported rapidly. Where EF is sought for major decisions such as defibrillator implantation, all methods have sufficiently close approximation to MRI. However, when volumes are required, it appears that CE-3D is the only choice where the 95% CI fall within 5%. With respect to measurement reliability, as may be important for sequential testing, 3D techniques appear to be most reproducible.
Conclusion
CE-2DE is analogous to NC-3DE in accurate categorization of LV function. In this study of 50 patients, contrast 3DE appears to be the optimal echocardiographic technique to match with MRI. Confirmation of the feasibility and superiority of CE-3DE to other NC- and CE-techniques in patients with previous infarction should be considered in a multicentre study.
Funding
Funded in part by a project grant (G 04B 1475) from the National Heart Foundation, Melbourne, Australia. Optison was provided by Amersham Health Care, Little Chalfont, UK.
Conflict of interest: none declared.
References
Author notes
Joint first authors.

