


Abstract
In randomized clinical trials of patients undergoing percutaneous coronary intervention (PCI) for de novo small-vessel coronary artery disease (SV-CAD), paclitaxel-coated balloon (PCB) angioplasty showed mid-term angiographic or clinical non-inferiority to drug-eluting stent (DES) implantation. Nevertheless, these trials have sample size limitations, and the relative safety and efficacy beyond the first year remain uncertain.
The ANDROMEDA study was a collaborative, investigator-initiated, individual patient data meta-analysis comparing 3 year clinical outcomes between PCB angioplasty and DES implantation for the treatment of de novo SV-CAD. Multiple electronic databases (PubMed, Scopus, ScienceDirect, and Web of Science) were searched from May 2010 to June 2024 to identify eligible trials. All the following eligibility criteria were required: (i) random allocations of treatments; (ii) patients with SV-CAD; (iii) treatment with PCB or DES; and (iv) clinical follow-up of at least 36 months. The primary and co-primary endpoints were major adverse cardiac events (MACE) and target lesion failure (TLF), respectively. The protocol was registered with PROSPERO (CRD42023479035).
Individual patient data from three randomized trials, including a total of 1154 patients and 1360 lesions, were combined. At 3 years, PCB was associated with a lower risk of MACE compared with DES [hazard ratio (HR) 0.67, 95% confidence interval (CI) 0.47–0.96], due to a lower risk of myocardial infarction and target vessel revascularization. This benefit persisted after multivariable adjustment (HR 0.75, 95% CI 0.58–0.96), but did not reach statistical significance in the two-stage analysis (HR 0.67, 95% CI 0.43–1.04). At the landmark analysis, the risk of MACE between groups was consistent over time. At 3 years, TLF was not significantly different between PCB and DES groups. Reconstructed time-to-event information from a fourth trial was included in a sensitivity analysis (1384 patients and 1590 lesions), showing consistent results in terms of TLF (HR 0.87, 95% CI 0.63–1.20). The comparison between PCB and second-generation DES did not reveal significant differences in 3 year TLF (HR 1.03, 95% CI 0.70–1.50).
In patients undergoing PCI for de novo SV-CAD, PCB angioplasty is associated with a reduction in MACE and a non-significant difference in TLF at 3 year follow-up compared with DES implantation. The restriction of the comparator group to second-generation DES does not alter the main conclusions. Larger trials comparing contemporary devices at a more prolonged follow-up are warranted to confirm these findings.
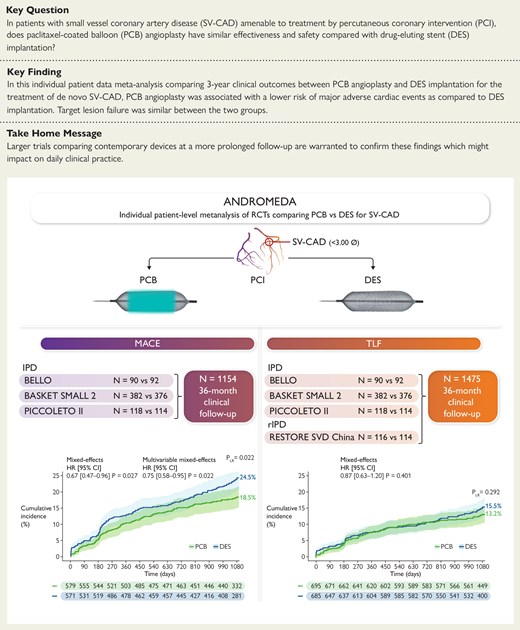
The Assessment of long-term clinical outcomes of de Novo DCB peRformance: a cOmprehensive, individual patient data Meta-Analysis of ranDomized clinical triAls (ANDROMEDA) study, an individual patient data meta-analysis of three randomized trials (1154 patients and 1360 lesions), compared 3 year outcomes of PCB angioplasty vs. DES implantation for the treatment of SV-CAD. Patients assigned to PCB showed a reduced risk of MACE compared with those assigned to DES. After adding reconstructed time-to-event individual patient data from a fourth trial, the analysis of the co-primary outcome of TLF did not show significant differences between treatment groups. CI, confidence interval; DES, drug-eluting stent; HR, hazard ratio; IPD, individual patient data; MACE, major adverse cardiac event; PLR, P-value of the log-rank test; PCB, paclitaxel-coated balloon; RCT, randomized clinical trial; rIPD, reconstructed time-to-event individual patient data; SV-CAD, small-vessel coronary artery disease; TLF, target lesion failure.
See the editorial comment for this article ‘Drug-coated balloons in small vessel de novo coronary artery disease: better than DES?’, by C. Lalani et al., https://doi.org/10.1093/eurheartj/ehaf083.
Introduction
The introduction of stents during percutaneous coronary intervention (PCI) aimed to overcome the occurrence of acute elastic recoil and seal flow–limiting dissections associated with plain balloon angioplasty.1,2 Drug-eluting stent (DES) implantation has been proven to be both safe and effective in reducing the incidence of device- and vessel-oriented adverse events, granting endorsement by current guidelines.3,4 However, the use of permanent metallic implants comes with some potential drawbacks, including the requirement for prolonged dual antiplatelet therapy with an inherent increase in haemorrhagic events, particularly in elderly patients and those deemed at high bleeding risk.5–8 Moreover, a constant risk of long-term stent-related complications (i.e. in-stent restenosis, stent thrombosis, and neoatherosclerosis) with an incidence rate of ∼2%–3% per stent per year, persisting beyond the first year, has been described with current-era devices.9–11
Drug-coated balloons (DCBs) enable a stent-free approach, which is particularly appealing in the context of small-vessel coronary artery disease (SV-CAD), where PCI with DES is hampered by an inverse relationship between the reference vessel diameter and the risk of developing restenosis,10,12 and it is estimated an almost two-fold higher risk of target lesion failure (TLF) at 1 year compared with the treatment of non-small vessels.13,14 In the setting of SV-CAD, paclitaxel-coated balloon (PCB) angioplasty has been associated with similar clinical outcomes compared with DES implantation.15–18 However, most of the available trials had insufficient power to assess clinical outcomes, and information about the long-term safety and efficacy of PCB for SV-CAD remains limited. Of note, in some studies, treatment with PCB was associated with a flattening of adverse events after 12 months, possibly related to the absence of permanent metallic implants and the positive remodelling process promoted by paclitaxel.19,20
Against this background, we conducted a comprehensive, collaborative meta-analysis of individual patient data from all available randomized clinical trials comparing PCB angioplasty with DES implantation in the setting of de novo SV-CAD with a clinical follow-up time of at least 36 months.
Methods
Study design and search strategy
The Assessment of long-term clinical outcomes of de Novo DCB peRformance: a cOmprehensive, individual patient data Meta-Analysis of ranDomized clinical triAls (ANDROMEDA) was an investigator-initiated, collaborative individual patient data meta-analysis of randomized clinical trials. ANDROMEDA was reported in keeping with the Preferred Reporting Items for Systematic reviews and Meta-Analyses of Individual Patient Data (PRISMA-IPD) recommendations, and the protocol was registered with PROSPERO (CRD42023479035).21 The study was not supported by extramural funding, and no device manufacturer or company with potential conflicts of interest was involved at any stage.
Multiple electronic databases (PubMed, Scopus, ScienceDirect, and Web of Science) and archives of major scientific societies and international conferences in the field were searched from May 2010 (the first randomized clinical trial on PCB angioplasty for de novo SV-CAD) to June 2024. Trials were deemed eligible for inclusion when all the following criteria were satisfied: (i) random allocations of treatments; (ii) patients with SV-CAD; (iii) treatment with PCB or DES; and (iv) clinical follow-up of at least 36 months. In light of the known heterogeneity in the definition of SV-CAD, an upper reference vessel diameter cut-off of 3.00 mm was used to identify trials on the topic. Trials testing protocol-driven interventional strategies combining DCB angioplasty and DES implantation with other devices were not eligible for inclusion. Except for SV-CAD, restrictions in terms of demographic, biometric, clinical, and angiographic conditions were not imposed. More details on the search strategy are reported in Supplementary data online. After excluding duplicates and merging the records, two investigators (S.F. and D.G.) screened the title and abstract of each report. The remaining potentially includable reports were screened by the same investigators (S.F. and D.G.) at the full-text level. Reports regarding different analyses of the same trial were combined.
The primary investigator of each eligible trial was invited to contribute to the ANDROMEDA study. Data extraction was conducted by the primary investigator of each trial. The variables of interest were selected at the study protocol stage based on clinical relevance and consistency with the original publications. Nevertheless, additional unpublished data, including baseline and procedural characteristics, clinical outcomes, and follow-up variations, were provided when available in the original databases. Before generating the pooled database, the variables of interest were validated by interactive cross-talk between the co-ordinating and collaborating centres. The final database was then generated and stored at the co-ordinating centre. Data supporting study findings are available from the corresponding author upon reasonable request.
The local institutional review boards approved all included trials at each participating centre, and all patients provided written informed consent before randomization. Clinical events and angiographic measurements in each trial were assessed by independent clinical events committees and core laboratories, respectively. The device manufacturers and medical companies with conflicts of interest had no involvement in any stage of the ANDROMEDA study, including decisions regarding data disclosure.
Before performing the statistical analysis, potential sources of bias were assessed by the Risk of Bias 2 tool.22 After completing the statistical analysis, the overall reliability of conclusions was assessed using the Grading of Recommendations, Assessment, Development and Evaluation (GRADE) approach.23
Endpoints
The primary endpoint was a composite of major adverse cardiac events (MACE) including all-cause mortality, myocardial infarction, target lesion thrombosis, or target vessel revascularization. The co-primary endpoint was TLF, a composite of cardiac death, myocardial infarction, or target lesion revascularization. The secondary endpoints included all-cause death, cardiac death, myocardial infarction, target lesion thrombosis, target lesion revascularization, and target vessel revascularization. The outcomes were assessed at a 3 year follow-up.
Death could be considered cardiac or non-cardiac depending on the cause; if the cause could not be clearly defined, the event was considered as cardiac.24 Myocardial infarction was defined according to the guidelines at the time of the study, it was determined based on clinical symptoms, the electrocardiogram, and cardiac biomarkers.24 The Academic Research Consortium criteria for definite or probable stent thrombosis were used to define target lesion thrombosis.24 Target lesion revascularization, percutaneous or surgical, included any repeat revascularization at the target lesion level.24
Statistical analysis
Categorical variables were reported as counts and percentages and compared by Pearson χ2 test or Fisher’s exact test, as appropriate. Continuous variables were summarized as means and standard deviations or medians and interquartile ranges, depending on their distribution, and compared by the Welch t-test or the Mann–Whitney–Wilcoxon U test, respectively. Outcomes were assessed as time-to-first events, primarily according to the intention-to-treat principle and secondarily to the per-protocol principle. In the primary analysis, the outcomes were estimated by one-stage mixed-effects Cox proportional hazards regression models, with treatment assignment as the fixed component and the random component with a random intercept allowing for a different baseline risk across trials and a random slope allowing treatment effect to vary across trials.25,26 The results were provided by hazard ratios (HRs) with 95% confidence interval (CI) and Wald-type test P-values. The proportional hazards assumption was tested by the Grambsch–Therneau test and Schoenfeld scaled residuals.26 Cumulative incidences calculated by the Kaplan–Meier method and comparisons of curves by the log-rank test complemented the primary analysis results.
In a sensitivity analysis, after generation of five databases by joint multiple imputation accounting for the multi-level structure of data, multivariable adjustment was performed by including age, gender, body mass index, diabetes, hypertension, hypercholesterolaemia, current smoking status, prior PCI, prior coronary artery bypass grafting, peripheral artery disease, left ventricular ejection fraction, clinical presentation, multivessel disease, bifurcation, device diameter, device length, and DES generation.27 The results across imputed databases were pooled by Rubin’s rules.27 In another sensitivity analysis, variations over time in the primary and co-primary endpoints were assessed by applying the landmark time point of 12 months. An additional sensitivity analysis was performed by using mixed-effects models with a stratified fixed intercept for the trial of origin and a random slope for the treatment effect across trials.
One-stage analyses were systematically replicated by two-stage sensitivity analyses, in which individual trial estimates were computed by Cox proportional hazards regression and subsequently pooled using random-effects models.28 Rare outcomes with monotonic distribution within individual trials were computed by Firth’s correction.29 Summary estimates and trial-related effects, along with the corresponding weights based on the inverse of variance, were illustrated by forest plots.28 Between-trials heterogeneity computed by the restricted maximum likelihood estimator was assessed by τ2 and I2 statistics and formally tested.28
Planned subgroup analyses for the primary safety and efficacy endpoints using the mixed-effects Cox model included subsets based on the median age (≤ or >67 years), gender, diabetes, acute or chronic coronary syndrome, estimated glomerular filtration rate <60 or ≥60 mL/min/1.73 m2, device diameter <2.50 or ≥2.50 mm, device length <20 or ≥20 mm, and DES generation. In the latter subgroup analysis, the DCB counterpart was included according to the DES generation used in the trial, and for Basel Stent Kosten Effektivitäts Trial Drug Eluting Balloons vs. Drug-Eluting Stents in Small Vessel Interventions (BASKET-SMALL 2), the specific period in which the type of DES was used. Interaction P-values were derived from one-stage mixed-effects models to properly account for the interaction between treatment effect and patient-level covariates.30 In the case of significant interaction, P-values were conservatively adjusted for multiplicity by the Benjamini–Hochberg method.31
Finally, the unavailability of the Assess the Efficacy and Safety of RESTORE Paclitaxel Eluting Balloon Versus RESOLUTE Zotarolimus Eluting Stent for the Treatment of Small Coronary Vessel Disease (RESTORE SVD China) trial was partially overcome by reconstructing individual patient time-to-event data for TLF from the digitized original Kaplan–Meier curves.32 The spatial co-ordinates, along with the number of events and numbers at risk between groups, were used to calculate the information of interest.32 Reconstructed data were combined by both one- and two-stage models to provide a comprehensive analysis including all available clinical trials on the topic.
Results
Details regarding the results of the search and screening of eligible trials are shown in Supplementary data online (see Supplementary data online, Tables S1 and S2, and Figure S1). The search process identified four prospective, randomized clinical trials eligible for inclusion in the ANDROMEDA study.15–19,33–35 The primary investigators of the Balloon Elution and Late Loss Optimization (BELLO), BASKET-SMALL 2, and Drug Eluting Balloon Efficacy for Small Coronary Vessel Disease Treatment (PICCOLETO II) adhered to the collaborative study and provided individual patient data.15,16,18,19,33,34 The primary investigator of the remaining trial (RESTORE SVD China) did not share individual patient data due to time restrictions on data transfer. Nevertheless, individual patient time-to-event data from the RESTORE SVD China trial35 for the outcome of TLF were reconstructed and pooled data by one- and two-stage analyses to provide a comprehensive analysis of the available evidence. The design and main characteristics of each trial and an overview of the study database completeness are reported in Table 1 and Supplementary data online, Tables S3 and S4. No relevant issues were identified when assessing individual patient data integrity.
Main characteristics of an available randomized clinical trial comparing PCB vs. DES for de novo SV-CAD
| Trial | Design | PCB | DES | Bail-out stenting | SV-CAD definition | Primary endpoint | Data availability |
|---|---|---|---|---|---|---|---|
| BELLO |
| n = 90 Drug: paclitaxel Excipient: urea | n = 92 Drug: paclitaxel Polymer: durable Alloy: stainless steel (97 μm) | 20% | RVD <2.80 mm | 6 month in-segment LLL (non-inferiority) | Individual patient data |
| BASKET-SMALL 2 |
| n = 382 Drug: paclitaxel Excipient: iopromide | n = 376 (28%/72%) Drug: paclitaxel/everolimus Polymer: durable/durable Alloy: stainless steel (97 μm)/cobalt-chromium (81 μm) | 5% | RVD 2.00–3.00 mm | 12 month MACE (non-inferiority) | Individual patient data |
| PICCOLETO II |
| n = 118 Drug: paclitaxel Excipient: dextran | n = 114 Drug: everolimus Polymer: durable Alloy: cobalt-chromium (81 μm) | 6.7% | RVD 2.00–2.75 mm | 6 month in-segment LLL (non-inferiority) | Individual patient data |
Individual patient data from the BELLO, BASKET-SMALL 2, and PICCOLETO II trials were available. The RESTORE SVD China was added for the co-primary endpoint of TLF after reconstructing time-to-event individual patient data.
ACS, acute coronary syndrome; CEC, clinical events committee; DS%, percentage diameter stenosis; LLL, late lumen loss; RVD, reference vessel diameter.
A total of 1154 patients (1360 lesions) randomly assigned to PCB angioplasty (582 patients and 663 lesions) or DES implantation (572 patients and 697 lesions) were combined. The baseline clinical characteristics were generally balanced between groups, except for the younger age at the time of PCI of patients assigned to PCB compared with those assigned to DES (Table 2). Although angiographic differences were not significant, some procedural differences were noted (Table 3). In more detail, in the DCB group, predilatation was performed more frequently (98.9% vs. 93.4%; P < .001) and selecting larger balloons [2.5 (2.0–2.5) vs. 2.2 (2.0–2.5) mm; P = .030] than in the DES group. Moreover, DCBs were longer [20.0 (15.0–26.0) vs. 18.0 (15.0–23.0) mm; P < .001] and inflated at a lower pressure [10.0 (8.0–14.0) vs. 14.0 (12.0–14.0) atm; P < .001] and for a longer time (50.0 (30.0–60.0) vs. 20.0 (10.0–30.0) s; P < .001) compared with DES.
Patient-level clinical characteristics
| Total (n = 1154) | PCB (n = 582) | DES (n = 572) | P | |
|---|---|---|---|---|
| Age (years) | 67.0 (60.0–75.0) | 66.0 (59.0–74.0) | 68.0 (60.8–75.0) | .021 |
| Female | 278 (24.2) | 126 (21.8) | 152 (26.6) | .055 |
| Body mass index (kg/m2) | 27.6 (25.0–30.5) | 27.8 (25.2–30.8) | 27.4 (24.8–30.3) | .079 |
| Diabetes | 412 (35.9) | 207 (35.8) | 205 (36.1) | .904 |
| Oral therapy alone | 258 (22.5) | 122 (21.1) | 136 (23.9) | |
| Insulin | 154 (13.4) | 85 (14.7) | 69 (12.1) | |
| Hypertension | 960 (83.6) | 477 (82.2) | 483 (84.9) | .227 |
| Dyslipidaemia | 803 (70.2) | 407 (70.3) | 396 (70.1) | .940 |
| Current smoking | 225 (19.9) | 123 (21.5) | 102 (18.1) | .153 |
| Family history of CAD | 362 (33.5) | 195 (35.5) | 167 (31.4) | .151 |
| Prior PCI | 684 (61.6) | 346 (61.3) | 338 (61.8) | .879 |
| Prior coronary artery bypass grafting | 100 (9.0) | 50 (8.9) | 50 (9.1) | .887 |
| Peripheral artery disease | 108 (9.7) | 52 (9.2) | 56 (10.2) | .567 |
| Left ventricular ejection fraction | .061 | |||
| Normal | 764 (82.7) | 377 (80.0) | 387 (85.4) | |
| Mild-moderate reduction | 147 (15.9) | 88 (18.7) | 59 (13.0) | |
| Severe reduction | 13 (1.4) | 6 (1.3) | 7 (1.5) | |
| Moderate-severe chronic kidney disease | 172 (15.5) | 81 (14.5) | 91 (16.6) | .331 |
| eGFR (mL/min/1.73 m2) | 84.9 (69.1–96.6) | 85.5 (69.3–97.5) | 83.9 (68.8–96.0) | .192 |
| Clinical presentation | .290 | |||
| Silent ischaemia-stable angina | 817 (71.2) | 407 (70.3) | 410 (72.1) | |
| Unstable angina | 161 (14.0) | 85 (14.7) | 76 (13.4) | |
| NSTEMI | 155 (13.5) | 76 (13.1) | 79 (13.9) | |
| STEMI | 15 (1.3) | 11 (1.9) | 4 (0.7) | |
| Multivessel CAD | 872 (76.6) | 452 (78.7) | 420 (74.5) | .088 |
The variables are medians (interquartile ranges) or counts (proportions). The information is reported at the patient level.
eGFR, estimated glomerular filtration rate; NSTEMI, non–ST-segment elevation myocardial infarction; STEMI, ST-segment elevation myocardial infarction.
Lesion-level angiographic and procedural characteristics
| Total (n = 1360) | PCB (n = 663) | DES (n = 697) | P | |
|---|---|---|---|---|
| Target vessel | .152 | |||
| Left main | 1 (0.1) | 0 (0) | 1 (0.2) | |
| Left anterior descending | 389 (33.9) | 204 (36.6) | 185 (31.3) | |
| Left circumflex | 508 (44.3) | 240 (43.1) | 268 (45.3) | |
| Right coronary artery | 250 (21.8) | 113 (20.3) | 137 (23.2) | |
| Bifurcation | 29 (2.2) | 15 (2.3) | 14 (2.1) | .750 |
| Predilatation | 1246 (96.1) | 620 (98.9) | 626 (93.4) | <.001 |
| Maximum predilatation balloon diameter (mm) | 2.2 (2.0–2.5) | 2.5 (2.0–2.5) | 2.2 (2.0–2.5) | .030 |
| Device diameter (mm) | 2.5 (2.2–2.5) | 2.5 (2.2–2.5) | 2.5 (2.2–2.5) | .403 |
| Device diameter groups | .094 | |||
| ≤2.25 mm | 375 (27.9) | 171 (26.2) | 204 (29.6) | |
| 2.50 mm | 725 (54.0) | 366 (56.0) | 359 (52.1) | |
| 2.75 mm | 200 (14.9) | 90 (13.8) | 110 (16.0) | |
| ≥3.00 mm | 42 (3.1) | 26 (4.0) | 16 (2.3) | |
| Device length (mm) | 20.0 (15.0–23.0) | 20.0 (15.0–26.0) | 18.0 (15.0–23.0) | <.001 |
| Device length ≥20 mm | 702 (52.3) | 448 (68.7) | 254 (36.9) | <.001 |
| Device inflation (atm) | 12.0 (10.0–14.0) | 10.0 (8.0–14.0) | 14.0 (12.0–14.0) | <.001 |
| Inflation time (s) | 30.0 (20.0–60.0) | 50.0 (30.0–60.0) | 20.0 (10.0–30.0) | <.001 |
The variables are medians (interquartile ranges) or counts (proportions). The information is reported at the lesion level.
Primary and co-primary endpoints
At 3 year follow-up, MACE occurred in 103 patients assigned to PCB angioplasty and 132 assigned to DES angioplasty resulting in a significant difference by one-stage analysis (18.5% vs. 24.5%; HR 0.67, 95% CI 0.47–0.96, P = .027; Table 4; Figure 1). The difference remained consistent after multivariable adjustment (HR 0.75, 95% CI 0.58–0.96, P = .022; Table 4; Figure 1). No significant heterogeneity between 0–1 and 1–3 years was observed (Pint = .692; Table 4; Figure 1). The two-stage analysis showed differences in MACE between the PCB and DES groups that did not reach the threshold of statistical significance (HR 0.67, 95% CI 0.43–1.04; P = .074; Table 5; Figure 1). The contribution to the summary estimate of the individual trials was overall reasonably balanced, though the BASKET-SMALL 2 weight was higher than that of the other trials (43.8%; Figure 1). Moderate-to-high between-trial heterogeneity was detected (τ2 = 0.085; I2 = 57.5%; P = .095; Figure 1). The one-stage (HR 0.64, 95% CI 0.41–0.99, P = .047) and two-stage per-protocol analyses were consistent with the primary analyses (see Supplementary data online, Tables S5 and S6).
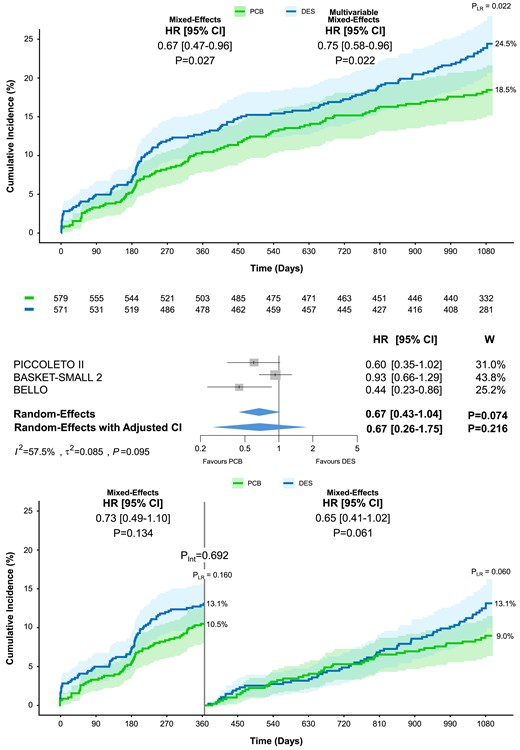
Major adverse cardiac events at 3 year follow-up. Cumulative incidence of major adverse cardiac events including all-cause death, myocardial infarction, and/or target vessel revascularization, in patients allocated to paclitaxel-coated balloon vs. drug-eluting stent. The upper panel shows the results of the one-stage analysis on top and the two-stage analysis below. The lower panel displays the landmark analysis performed at 12 months. The numbers of patients at risk between the treatment groups across the time intervals are shown below the graph. Pint, P-value of the test for interaction; PLR, P-value of the log-rank test; W, weight
Outcomes at 3 year follow-up—intention-to-treat one-stage analysis
| Outcomes | PCB (n = 582) | DES (n = 572) | PLR | Mixed-effects model | Multivariable mixed-effects model | ||||
|---|---|---|---|---|---|---|---|---|---|
| Events | % | Events | % | HR (95% CI) | P | HR (95% CI) | P | ||
| MACE | 103 | 18.5 | 132 | 24.5 | .022 | 0.67 (0.47–0.96) | .027 | 0.75 (0.58–0.96) | .022 |
| TLF | 81 | 14.7 | 93 | 17.6 | .239 | 0.78 (0.55–1.12) | .185 | 0.86 (0.64–1.15) | .304 |
| Death | 35 | 6.3 | 36 | 6.7 | .851 | 0.90 (0.56–1.47) | .682 | 0.98 (0.62–1.55) | .934 |
| Cardiac death | 21 | 3.8 | 14 | 2.7 | .261 | 1.78 (0.82–3.88) | .144 | 1.91 (0.94–3.90) | .075 |
| Myocardial infarction | 25 | 4.7 | 42 | 7.8 | .026 | 0.58 (0.35–0.94) | .029 | 0.52 (0.31–0.85) | .009 |
| Target lesion thrombosis | 2 | 0.4 | 9 | 1.7 | .032 | 0.22 (0.05–1.00) | .051 | 0.20 (0.04–0.96) | .044 |
| Target lesion revascularization | 41 | 7.6 | 52 | 10.1 | .203 | 0.73 (0.47–1.13) | .163 | 0.84 (0.57–1.24) | .382 |
| Target vessel revascularization | 60 | 11.1 | 82 | 15.6 | .038 | 0.66 (0.45–0.97) | .035 | 0.65 (0.45–0.93) | .020 |
Major adverse cardiac event includes all-cause death, myocardial infarction, or target vessel revascularization. Target lesion failure includes cardiac death, myocardial infarction, or target lesion revascularization.
MACE, major adverse cardiac events; TLF, target lesion failure; PLR, log-rank test P-value.
Outcomes at 3 year follow-up—intention-to-treat two-stage analysis
| Outcomes | Random-effects | Heterogeneity | |||
|---|---|---|---|---|---|
| HR (95% CI) | P | I2 | τ2 | PQ | |
| MACE | 0.67 (0.43–1.04) | .074 | 57.5 | 0.085 | .095 |
| TLF | 0.77 (0.49–1.21) | .258 | 43.9 | 0.071 | .168 |
| Death | 0.96 (0.60–1.54) | .880 | 0 | 0 | .557 |
| Cardiac death | 1.40 (0.71–2.77) | .328 | 0 | 0 | .764 |
| Myocardial infarction | 0.51 (0.24–1.08) | .078 | 35.2 | 0.187 | .214 |
| Target lesion thrombosis | 0.28 (0.06–1.18) | .082 | 0 | 0 | .639 |
| Target lesion revascularization | 0.77 (0.51–1.17) | .220 | 0 | 0 | .518 |
| Target vessel revascularization | 0.70 (0.48–1.01) | .054 | 4.3 | 0.015 | .352 |
Major adverse cardiac event includes all-cause death, myocardial infarction, or target vessel revascularization. Target lesion failure includes cardiac death, myocardial infarction, or target lesion revascularization.
MACE, major adverse cardiac events; TLF, target lesion failure; PLR, log-rank test P-value; PQ, P-value of the heterogeneity test.
At 3 year follow-up, TLF occurred in 81 patients assigned to PCB angioplasty, and 93 assigned to DES angioplasty resulting in a non-significant difference by one-stage analysis (14.7% vs. 17.6%; HR 0.78, 95% CI 0.55–1.12, P = .185; Table 4; Figure 2). This result remained consistent after multivariable adjustment (HR 0.86, 95% CI 0.64–1.15, P = .304) and no significant heterogeneity between the periods from 0 to 1 year and 1 to 3 years was observed (Pint = .667; Table 4; Figure 2). The two-stage analysis did not show significant differences in TLF between the PCB and DES groups (HR 0.77, 95% CI 0.49–1.21; Table 5; Figure 2). The contribution to the summary estimate of the individual trials was overall reasonably balanced, though the BASKET-SMALL 2 weight was higher than that of the other trials (48.1%; Figure 2). Moderate between-trial heterogeneity was detected (τ2 = 0.071; I2 = 43.9%; P = .168; Figure 2). The one-stage (HR 0.70, 95% CI 0.41–1.19, P = .190) and two-stage per-protocol analyses were consistent with the primary analyses (see Supplementary data online, Tables S5 and S6).
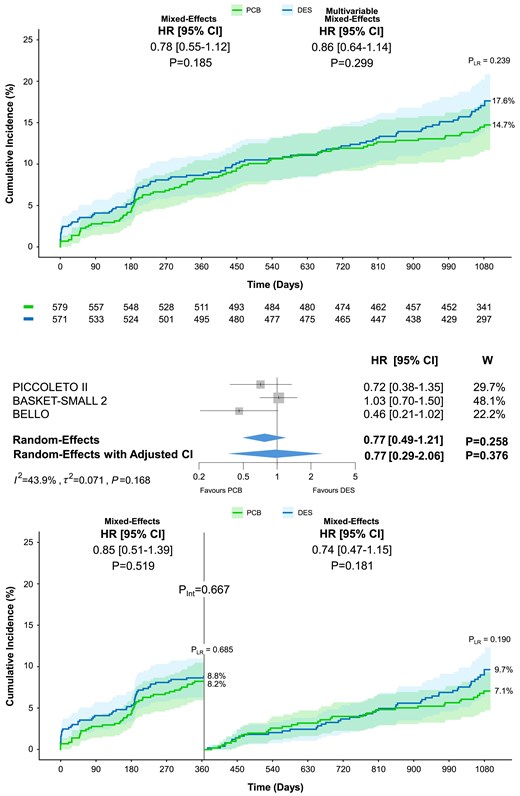
Target lesion failure at 3 year follow-up. Cumulative incidence of the co-primary endpoint of target lesion failure including cardiac death, myocardial infarction, or target lesion revascularization in patients allocated to paclitaxel-coated balloon or drug-eluting stent. The upper panel shows the results of the one-stage analysis on top and the two-stage analysis below. The lower panel displays the landmark analysis performed at 12 months. The numbers of patients at risk between the treatment groups across the time intervals are shown below the graph. Pint, P-value of the test for interaction; PLR, P-value of the log-rank test; W, weight
The pre-specified analysis of major clinical and angiographic subgroups for MACE and TLF revealed a significant interaction between treatment effects and median age (Pint = .037 and Pint = .036, respectively; Figure 3). Specifically, the benefit of PCB was driven by the subgroup of patients younger than 67 years (MACE: HR 0.55, 95% CI 0.38–0.81, P = .002; TLF: HR 0.62, 95% CI 0.40–0.96, P = .031; Figure 3). Yet, after adjusting for repeated statistical testing, the interaction P-value in both subgroup analyses was no longer significant (0.296 and 0.288, respectively).
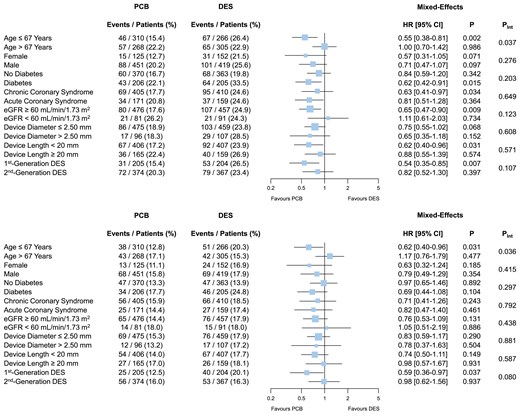
Subgroup analyses for major adverse cardiac event and target lesion failure at 3 year follow-up. Major adverse cardiac event (upper panel) includes all-cause death, myocardial infarction, or target vessel revascularization. Target lesion failure (lower panel) includes cardiac death, myocardial infarction, or target lesion revascularization. After adjusting for repeated statistical testing, the interaction P-value for median age in both analyses was no longer significant (0.296 and 0.288, respectively). Pint, P-value of the test for interaction
Beyond the conclusions in terms of treatments, multivariable analyses for MACE and TLF at 3 year follow-up showed that diabetes and multivessel disease were significant independent predictors (see Supplementary data online, Tables S7 and S8). In the analysis for MACE, current smoking status, admission for non–ST-segment elevation myocardial infarction, and device length showed significant associations (see Supplementary data online, Table S7). The one-stage analysis with alternative modelling (stratified fixed intercept and random slope) showed consistent results (see Supplementary data online, Table S9).
Secondary endpoints
At 3 year follow-up, all-cause and cardiac death were not significantly different between groups across analyses (Tables 4 and 5; see Supplementary data online, Tables S5 and S6). By one-stage analysis, significant reductions in myocardial infarction (4.7% vs. 7.8%; HR 0.58, 95% CI 0.35–0.94, P = .029; HR 0.52, 95% CI 0.31–0.85, P = .009) and target vessel revascularization (11.1% vs. 15.6%; HR 0.66, 95% CI 0.45–0.97, P = .035; HR 0.65, 95% CI 0.45–0.93, P = .020) were observed (Table 4; Figure 1). By two-stage and per-protocol analyses, the differences in myocardial infarction and target vessel revascularization did not reach the threshold of statistical significance (Table 5; see Supplementary data online, Tables S5 and S6). Target lesion thrombosis was significantly reduced in the PCB group compared with the DES group at the one-stage multivariable analysis (HR 0.20, 95% CI 0.04–0.96, P = .044) and per-protocol analyses. The difference did not reach the threshold of statistical significance in the other analyses (Tables 4 and 5; see Supplementary data online, Tables S5 and S6). Target lesion revascularization did not significantly differ between treatment groups across analyses.
Comprehensive assessment of the available evidence and impact of drug-eluting stent generation
After including RESTORE SVD China reconstructed time-to-event individual patient data for the endpoint of TLF, a total of 1384 patients (1590 lesions) were included (Table 1). At 3 years, no significant difference in TLF was detected between PCB and DES groups, regardless of the model employed (13.2% vs. 15.5%; one stage: HR 0.87, 95% CI 0.63–1.20, P = .401; two stage: HR 0.85, 95% CI 0.60–1.19, P = .347; two stage with adjusted CI: HR 0.85, 95% CI 0.48–1.51, P = .432) (Figure 4).
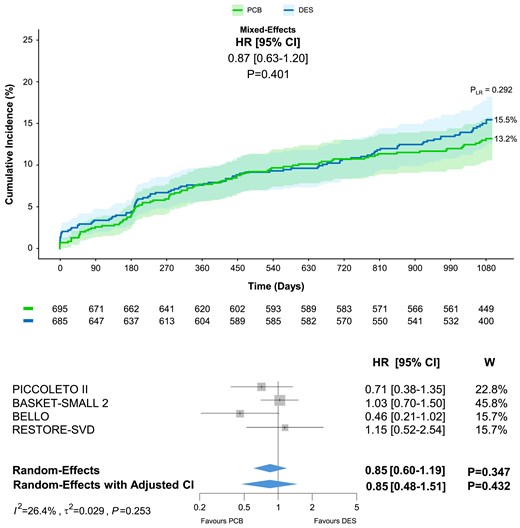
Target lesion failure at 3 year follow-up with inclusion of reconstructed time-to-event individual patient data from the RESTORE SVD China trial. Target lesion failure includes cardiac death, myocardial infarction, or target lesion revascularization. PLR, P-value of the log-rank test; W, weight
The assessment of the influence of device generation in the DES arm showed a significant reduction of TLF with second-generation DES compared with first-generation DES, and the result remained consistent after accounting for repeated statistical testing (13.3% vs. 20.1%; HR 0.59, 95% CI 0.36–0.95, Padj = .043). Nevertheless, the comparison between DCB and second-generation did not reveal significant differences (13.0% vs. 13.3%; HR 1.03, 95% CI 0.70–1.50, P = .898; see Supplementary data online, Figure S2).
Assessment of bias and reliably of results
The qualitative assessment of trials did not reveal serious concerns, though the impossibility of masking the assignment to PCB and DES due to intrinsic differences between devices implied a possible source of bias (see Supplementary data online, Figure S3).
The assessment of the available evidence by the GRADE system showed a moderate or high overall quality, depending on the outcome of interest (see Supplementary data online, Table S10).
Discussion
The main analysis of the ANDROMEDA study shows that 3 years following PCI for SV-CAD, patients treated with PCB experience a significantly lower incidence of MACE compared with those treated with DES (Structured Graphical Abstract). This result was mainly driven by lower incidences of myocardial infarction and target vessel revascularization. The 3-year incidence of TLF between treatment groups was not significantly different (Structured Graphical Abstract). Notably, the landmark analysis suggested consistent effects between PCB and DES over time and sensitivity analyses did not reveal significant differences in MACE and TLF between PCB and second-generation DES.
Traditionally, SV-CAD is regarded as a challenging PCI setting due to the established inverse relationship between target vessel segment diameter and restenosis at follow-up.10,12 Despite substantial advances in stent technologies and procedural optimization, patients undergoing PCI with second-generation DES for SV-CAD continue to exhibit a 1 year risk of TLF almost two-fold higher than those treated for lesions in coronary artery segments with larger diameter.13,14,36 Against this background, the ANDROMEDA study strengthens previous evidence on SV-CAD by showing in the primary analysis a relative risk reduction in 3-year MACE of up to 33% in patients treated with PCB compared with those treated with DES. This result fits the ‘leave nothing behind’ rationale of PCB angioplasty. The avoidance of permanent metallic implants along with the effective delivery of paclitaxel mitigates several typical histopathologic mechanisms of DES-based PCI failure such as an exaggerated neointimal proliferation in the first months following PCI, the destabilization of neoatherosclerosis over the years following PCI, and pro-thrombotic conditions such as incomplete stent re-endothelialization.9,37–39 These possible unfavourable patterns of PCI failure after DES implantation can be responsible for acute myocardial infarction due to in-stent restenosis, vulnerable plaque destabilization in the context of in-stent neoatherosclerosis, and intra-luminal thrombosis triggered by the contact between blood and non-endothelialized metallic struts.9,37–39 Moreover, PCBs have demonstrated positive late vessel remodelling effects after treatment of de novo lesions in nearly 60% of the cases, often resulting in negligible angiographic late lumen loss.40–43 This advantageous effect may be particularly beneficial in SV-CAD. The higher rates of restenosis and thrombosis associated with DES implantation may also provide a reasonable explanation for the decreased 3-year incidence of target vessel revascularization in patients assigned to PCB angioplasty (crude absolute rate difference of 4.5%), resulting in a significant difference by one-stage analysis. However, it is also necessary to report that differences were vulnerable to the statistical model used likely reflecting the need for more data to assess whether PCB angioplasty is superior to DES implantation in treating SV-CAD.
The complementary key conclusion of the ANDROMEDA study is the absence of significant differences between PCB and DES in the co-primary endpoint of TLF, regardless of the model employed. After pooling all available evidence from randomized trials by the inclusion of reconstructed patient-level time-to-event data from the RESTORE SVD China trial, the results remained consistent by both one- and two-stage analyses. In addition, landmark analyses showed similar trends between PCB angioplasty and DES implantation in the periods from PCI to 1 year and 1–3 years, indicating consistent effects over time. Yet, the potential higher biocompatibility associated with PCB angioplasty vs. DES implantation may require a more prolonged observation, and in other settings some signals of improved safety were detected only at a very late follow-up.44 Additionally, the role of DES generation influenced general conclusions, as we found higher 3-year TLF in patients who received first-generation DES compared with those who received PCB and second-generation DES. The absence of significant differences in TLF between patients assigned to PCB and those assigned to second-generation DES is another major finding of the ANDROMEDA study.
Some concerns about increased mortality following paclitaxel application in peripheral interventions were raised by a previous meta-analysis.45 However, more recently, several studies and, updated metanalyses on both peripheral and coronary applications of DCB, have dismissed this initial cause of concern.20,44,46,47 Our study further confirms no association between all-cause mortality and paclitaxel use in the coronary field, and no significant difference in mortality between the DCB and DES groups.
In the ANDROMEDA study, the assessment of heterogeneity generally showed moderate between-trial differences due to more neutral effects associated with the BASKET-SMALL 2 trial compared with those associated with the BELLO and PICCOLETO II trials. In the comprehensive assessment of the available evidence in terms of 3-year TLF, the RESTORE SVD trial showed effects more consistent with the BASKET-SMALL 2 trial, and the quantification of between-trial differences produced statistics indicating only mild heterogeneity. In addition, a subgroup analysis for MACE and TLF according to median age at the time of PCI showed a significant treatment-by-subgroup interaction. Importantly, regardless of the presence of an interaction, multivariable one-stage analyses including age did not reveal inconsistency compared with standard one-stage analyses.
The recently published REC-CAGEFREE I trial, the largest available randomized clinical comparing PCB angioplasty with rescue stenting vs. intended DES implantation for the treatment of de novo any-reference vessel diameter coronary lesions, did not demonstrate non-inferiority of PCB-based PCI compared with DES-based PCI in terms of the primary composite endpoint of cardiovascular death, target vessel myocardial infarction, or clinically or physiologically indicated target lesion revascularization at 2-year follow-up.48 The difference between treatments was mainly driven by an excess in clinically or physiologically indicated target lesion revascularization.48 However, a major subanalysis involving patients with SV-CAD (45.4%) showed no significant difference in the primary composite endpoint between the PCB and DES groups (5.1% vs. 4.4%; HR 1.17, 95% CI 0.67–2.05).48 Of note, the assessment of treatment-by-subgroup interaction with patients without SV-CAD showed a significant effect (P = .020), indicating a possible major influence of reference vessel diameter on PCB effectiveness.
Finally, the ANDROMEDA study included only patients undergoing PCB angioplasty. The present results may therefore not apply to sirolimus-coated balloons. Preliminary investigations with this newer class of devices showed mixed conclusions, and ongoing large-scale randomized clinical trials including patients with SV-CAD, such as TRANSFORM II (NCT04893291)49 and SELUTION (NCT05946629),50 will provide more conclusive evidence regarding sirolimus-coated balloons.
Limitations
The ANDROMEDA study presents some limitations that should be considered when interpreting the main results. First, except BASKET-SMALL 2, the other available trials involved a 6–9-month angiography follow-up to assess the primary surrogate endpoint.15–19,33–35 However, in the ANDROMEDA study, landmark analyses showed that the outcomes of MACE and TLF between treatment groups did not significantly differ between the periods before and after 1 year. Second, the definition of SV-CAD showed some differences across trials, with an upper limit of the reference vessel diameter of target lesions ranging from 2.75 to 3.00 mm.15–19,33–35 Nevertheless, in the ANDROMEDA study, the proportion of patients with reference vessel diameter ≤2.50 mm was predominant (>80%), and subgroup analyses for MACE and TLF showed no significant influence of reference vessel diameter on the outcomes between treatment groups. Third, the use of different DES generations across trials introduced heterogeneity, and it is plausible that some advantages associated with PCB are influenced by the lower effectiveness of first-generation DES. Indeed, 31% of patients assigned to DES across the available trials received a first-generation device. Despite this limitation, the subgroup analyses for MACE and TLF and a comprehensive three-group analysis (PCB, first-generation DES, and second-generation DES) of 3 year TLF did not reveal significant differences between PCB angioplasty and second-generation DES, before and after adjustment for repeated pairwise comparisons. Fourth, a low proportion of patients underwent functionally or intravascular imaging-guided PCI, and a systematic invasive functional assessment of the target lesion would have more robustly outlined the clinical significance of SV-CAD, subtending in some circumstances small ischaemic areas of myocardium.15–19,33–35 Yet, the setting of SV-CAD involves high proportions of target lesions located in secondary epicardial branches or distal vessel segments in which employing complementary techniques for guiding and optimizing PCI is often challenging or unfeasible.51,52 Finally, the RESTORE SVD China trial was not fully available due to time restrictions on data transfer. However, we partially overcome this limitation by reconstructing time-to-event individual patient data for TLF from the original Kaplan–Meier curves and performing both one- and two-stage analyses. Of note, the comprehensive pooling of available evidence on PCB angioplasty vs. DES implantation for SV-CAD from randomized trials showed no significant difference between treatment groups.
Conclusions
In patients undergoing PCI for de novo SV-CAD, PCB angioplasty is associated at 3 year follow-up with a reduced risk of MACE and a non-significant difference in TLF compared with DES implantation. The restriction of the comparator group to second-generation DES does not alter the main conclusions. Larger trials comparing contemporary devices at a more prolonged follow-up are warranted to assess whether in the setting of SV-CAD DCB angioplasty improves cardiovascular outcomes compared with DES implantation.
Supplementary data
Supplementary data are available at European Heart Journal online.
Declarations
Disclosure of Interest
All authors declare no disclosure of interest for this contribution.
Data Availability
The data that support the findings of this study are available from the corresponding author upon reasonable request.
Funding
All authors declare no funding for this contribution.
Ethical Approval
The local institutional review boards approved all included trials at each participating centre, and all patients provided written informed consent before randomization. Clinical events and angiographic measurements in each trial were assessed by independent clinical events committees and core laboratories, respectively.
Pre-registered Clinical Trial Number
ANDROMEDA was registered with PROSPERO (CRD42023479035).
References
Author notes
Simone Fezzi and Daniele Giacoppo contributed equally to the study.

