


Abstract
This article examines the impact of balance of political power between farmer and intermediary members on profit and risk sharing within intermediary-led agricultural cooperatives in China. The article develops a theoretical model that demonstrates how an intermediary-led cooperative, featuring a two-stage operation with on-farm production by farmer members and value-added processing by the cooperative, allocates profits and manages risks through a sharing rule that includes procurement prices and patronage refund ratios. The results indicate that as farmers gain political influence, their profit share increases, but they also assume more risk, leading to constrained supply and reinforced cooperative monopoly power. Empirical observations from a survey of cooperatives in China, where local officials and elites commonly act as intermediaries, support the model’s findings. Elite-led cooperatives, where intermediaries hold more power, are less likely to provide patronage refunds and more likely to engage in risky, value-added businesses compared to official-led cooperatives, where farmershave stronger representation. Our findings offer insights into the sustainable growth of cooperatives in developing countries.
1. Introduction
The global agricultural and food sector is experiencing higher market volatility driven by climate change and uncertain trading situations (Bellemare, 2015). To cope with the challenge, stakeholders in the agri-food supply chain are enhancing coordination between farmers and downstream processors and retailers (Bellemare and Bloem, 2018). Where farmers lack power in negotiations with other supply chain participants, agricultural cooperatives (co-ops) play an important role in facilitating market access and strengthening their bargaining power. In developing countries, co-ops have been recognized by national governments as essential institutional arrangements for improving the welfare of farmers (Food and Agriculture Organization, 2012). For example, the Chinese government has played a pivotal role in promoting the formation and development of agricultural co-ops. Between 2010 and 2015, the Chinese government has provided more than 25 billion yuan worth of financial supports to agricultural co-ops, and the number of co-ops has grown from 26,000 to over 2 million in 2024 (Zhong, Jiang and Yuheng, 2023).
However, establishing a co-op solely with smallholders can be difficult in modern agriculture due to limited startup capital and other resources (Van Bekkum and Dijk, 1997). To address this, the 2007 Chinese Cooperative Law (revised in 2018), permits agribusiness entities to become co-op members. This policy shift has led to the prevalence of intermediary-led co-ops, wherein intermediaries, such as local officials and village elites, guide smallholders in forming and managing co-ops. Intermediary-led co-ops often feature centralized governance structures where control rights are proportional to equity contributions (Jia and Huang, 2011). Consequently, small farmers typically relinquish significant control to elite co-op members, a stark contrast to the democratic voting systems seen in many Western co-ops (Ma and Zhu, 2020).
The inherent heterogeneity among members who vote based on their individual interests has been a common challenge for co-ops (Cook, Chaddad and Iliopoulos, 2004; Staatz, 1983). And the relative political power among members also becomes a significant factor in co-op’s business decisions in the absence of democratic voting. For example, in Indian sugar cooperatives, larger farmers have been observed to exploit smaller farmers by manipulating procurement prices (Banerjee et al., 2001). Similarly, in China, the leadership type—whether village elites or government officials—shapes the co-op’s priorities and profit distribution. While elite-led co-ops may prioritize market access and capital returns, official-led co-ops often emphasize farmer welfare and poverty alleviation (Hazell, 2005; Ebata and Hernandez, 2016). In fact, external financial support for agricultural co-ops is not uncommon in developing countries, but whether it can lead to sustainable development of co-ops is unclear (Michalek et al., 2018, Binswanger and Sillers, 1983).
In this article, we develop a unified theoretical framework that integrates the relative political power between farmer members and intermediary members and examines how profits and risks are shared within intermediary-led co-ops. The model features a representative risk-averse farmer forming a marketing co-op with a risk-neutral intermediary. The intermediary processes raw products from the farmer and sells the finished goods in a volatile downstream market. The co-op must set profit and risk-sharing rules beforehand, including the procurement price and the payout ratio for the co-op’s profit. We complement our theoretical model with a unique survey data conducted in three key agricultural provinces in China: Inner Mongolia, Shandong, and Ningxia. We investigate how profit distribution may differ based on the leadership of intermediary-led co-ops, specifically official-led co-ops, farmer co-ops and elite-led co-ops.
The model predicts that when the intermediary holds predominant control over the co-op, it leads to a reduced procurement price, resulting in limited distribution of profits to farmers. This enables the intermediary to capture all the profits from value-added activities. This outcome aligns with empirical observations of practices in elite-led co-ops. However, when farmers exert greater political power, akin to the st1ructure of official-led co-ops, the procurement price increases, and a portion of the co-op’s profit is shared with the farmers. This finding emphasizes the importance of a risk-taking intermediary in facilitating farmers’ access to value-added markets despite inherent risks.
This paper contributes to the current literature in three key aspects. First, our theoretical model addresses both profit and risk-sharing rules, exploring how these mechanisms evolve in response to shifts in the political power balance between co-op members. By demonstrating how co-ops can leverage their market power to balance member welfare and operational feasibility in a risky market environment, this research enhances the understanding of co-op business development, particularly in intermediary-led structures. Second, using an extensive survey of Chinese agricultural co-ops, we reveal how variations in leadership—whether official-led, elite-led, or farmer-led—shape engagement in risky business ventures. These differences in leadership influence the co-op’s profit distribution strategies, particularly in terms of patronage refunds and dividends, aligning with theoretical predictions regarding political power dynamics. Third, this analysis on collective action between upstream farmers and downstream intermediaries within a cooperative contributes to the literature on vertical integration. Our findings illustrate how shifts in relative political power between these two parties reflect varying degrees of vertical integration. The results provide valuable insights into how the sharing rules between vertically related parties adapt to differing levels of integration, offering practical implications for designing sustainable and equitable co-op structures in volatile markets.
The remainder of the paper is structured as follows. In the next section, we characterize a model between intermediaries and farmers, and solve for the equilibrium procurement prices and the co-op’s earning payout ratio as a function of relative political power between the two groups. We then summarize key features of 187 Chinese agricultural cooperatives in 2020. Finally, we discuss the model’s implications for co-ops’ sustainable organizational structures.
2. Basic setting
We considered a cooperative consisting of two kinds of members: risk-averse farmers, who can produce agricultural products but have no access to the market, and risk-neutral intermediaries,1 who are main equity contributors to transform agricultural products into tradable goods and sell them in the final market, which is risky.2 In addition, farmers and intermediaries may have different political powers within the co-op. We first investigated how the co-op designs the sharing rule to balance the interests of different members, share the market risk, and help to exercise the market power. We then examined how political power shifts may affect the design of the sharing rule and eventually influence the co-op’s sustainability.
To facilitate exploitation, we explore the behavior of a representative farmer dealing with an intermediary who is the main equity contributor of the co-op. Assume that the farmer produces quantity
The downstream market is risky, and the inverse demand
The return
Figure 1 illustrates how the co-op’s gross expected revenue, i.e.
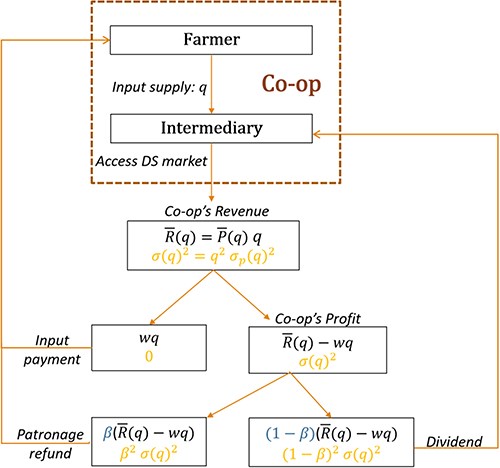
Profit and risk sharing between the risk averse producer and the intermediary. Co-op generates revenue
Thus, the sharing rule serves both profit and risk distribution. While the farmer cares more about the guaranteed payment, the intermediary relies on risky dividends (Newbery and Stiglitz, 1979). Moreover, both the procurement price
The co-op members also differ in their risk preference. Assume that the farmer is risk-averse, while the intermediary is risk-neutral (Stiglitz, 1974; Newbery and Stiglitz, 1979). Based on the sharing rule described earlier, the farmer’s expected utility function can be expressed as follows:
where
Obviously, there is a conflict of interest inside the co-op: a higher procurement price
When
In sum, in an intermediary-led co-op, the two types of members differ intrinsically in two aspects: (1) their risk preference, and (2) relative political power, which affects the co-op’s sharing rule. In the following sections, we shall see how the sharing rule is designed to elicit the farmer’s supply incentive.
3. Farmer supply and the co-op sharing rule
Given the leadership feature, the decision of the co-op and the members follows a simple two-stage game: In the first stage, the co-op decides the sharing rule
3.1. Farmer supply
In the second stage, the farmer chooses quantity
where
Lemma 1: While the procurement price
Proof: Implicit function theory gives
Q.E.D.
The positive effect of the procurement price on the farmer’s supply is straightforward. In particular, a high level of
3.2. Co-op sharing rule
Taking into account the farmer’s quantity decision depicted in condition (4), the co-op makes a collective choice on the sharing rule to induce the participation of the farmer and the intermediary. Assume that the farmer and the intermediary gain zero outside payments if they reject the co-op’s sharing rule. The co-op’s problem is stated as follows:
where
where
In sum, the equilibrium sharing rule reflects the interaction of the procurement price and the payout ratio to achieve three goals: distributing profit, increasing the market price, and reducing the market risk faced by the farmer. Which effect plays a dominant role depends on the institutional background captured by relative political power
Proposition 1: An intermediary-led cooperative pays a positive (or no) patronage refund and sets a higher (or lower) procurement price to the farmer member if the farmer gains more (or less) political power than the intermediary within the cooperative, i.e.
Proof:
To solve problem (5), assume that there is an interior solution of
Therefore, in equilibrium,
The equilibrium patronage refunds
Therefore, the equilibrium solution is a corner solution
If
If
Q.E.D.
Proposition 1 suggests that the sharing rule for the intermediary-led cooperative depends on the distribution of political power within the cooperative. For a co-op that favors the farmer, the sharing rule sets a high procurement price while letting the farmer bear some risk through a positive patronage refunds over the co-op’s profit. This is the case when the intermediary is supported by the government, who aims to connect farmers to downstream markets and ensure basic revenue for farmers, Whereas for a co-op in which the intermediary has the power, the sharing rule pays little patronage refunds.
Proposition 1 can also provide interesting insights into how the sharing rule varies with the degree of vertical integration, which can be reflected by shifting the political power parameter. As is mentioned earlier, when the farmer and the intermediary have equal political power within the co-op (
The case when farmer gains higher political power (
The overproduction is likely to impede the co-op’s market power. This gives rise to using the risk sharing instrument to restrain the farmer’s supply to achieve a higher markup. However, this is at the expense of the intermediary’s profit. When
Proposition 2 If conditions (4), (6) and (7) uniquely define interior solution
Proof: To solve problem (5), when
Q.E.D.
The proposition reveals an interesting finding on the relationship between risk sharing and the desire to increase the market price: even if the co-op is biased toward the risk-averse farmer, the sharing rule still lets the farmer bear some risk through a positive payout ratio. Indeed, when the intermediary’s participation constraint is binding, the first-order condition for
where
The above discussion does not take into account the intermediary’s investment incentives. If accessing the downstream market requires upfront investment from the intermediary, the investment benefit is more likely to be held up as the farmer gains more political power within the co-op, that is, the intermediary is likely to face a more severe ‘hold-up’ problem according to the incomplete contract theory (Grossman and Hart, 1986; Hart et al., 1990). Therefore, our results suggest that the intermediary is more likely to quit the co-op if the farmer has higher political power.
4. An illustration
In this section, we illustrate numerically how institutional features of intermediary-led co-ops affect sharing rules and the equilibrium quantities. We specify downstream market demand as
where the equilibrium
The figure is drawn setting
To see how different members are affected, we plotted the equilibrium quantity
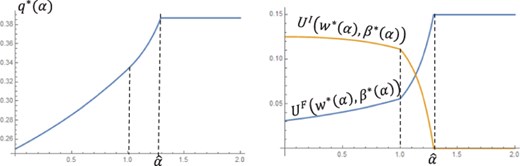
Equilibrium quantity and utilities under different institutional framework. The figure is drawn setting
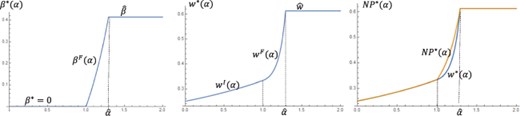
The co-op’s survival not only depends on the co-op’s institutional features but also on market conditions, especially, market risks when the co-op wants to pursue value-added business. Figure 4 plots the change in the equilibrium sharing rule under different levels of market risk
![Market risks and the equilibrium sharing rule. The figure is drawn setting $\bar a = 1;\,\gamma = 1$ and $\alpha \; \in [0,\;2]$. It shows the change of patronage refunds ($\beta^{*}\,\left( {\alpha ,\sigma } \right)\,in\,$the left panel), the procurement price (${w^*}\left( {\alpha ,\sigma } \right)\,in\,the\,$middle panel) and the net price received by farmer ($N{P^*}\left( {\alpha ,\sigma } \right) = \beta \,w + \left( {1 - \beta } \right)\bar P$ in the right panel), with the market risk varying in three levels $\sigma = 1,\,2$ and $10$.](https://oup.silverchair-cdn.com/oup/backfile/Content_public/Journal/erae/52/1/10.1093_erae_jbaf008/3/m_jbaf008f4.jpeg?Expires=1749800912&Signature=ODdzS7-~FzAYjs~9Bw1I~3cpX86b2cIrPZqAYZY1uZLhadimolGimTfQl~ZZoVyIDLpT8vgb8QdQ6vFz39RH02KrmOzrde36aV-4-jzhE7OiaGJ64BuPKs7FaPw1XgEyEsOy9EN0sOg7qOH6-nN45syAuF~M0Ak4vmsJA59w5LJR-5~teZMck3-HfwzI8IPWk0iK7uoAhYQzV~l0KTY-9mDnVgpd8~yzB8e9bNMIEJyo-fm-o0sRZEk-eecomp~FeAq9VXKg9MGgh2LRj9GnkiPH5hl77VO5OByd-VIne0hyF7qgBLaGgJQcmeSahxMALDZEHNwjh0LxfczhPF0qGg__&Key-Pair-Id=APKAIE5G5CRDK6RD3PGA)
Market risks and the equilibrium sharing rule. The figure is drawn setting
It is easily seen that the sharing rule is invariant with the market risk when
The consequence of the change in the sharing rule with the market risk is illustrated in Figure 5, which plots the equilibrium utilities for the farmer (the left panel) and for the intermediary (the right panel). Again, the equilibrium outcome is not affected by the market risk when
![Market risk and the equilibrium utilities for the farmer and for the intermediary. The figure is plotted setting $\bar \alpha \; = \;1,\;\gamma = 1$ and $\alpha \in \;[0,\;2]$ It shows the change of equilibrium utilities of farmers ${U^F}\left( {\alpha ,\sigma } \right)\,$in the left panel) and that of intermediaries ${U^I}\left( {\alpha ,\sigma } \right)\,$in the right panel) with the market risks varying in three levels, $\sigma = 1$, 2 and 10.](https://oup.silverchair-cdn.com/oup/backfile/Content_public/Journal/erae/52/1/10.1093_erae_jbaf008/3/m_jbaf008f5.jpeg?Expires=1749800912&Signature=CjMdd3U20VSINsWPDI0QayQoXrM2JKWYbg7hMYgghlpT~DxDMF~pOYrNLnkNA4j9bqf9rqREis-oHqOb7FMOaXdiA3q5Q4uon6TbaNRL0LWUF-Wcum8HSt-Xk9YP0CjhayW037mJxmZ3cf-7H4hy1-3UW0ZXnDl1ZvtmgjtL4ZAIDLYl9cMAlpCUn1uRF0PUoPJQNvL50HaZ5F65XtVfziudzYyLJBdOxBkKG4yvSGeFNQoCPB-jgw8iHBnAHXr3TorVcbaQjs98bEeh84n6OuvGRTrmeT8LGZT7hBaczFn4aOYUfS2vR3Lpmzzttv6BMyVgjbd6dolYcok4FAimfQ__&Key-Pair-Id=APKAIE5G5CRDK6RD3PGA)
Market risk and the equilibrium utilities for the farmer and for the intermediary. The figure is plotted setting
We summarize the above illustrations into the following empirical implications:
Prediction 1: Co-ops where farmer members hold greater political power will allocate higher patronage refunds to farmer members and lower dividends to intermediaries (Figure 2).
Prediction 2: Co-ops where farmer members hold greater political power will decrease patronage refunds to farmer members when facing higher market risks (Figure 4).
Prediction 3: Co-ops where farmer members hold greater political power are more likely to pursue less risky business ventures to reduce exposure to market volatility (Figure 5).
To sum up, the above predictions suggest that market risk plays a more significant role in shaping the co-op’s sharing rule when the political power within an intermediary-led co-op tilts in favor of farmer members. The following section will analyze unique survey data from Chinese agricultural co-ops to explore whether these patterns hold in practice.
5. Empirical observations on the intermediary-led agricultural cooperatives in China
The survey conducted in 2020 spans three key agricultural provinces of northern China: Shandong, Inner Mongolia, and Ningxia. To gather data, we employed a random sampling approach, selecting three agricultural counties from each province. We then requested local governments to provide a list of active local co-ops. From this list, we randomly selected 10 per cent of the co-ops in each county and conducted face-to-face interviews with their board members. Co-ops in the study primarily perform an intermediation function through core members such as village officials, local elites (entrepreneurs or businessmen) or large-scale farmers. In total, 187 co-ops were surveyed, among which 109 are official-led co-ops, 41 elite-led co-ops, and 37 farmer-led co-ops. The data collected includes key information on co-op balance sheets and profit distribution. To the best of our knowledge, this paper presents the first empirical analysis of profit distribution patterns among co-ops in China, and explores how these patterns vary across different types of intermediary-led co-ops.
Official-led co-ops are initiated by local government cadres with the primary objectives of poverty alleviation and raising farmers’ incomes. These co-ops act as intermediaries connecting farmers to downstream markets, and their decision-making and profit-sharing structures typically prioritize farmer members. Elite-led co-ops, on the other hand, are established by local entrepreneurs or business elites who often possess stronger market connections and processing capabilities. However, the concentration of political and financial influence within these co-ops often benefits larger stakeholders at the expense of smaller farmers. Farmer-led co-ops are formed exclusively by local farmers but share structural similarities with elite-led co-ops, relying heavily on large-scale farmers for intermediary functions. Prior studies (Banerjee et al., 2001; Zhong, Jiang and Yuheng, 2023) have raised concerns about the potential exploitation of smaller farmers in both elite-led and farmer-led co-ops.
Table 1 provides an overview of co-op characteristics by leadership type. Farmer-led and elite-led co-ops exhibit similar asset sizes, with an average of 6 million yuan—substantially larger than the 2 million yuan average for official-led co-ops. Farmer-led and elite-led co-ops also have smaller memberships compared to official-led co-ops, reflecting the latter’s focus on broader inclusivity. Equity structures further distinguish the co-ops: in farmer-led and elite-led co-ops, the largest shareholders contribute 50 per cent of total equity capital on average, compared to 30 per cent in official-led co-ops. This suggests a greater concentration of control in farmer-led and elite-led co-ops, as observed by Ma and Zhu (2020), while official-led co-ops maintain less concentrated equity to emphasize inclusivity. Panel B reports the sample mean, standard deviation, and range for each variable related to profit distribution. Co-ops can allocate profits either as dividends to equity holders or as patronage refunds based on members’ sales to the co-op. Farmer-led co-ops report the highest average profits (1.5 million yuan), distributing 1.12 million yuan as dividends and 616,000 yuan as patronage refunds. Elite-led co-ops report average profits of 855,000 yuan, with 518,000 yuan allocated as dividends and only 30,000 yuan as patronage refunds. Official-led co-ops, in contrast, report lower average profits (227,000 yuan) but allocate a larger share (112,000 yuan) to patronage refunds, indicating a focus on redistributing benefits to farmer members.
The characteristics of cooperatives by leadership types
| Farmer co-op | Elite-led co-op | Official-led co-op | ||
|---|---|---|---|---|
| Asset and equity contribution | ||||
| Assets (1000 RMB) | Mean | 6,317 | 6,206 | 2,141 |
| Std. | 8,730 | 8,258 | 3,973 | |
| Range | (0, 40,000) | (0, 35,000) | (0, 20,000) | |
| Number of members | Mean | 102.7 | 103.7 | 125 |
| Std. | 125.8 | 108.8 | 279.9 | |
| Range | (5, 600) | (5, 526) | (5, 2,642) | |
| Equity capital provided by the largest shareholder (%) | Mean | 50 | 50 | 30 |
| Std. | 0.3 | 0.3 | 0.3 | |
| Range | (0, 1) | (0, 1) | (0, 1) | |
| Profit and dividend | ||||
| Profit (1000 RMB) | Mean | 1466 | 855 | 227 |
| Std. | 613 | 206 | 64 | |
| Range | (−2,000) | (5,000) | (−450, 6,200) | |
| Dividend (1000 RMB) | Mean | 1,122 | 518 | 112 |
| Std. | 557 | 155 | 31 | |
| Range | (0, 2,800) | (0, 20,000) | (0, 4,500) | |
| Patronage refund (1000 RMB) | Mean | 616 | 30 | 60 |
| Std. | 142 | 19 | 20 | |
| Range | (0, 1,100) | (0, 4,675) | (0, 722) | |
Table 2 examines the patronage refund ratios, defined as the proportion of profits redistributed as patronage refunds. It also summarizes the percentage of co-ops that do not provide patronage refunds. Official-led co-ops are more likely to make patronage payments, with an average refund ratio of 14.6 per cent, compared to 11 per cent for farmer-led co-ops and just 6.1 per cent for elite-led co-ops. Additionally, official-led co-ops are the least likely to omit patronage refunds altogether. Figure 6 further visualizes these patterns by comparing the density distributions of patronage refund ratios and dividend ratios between official-led co-ops and a combined group of elite-led and farmer-led co-ops. The grouping reflects the theoretical expectation that elite-led and farmer-led co-ops would pay minimal patronage refunds to farmers. Consistent with our expectations, official-led co-ops exhibit a distribution skewed toward higher patronage payouts, whereas elite-led and farmer-led co-ops favor dividend payments. These findings align with theoretical prediction 1, which posits that co-ops with stronger farmer representation allocate higher patronage refunds and lower dividends.
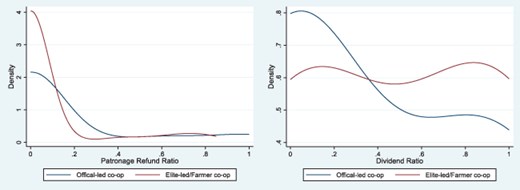
The patronage refund ratios and dividend ratios of cooperatives by leadership types. (a) production services, (b) processing services, and (c) marketing services.
The patronage refund ratios of cooperatives by leadership types
| Farmer co-op | Elite-led co-op | Official-led co-op | |
|---|---|---|---|
| Average patronage refund ratio (%) | 11 | 6.1 | 14.6 |
| Co-ops do not pay patronage (%) | 82.4 | 86.5 | 76 |
| Range of patronage refund ratio | (0, 80%) | (0, 85%) | (0, 100%) |
| Number of cooperatives surveyed | 37 | 41 | 109 |
Prediction 2 posits that co-ops with stronger farmer representation reduce patronage refunds as business risk increases. While quantifying co-op business risks is challenging due to data limitations, downstream market price volatility is likely to increase with co-ops’ involvement in value-added services, particularly processing. Processing involves transforming raw agricultural products into higher-value goods, which exposes co-ops to significant financial risks due to price volatility and investment requirements (Bijman, Iliopoulos and Poppe et al., 2014; Mustafa et al., 2024). Figure 7 examines the distribution of patronage refund ratios for official-led co-ops, segmented by whether they offer value-added services. Co-ops engaged in processing exhibit a pronounced leftward shift in the distribution of patronage refund ratios compared to those not involved in processing. This reflects a decrease in refunds as risk increases, consistent with Prediction 2. In contrast, production and marketing services, which are less capital-intensive and less exposed to price fluctuations, show no significant impact on patronage refunds. This distinction highlights how processing activities, due to their higher risk profile, drive changes in profit allocation strategies. This finding underscores the importance of understanding how co-ops balance risk and member benefits under different operational contexts.
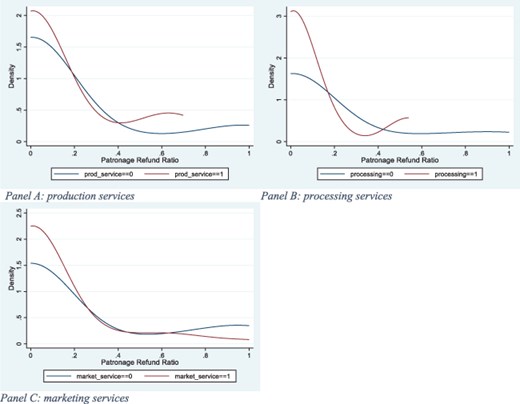
The patronage refund ratios of official-led co-ops by value-added services.
Finally, in Table 3, we compare the likelihood of co-ops offering these value-added services by leadership types. Elite-led co-ops with larger asset sizes on average, as shown in Table 1, seem to be able to offer more value-added services: more than 50 per cent of them are providing production services and nearly 90 per cent marketing services, and 36.6 per cent engaging in processing, which can be capital-intensive. In contrast, a noticeably smaller proportion of official-led co-ops offer these services. Given that the prices of value-added agricultural products tend to be more volatile (Mustafa et al., 2024), this observation aligns with our theoretical prediction 3 that official-led co-ops are less likely to engage in risky business ventures, prioritizing stability and equitable benefit distribution.
The value-added services conducted by cooperatives by leadership types
| Farmer co-op | Elite-led co-op | Official-led co-op | |
|---|---|---|---|
| Co-ops offer production services (%) | 67.6 | 51.2 | 25.7 |
| Co-ops offer marketing service (%) | 78.4 | 87.8 | 45.0 |
| Co-ops offer processing service (%) | 8.1 | 36.6 | 6.4 |
| Number of cooperatives surveyed | 37 | 41 | 109 |
6. Conclusion
In this paper, we explored a unique cooperative structure that includes two types of members: farmers and an intermediary. The internal operations of the co-op align with the vertically coordinated agricultural system, with the distinction that political power may be delegated to farmer members, influencing profit distribution decisions. Our analysis focused on scenarios where co-ops exercise monopoly power in a risky downstream market. By determining the procurement price and the profit payout ratio, co-ops can effectively balance profit and risk sharing among members with diverse risk preferences. Conventional wisdom suggests that risk-neutral parties, such as agribusiness intermediaries with greater risk tolerance, should fully insure risk-averse farmer members. Contrary to this, our findings indicate that when farmers hold significant political power within the co-op, they are willing to accept some degree of risk. This willingness to share risk is motivated by the potential to exercise monopoly power in the downstream market, even at the cost of limiting output.
The implications of our model extend to shifts in political power and changes in market risk, influencing how profit and risk are shared within the co-op. As farmers gain more political power, they are allocated a larger share of the co-op’s profit, potentially achieved through higher procurement prices. While elevated procurement prices encourage increased farmer output—thereby diminishing the co-op’s monopoly power—the co-op can counterbalance this by boosting profit payouts to farmers. However, the co-op must maintain a positive expected profit for the intermediary, ensuring their continued participation. These results help explain why co-ops in developing countries, with an excessive institutional bias towards farmers, sometimes face failures. Despite this, intermediary-led co-ops present a promising model for sustainable development in high-value, risky markets, provided farmers have a moderate degree of political influence and share both risks and profits with the intermediary.
Our study does leave several questions unanswered. For example, we examined only market risk, but in many developing countries, co-ops may face significant financial constraints, limiting their ability to pay for farmers’ crops or generate profits for future distribution. Additionally, our model is static, assuming farmers make production decisions solely based on the co-op’s price offer. Future research should consider the impact of past co-op performance and the duration of farmer involvement, which could affect long-term member behavior and cooperative sustainability.
Footnotes
We assume risk neutrality for intermediaries without loss of generality. In practice, intermediaries may exhibit some level of risk aversion, but their access to financial instruments, diversification strategies, and capital reserves generally makes them less sensitive to risk than farmers. Extending the model to incorporate intermediary risk aversion would complicate the mathematical framework but would not alter the qualitative conclusions regarding the sharing rule and cooperative behavior.
We only focused on market risks that affect the return for a given quantity. Quite often, agricultural production also suffers environmental or natural risks, which is not the focus and is abstracted away in our setting.
The intermediary can also be a farmer member who has access to the market and can supply to the co-op, but the quantity of supply is negligible compared to the co-op’s gross quantity.
In practice, the co-op contracts with the farmers and promise them to collect their product with a certain price which is higher than the market price. To this extent, farmers still bear some risk when selling products to co-op. However, this part of payment is often paid upon the collection of farmers’ product and is clearly less risky compared to the patronage refunds, which is provided ex post the profit realization.
The negativity stems from the fact that
When
From Proposition 2,
Details of the calculation are shown in Supplementary Appendix 1.
The only difference between
