


Abstract
There is an emerging body of evidence to suggest that nudges can motivate behaviour change. The question as to whether using nudges in tandem ‘crowds out’ the marginal effectiveness of each one has attracted little attention. Using a randomised survey experiment consisting of 1,800 farmers, we tested the impact of two nudge interventions (injunctive norm and social signalling) when used individually in isolation and also when used in combination. Our findings are indicative of limited crowd out effects and more generally suggest that there may be scope for employing non-monetary interventions in combination when it comes to encouraging technology uptake.
1. Introduction
Due to the potential for negative externalities associated with the use of certain intensive farming methods, farmers are increasingly being encouraged to produce food in a more sustainable fashion (e.g. Herrero et al., 2010; Thornton, 2010; Brodt et al., 2011; Smith and Gregory, 2013). Sustainability concerns are multifaceted, ranging from environmental issues such as biodiversity and climate change to animal health and worker safety. Agricultural technologies are often put forward as a means to help farmers meet these challenges whilst still meeting the needs from a growing population (Hrustek, 2000). While agri-technologies are put forward as central to the ‘sustainable intensification’ of agriculture, uptake of new agricultural innovations is often lower than desired or indeed anticipated compared with what would be predicted if farmers acted solely as profit-maximising agents (Pannell et al., 2006).
Studies of farmer behaviour have put forward a number of explanations as to why the adoption of new farm practices is often lower than expected. These include economic considerations such as transaction costs and application burden, as well as structural farm characteristics (see Pannell et al., 2006; Siebert, Toogood and Knierim, 2006; Lastra-Bravo et al., 2015 for reviews). There is also a rich body of literature which points towards the importance of sociological and psychological factors that influence the adoption of sustainable farming practices (see Dessart, Barreiro-Hurlé and van Bavel, 2019 for a recent review). This work, among other things, highlights the importance of ‘good farmer’ identities and peer effects (Darnhofer, Schneeberger and Freyer, 2005; Pannell et al., 2006; Mills et al., 2018; Marr and Howley, 2019), farmer goals and attitudes (Gasson, 1973; Willock et al., 1999; Maybery, Crase and Gullifer, 2005; Howley, 2015) as well as underlying psychological dispositions such as risk aversion (Marra, Pannell and Ghadim, 2003) and personality traits (Austin, Deary and Willock, 2001). In essence, this literature highlights the importance of looking beyond the technical aspects of agricultural production and farm structure when seeking to understand the adoption of new farm practices.
Recognising the importance of these behavioural factors in farmer decision-making, there is a nascent literature, particularly when it comes to pro-environmental behaviours, testing the effectiveness of nudge-based interventions in encouraging the adoption of more sustainable farm practices. While studies of farmer behaviour such as that described above have done much to improve our general understanding of farmers’ decision-making, studies using nudge-based interventions look to move beyond understanding towards testing how we can apply socio-psychological insights in leveraging real behavioural change. For example, nudges based on conveying information relating to other farmers’ behaviour (i.e. descriptive social norms) have recently been highlighted by both Howley and Ocean (2021) and Kuhfuss et al. (2016) as effective in encouraging farmers to maintain existing environmental features once their existing agri-environmental scheme contract ends. In a similar vein, Chabé-Ferret et al. (2019) suggest that nudges based on social comparisons can be effective in promoting water-saving behaviour among farmers who irrigate the most.
Research testing the effectiveness of nudge-based interventions in the agricultural sector is still in its infancy however and technology adoption in agriculture has, to the best of our knowledge, not been an area of focus. A novel feature of this work therefore is that we test the impact of social nudges on farm managers’ stated preferences when it comes to the uptake of new farm technologies. The specific nudge interventions we examine include: (i) a nudge based on reporting an injunctive social norm message to encourage relative comparison and (ii) a nudge based on social status signalling, which bring reputational concerns to the forefront in order to motivate behavioural change. A second aim of this study is to test the effectiveness of both of these nudges when used simultaneously. While there is a rapidly developing social science literature testing the impact of nudges on a variety of behaviours ranging from energy conservation to charitable giving (see Thaler and Sunstein, 2009), this work has principally tested the impact of nudges in isolation. There has been some previous research which has examined whether nudges can lead to the ‘crowding out’ of support for other more substantive policy interventions such as taxes (Hagmann, Ho and Loewenstein, 2019) and also whether nudges crowd out intrinsic motivation (Rommel et al., 2015). However, few studies have looked at how nudges might crowd each other out. That is, does a combination of nudges that target different psychological mechanisms incorporated into a single treatment perform worse than each individual nudge implemented separately?
The only study in this area that we are aware of is by Brandon et al. (2019) in the area of energy consumption. Their study explored the impact of two nudges which conveyed descriptive norm information about household electricity consumption relative to other households. They found no evidence for crowding out, as in isolation both social-norm-related nudges led to a reduction in electricity consumption of 3.8 per cent and 2.1 per cent, and when received in combination, households reduced their electricity consumption by an average of 6.8 per cent. Indeed, their findings were more in keeping with crowd in than crowd out effects (i.e. combining the two nudges into a single treatment appeared to have a larger total effect than the sum of the effects of the two nudges taken independently). While in this study the impact of peer comparisons was modest, much like that observed in the wider literature (e.g. Allcott, 2011; Earnhart and Ferrart, 2021), importantly they were also inexpensive interventions.
Testing the impact of nudges in combination, in addition to in isolation, has a number of important policy implications. One might expect that the combined effect of two nudges taken together may not scale additively if there is an element of psychological ‘crowding out’. This might happen, for example, because humans are thought to have a fixed cognitive capacity for taking in and processing information, and overloading this mental bandwidth can result in a change in decision-making outcomes (e.g. see Schilbach, Schofield and Mullainathan, 2016). Alternatively, when choices have multiple different attributes, they can conflict with each other. This typically leads people to defer decisions or choose a default option such as doing nothing (e.g. Bhatia and Mullett, 2016). If nudges are susceptible to significant crowding out effects, then studies may overstate the impact of nudges when they are included together as part of a portfolio of instruments. However, if nudges are not susceptible to psychological crowding out, then this suggests a greater role for policies which leverage interventions based upon behavioural insights in combination for shifting behaviour.
To examine these issues, we randomly allocated farmers into a control or one of three treatment conditions. The treatments were designed to test the effectiveness of nudges which leverage people’s desire for norm conformity and reputational concerns in impacting technology uptake, namely the adoption of two farmer apps designed to improve worker safety and animal health, respectively. When it comes to norm conformity, a large literature has shown that carefully crafted social norm messages (e.g. conveying what many others do or think) can be leveraged to affect behavioural change in a variety of settings such as water use (Ferraro and Price, 2013; Jaime Torres and Carlsson, 2018), charitable contribution (e.g. Shang and Croson, 2009), binge drinking (e.g. Werch et al., 2000) and energy consumption (Allcott, 2011; Allcott and Rogers, 2014). Social norms are thought to be an effective tool in shifting behaviour due to reasons ranging from the desire to fit in and avoid social disapproval to the desire for social esteem (Farrow, Grolleau and Ibanez, 2017).
The application of social norms as a nudge intervention typically involves either communicating behaviour to people about what other group members do—a descriptive norm—or what other group members think people should do—an injunctive norm (Farrow, Grolleau and Ibanez, 2017; Dessart, Barreiro-Hurlé and van Bavel, 2019). In this study, we first developed an injunctive norm leveraging results from our own previous survey research where the vast majority of farmers reported, in response to a survey question, that they felt that other farmers should embrace new technology and new approaches to farming. Injunctive norms can be proscriptive (prohibiting) or prescriptive (encouraging). Farrow, Grolleau and Ibanez (2017) suggest that using a proscriptive injunctive norm can be particularly useful when descriptive behaviour does not align with the desired behaviour (which will be the case when the intention is to encourage the adoption of something novel). A proscriptive norm highlights the inappropriateness of undesired behaviours. However, they also warn of undesirable psychological consequences from admonishing ‘bad’ behaviours and that some degree of sensitivity is required especially when a shift from current practice may be the desired outcome.
Taking all this into consideration, as well as our own previous experience working with farmers, we chose to employ a prescriptive as opposed to proscriptive injunctive norm (i.e. one that emphasises what farmers should do rather than what they should not do). While a small number of studies have tested the effectiveness of descriptive social norms in the agricultural sector (e.g. see Kuhfuss et al., 2016; Howley and Ocean, 2021), we are not aware of any studies that have examined the impact of nudges based on injunctive norms. Our expectation is that communicating a message relating to what other farmers’ feel people should do when it comes to technology adoption will encourage them to do the same through norm conformity. Additionally, hearing that other farmers engage in specific behaviours may also influence their behaviour through social learning and perceived risk reduction (Streletskaya et al., 2020).
The second treatment we developed was designed to test the effectiveness of allowing farmers the opportunity to demonstrate their behaviour publicly. Previous research has highlighted how pro-social or status signalling behaviour has been found to decline when such behaviour becomes less observable and increase when it is made public (Sexton and Sexton, 2014). As one illustration, even though the time cost of voting declined with the introduction of mail-in ballots in Switzerland, Funk (2010) showed that its introduction did not significantly increase voter participation rates and it even reduced turnout in small communities. They suggest that this may be due to the reduction of peer pressure from within one’s community, although the removal of the opportunity to socially signal participation may also explain the result. In a different context, Sexton and Sexton (2014) demonstrated how individuals were willing to pay a premium for the ‘green signal’ provided by the distinctively designed Toyota Prius. This they suggest is because energy conservation is socially desirable and relative to other hybrid options, the distinctive design of the Toyota Prius allows people to more effectively communicate to others that they are engaged in perceived ‘good’ behaviours, thereby gaining social esteem.
In this study, we present farmers with a ‘nudge’ which suggests that the adoption of specific technologies may engender publicity on a website through an award scheme. For ease of writing, we will refer to this intervention as our status signalling treatment. Our a priori expectation is that providing farmers with a mechanism to demonstrate their contribution publicly may generate additional utility by allowing them the opportunity to demonstrate their technological sophistication to others (be it farmers or the public at large), or simply that they are an early adopter. In essence, we suggest that farmers may be more likely to adopt a technology when that behaviour is observable due to people’s concern with furthering one’s position in the social hierarchy (see Truyts, 2010). Enhancing one’s social status can be both something that provides utility in and of itself through favourable relative comparison (this is shown in the well-being literature by Blanchflower and Oswald, 2004 among others). However, one’s relative status ranking also informs the allocation of goods that are distributed through social means (e.g. sexual partners—Truyts, 2010). In short, furthering one’s position in the social hierarchy can lead to both direct and indirect gains in utility.
On the other hand, although they also rely on social information, nudges based on social norms (be they descriptive or injunctive) stem from the desire to ‘fit in’, and the negative repercussions from not doing so (see Cialdini and Trost, 1998). Therefore, adhering to a norm is motivated by the desire not to be considered a social outlier, whereas status signalling is focused around ‘moving ahead’ in terms of rank position. In some senses, they are therefore two sides of the same coin: both mechanisms concern one’s position in the social hierarchy, but status signalling generates additional utility whereas adhering to a norm avoids disutility.
Overall, we find minimal support for the hypothesis that taken in isolation each of the individual nudge interventions may help to encourage technology adoption. Specifically, the social norm and status-signalling treatments used in isolation led to a 5.8 per cent and 2.4 per cent estimated overall increase in stated interest for adopting the novel farming smartphone apps, but neither of these were statistically significant increases (p = 0.10 and p = 0.45). We found stronger evidence to suggest that the combination nudge approach may be impactful with an estimated 9.2 per cent statistically significant increase. We also document some evidence for heterogeneity in impact as farmers with relatively lower levels of education appear to be the group most impacted by these nudges. In summary, these findings first suggest that behavioural oriented interventions that leverage injunctive norms and reputational concerns (status signalling) may have a role to play in supplementing existing policy tools (e.g. market-based approaches) when it comes to promoting technology uptake amongst farm managers. This is particularly true when one considers the relatively low costs associated with the implementation of nudges such as these. Second, we find no evidence of crowd out effects. This means that combining multiple nudges that target different psychological mechanisms may increase overall effectiveness with little (if any) additional cost.
2. Method
2.1. Randomised survey experiment
We designed a randomised online survey experiment using Qualtrics software. The design of our experimental question was framed in the context of technology uptake, so that we could first test the impact of individual nudge messages on the level of farm managers’ stated interest in technology adoption using a between-subjects design. Our second aim was to test whether our social norm and status signalling nudge interventions would have an additive effect when combined together into a single treatment, or whether the presence of both nudges together would create a crowding out effect (i.e. resulting in a less than additive effect). We tested this issue by examining the impact of a social norm and status signalling nudge separately and when used in combination. If crowding out were present, we would expect to observe that the combined treatment effect has a smaller impact on stated preferences than the sum of the individual effects observed in the social norm and status signalling treatments.
As a means to examine these issues, we used the example of two real mobile phone applications under development at the University of Manchester’s Department of Electrical and Electronic Engineering. The first application was designed to monitor a farm worker’s movements to ensure they are okay in lone-working situations. We refer to this technology henceforth as the worker safety application. The second application was designed to allow farmers to make notes on animal health in a user-friendly manner and to have these notes synchronised to other devices within the farm so that they are easily accessible. We refer to this technology henceforth as the animal health application.
In the control condition, we presented a description of these two technologies to participants and asked them to rate their level of interest in adopting each app on a 0–10 scale. In the social norm treatment, we added a paragraph near the beginning of the question text that stated ‘…in a recent survey we ran, over 90% of farmers believed that other farmers should embrace new technology and new approaches to farming’. This injunctive norm was based on attitudinal data concerning farming technology from a previous survey on farmers conducted in 2019 (see Howley and Ocean, 2021 for more details regarding the survey methodology). In the status signalling treatment, we added a paragraph to the end of the control condition that explained a hypothetical situation where a farming network was offering the farmer with an opportunity to participate in a non-monetary award scheme where they would be publicised on a website for using these technologies. This treatment loosely follows the design of the social status treatment in Howley and Ocean (2021). Finally, we presented a combined treatment, which includes both the text included in the social norm treatment as well as the text included in the status signalling treatment. Randomisation was performed by the software at the time that a respondent begins the survey. The full text for both questions and all treatments can be found in Appendix A.
2.2. Data collection
Our general data collection strategy follows that used in Howley and Ocean (2021) and Ocean and Howley (2021). We used the same overall sample frame of publicly available UK Common Agricultural Policy (CAP) subsidy recipients from farmsubsidy.org as in these previous studies in order to obtain a list of potential farm addresses. In addition to this, we removed those addresses to which we had previously sent survey requests, so as to avoid overburdening farmers with multiple surveys. We sought to ensure that responses for our control and each of our treatment groups were large enough in order to identify mean differences with sufficient power. Since nudges such as these can often have small effect sizes in absolute terms, we took a conservative approach by assuming a small effect size (d = 0.2) when determining the appropriate sample size. Using G*Power (Faul et al., 2007, 2009) we calculated that such an effect size would require a sample of 394 per group to detect significance at the 5 per cent level (two sided) at a power level of 0.8. Howley and Ocean (2021) and Ocean and Howley (2021) obtained a 7.6 per cent response rate using a similar survey methodology to the one used here. Using this response rate as a baseline estimate, we calculated, in turn, that we needed to send at least 25,922 survey invitations in order to obtain a large enough sample to reliably detect treatment differences.1 Therefore, we randomly selected 30,000 addresses to which we sent mailed paper invitation letters containing a link to the online survey. Due to question randomisation complexity and to avoid response issues arising from offering multiple modes of response (Dillman, Smyth and Christian, 2014), we did not offer a paper version of the survey. We also enclosed a copy of a handwritten thank you message and smiley face in order to encourage responses. We sent follow-up reminder letters approximately a month after the initial invitation.
Responses were collected online from July to September in 2020. We received 2,553 total responses. The achieved response rate was very similar to that achieved in Howley and Ocean (2021) and Ocean and Howley (2021). We obtained a sufficiently large group size in each treatment of at least 431 farmers, meaning that we were able to detect differences between conditions with a reasonably high degree of power (as discussed above). In addition to the technology adoption question, we also collected additional descriptive questions such as farmer demographics and farm structural characteristics. Farmer characteristics in the sample were fairly close to national data overall. For example, 83 per cent were male and the mean age was 56.4 years, which corresponds to a median age band of 50–59 and an 85 per cent proportion of male farmers in the 2016 UK Farm Structure Survey.2 The only notable difference between our sample and the UK Farm Structure Survey data appears to be that our data contain a slightly higher proportion of better-off farms. For illustration, the UK Survey has 60 per cent of holdings with farm incomes below EUR 50,000, whereas 49 per cent of farms in our survey had incomes of GBP 45,000 or below (which is approximately equivalent to EUR 51,900 at the time of writing). A full list of farm and demographic characteristics can be found in Appendix B as well as the distribution of characteristics (farm and farmer related) across the treatment groups.
3. Results
3.1. Main treatment effects
A total of 1,805 farmers completed the question relating to their interest in adopting the worker safety and animal health app. These farmers were randomly assigned to a control or one of three treatment conditions. A total of 476 farmers completed the control question with 464, 431 and 434 in each of the three treatment groups. Table 1 outlines the full results in detail. For the worker safety app, farmers reported an overall mean level of interest of 5.78 on a 0–10 scale. In the social norm treatment, the mean level of interest increased slightly to 5.93, and in the status signalling treatment the mean level of interest was also higher than the control at 5.90. These represent 2.6 per cent and 2.1 per cent increases relative to the control. Neither of these estimated differences was statistically significantly different from zero. In the combined treatment, the mean level of interest was 6.27, which represents a statistically significant increase of 8.5 per cent (two-sided p = 0.018). For the animal health app, the overall mean level of interest was somewhat smaller overall at 4.85 than the mean level of interest expressed for the worker safety app. In the social norm and status signalling treatments, the mean level of interest increased to 5.31 (two-sided p = 0.037) and 4.98 (two-sided p = 0.549), respectively. These represent estimated increases relative to the control of 9.5 per cent and 2.7 per cent, the latter not being a statistically significant difference. In the combined treatment, the mean level of interest increased to 5.33 which represents a statistically significant 10 per cent increase (two-sided p = 0.030).
Treatment differences for the level of interest in two farmer smartphone apps
| Control | Social norm | Social status | Combined | |
|---|---|---|---|---|
| All responses | ||||
| n | 476 | 464 | 431 | 434 |
| Worker Safety App | ||||
| Mean interest level | 5.777 | 5.925 | 5.896 | 6.270 |
| Treatment mean—control mean | 0.147 | 0.118 | 0.492 | |
| s.d. | 3.127 | 3.211 | 3.274 | 3.108 |
| p value vs. control (two-sided) | 0.476 | 0.578 | 0.018 | |
| Animal Health App | ||||
| Mean interest level | 4.845 | 5.310 | 4.981 | 5.327 |
| Treatment mean—control mean | 0.466 | 0.137 | 0.483 | |
| s.d. | 3.376 | 3.456 | 3.504 | 3.311 |
| p value vs. control (two-sided) | 0.037 | 0.549 | 0.030 | |
| Average of both apps | ||||
| Mean interest level | 5.311 | 5.617 | 5.439 | 5.798 |
| Treatment mean—control mean | 0.307 | 0.128 | 0.487 | |
| s.d. | 2.784 | 2.969 | 3.004 | 2.889 |
| Cohen’s d (effect size) | 0.107 | 0.044 | 0.172 | |
| p value vs. control (two-sided) | 0.103 | 0.507 | 0.010 | |
| Only farmers that have a smartphone | ||||
| n | 266 | 266 | 225 | 241 |
| Worker Safety App | ||||
| Mean interest level | 6.391 | 6.218 | 6.582 | 7.033 |
| Treatment mean—control mean | −0.173 | 0.191 | 0.642 | |
| s.d. | 2.926 | 3.049 | 3.093 | 2.766 |
| p value vs. control (two-sided) | 0.505 | 0.482 | 0.012 | |
| Animal Health App | ||||
| Mean interest level | 5.252 | 5.568 | 5.707 | 5.784 |
| Treatment mean—control mean | 0.316 | 0.455 | 0.532 | |
| s.d. | 3.398 | 3.444 | 3.444 | 3.185 |
| p value vs. control (two-sided) | 0.288 | 0.143 | 0.070 | |
| Average of both apps | ||||
| Mean interest level | 5.821 | 5.893 | 6.144 | 6.409 |
| Treatment mean—control mean | 0.071 | 0.323 | 0.587 | |
| s.d. | 2.638 | 2.831 | 2.811 | 2.608 |
| Cohen’s d (effect size) | 0.026 | 0.118 | 0.224 | |
| p value vs. control (two-sided) | 0.764 | 0.190 | 0.012 | |
| Only fully completed surveys | ||||
| n | 318 | 331 | 281 | 275 |
| Worker Safety App | ||||
| Mean interest level | 6.085 | 5.900 | 6.203 | 6.589 |
| Treatment mean—control mean | −0.185 | 0.118 | 0.504 | |
| s.d. | 3.090 | 3.142 | 3.246 | 3.074 |
| p value vs. control (two-sided) | 0.451 | 0.649 | 0.048 | |
| Animal Health App | ||||
| Mean interest level | 5.031 | 5.248 | 5.370 | 5.513 |
| Treatment mean—control mean | 0.216 | 0.339 | 0.481 | |
| s.d. | 3.413 | 3.438 | 3.529 | 3.321 |
| p value vs. control (two-sided) | 0.422 | 0.233 | 0.083 | |
| Average of both apps | ||||
| Mean interest level | 5.558 | 5.574 | 5.786 | 6.051 |
| Treatment mean—control mean | 0.016 | 0.228 | 0.493 | |
| s.d. | 2.794 | 2.914 | 2.999 | 2.866 |
| Cohen’s d (effect size) | 0.006 | 0.079 | 0.174 | |
| p value vs. control (two-sided) | 0.944 | 0.335 | 0.035 | |
To obtain overall treatment effects, we averaged across both apps to find the mean level of interest for adopting a smartphone technology amongst this group of farmers. The mean level of interest across both technologies combined was 5.31. The social norm treatment increased interest by 5.8 per cent (Cohen’s d = 0.107, p = 0.10), the status signalling treatment increased interest by 2.4 per cent (Cohen’s d = 0.044, p = 0.45) and the combined treatment that included both types of nudge increased interest by 9.2 per cent (Cohen’s d = 0.172, p = 0.010) relative to the control.3,4
These findings are illustrated in Figure 1 and suggest that nudges can be an effective low-cost supplement to existing policy tools when it comes to encouraging the adoption of farm-related technologies. We can also see that the combined treatment effect (the fourth bar in Figure 1) is greater than what we would have expected from summing the individual treatment effects in the social norm and status signalling conditions (the third bar in Figure 1). Although we cannot say that the combined treatment has a convex effect (i.e. the combination is greater than the sum of individual treatments) because the confidence interval of the combined treatment is relatively large, we certainly find no evidence of a significant crowd out effect from combining social information nudges together.5
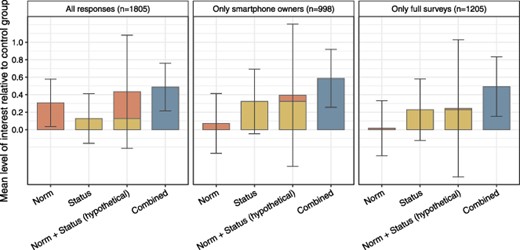
The mean level of interest in technology adoption relative to the control condition, averaged across both apps (worker safety and animal health). The panels show relative treatment effects for three different subgroups of data: (i) all responses, (ii) only those that stated they owned a smartphone and (iii) only those that completed all of the survey. The first two bars in each panel correspond to the treatment effect for the social norm and status signalling treatments (95 per cent confidence intervals are included). The third bar represents a simple sum of the social norm and status signalling conditions. This is the hypothetical treatment effect we would expect to observe if the singular treatments were exactly additive. Standard errors for the hypothetical condition were obtained using a linear transformation of the variance–covariance matrix of a regression with treatment dummies as regressors. The fourth bar corresponds to the actual treatment effect when both norm and status treatments were combined into one separate treatment.
For robustness, we repeated these analyses testing for crowd out effects for two smaller subgroups. First, we anticipated that a lack of smartphone ownership may undermine the treatment effect. Farmers without a smartphone may naturally be less interested in technology that involves the use of one because it would also require investment in a potentially costly device (both in psychological terms from having to learn how to use an additional piece of technology as well as the monetary cost). Repeating the analysis on the 998 smartphone owners from our sample, we found somewhat stronger treatment effects for the status signalling and combined treatment, relative to the analyses with all responses included (Cohen’s d for norm treatment = 0.026; for status treatment = 0.118; for combined treatment = 0.224). This analysis is shown in the second panel of Figure 1. Again, we see that the combined treatment effect is greater than that obtained from summing the individual treatment effects.6 Lastly, we studied only those respondents that went on to complete the full survey. While 1,805 farmers completed the experimental question (control or one of the three treatments), only 1,205 of these went on to complete the full survey inclusive of demographic information. We repeated the analysis with only these respondents as a robustness check, given that there may be a systematic difference between those who dropped out at an earlier stage and those that completed all of the questions, which could lead to an over/underestimate of the treatment effects. Analysing this subgroup, one can see that there was little difference in the combined treatment effect, but there was some difference to the effectiveness of individual nudges. Specifically, we find a weaker estimated social norm treatment effect (Cohen’s d = 0.006) and a somewhat more impactful status signalling treatment effect (Cohen’s d = 0.079), but little change in the combined treatment effect (Cohen’s d = 0.174) relative to the results obtained from using all observations.7 These findings, as illustrated in the third panel in Figure 1, support our initial conclusion that there is little evidence to suggest that significant crowding out occurs when implementing both nudges together.
3.2. Treatment effect heterogeneity
In the final stage of our analysis, we tested whether the impact of our combined nudge intervention varies across different subgroups. To date, heterogeneity in treatment effects is an issue that has been largely overlooked. One reason for this is that much of the literature in this area uses fairly homogenous groups such as students in a laboratory environment. Additionally, even if laboratory or survey experiments collect samples from heterogeneous groups, the sample sizes collected often act as barrier to sub-group analysis. Given the sample size used here, there is at least some potential to conduct exploratory sub-group analyses, although we appreciate that these analyses are not optimally powered and dividing the sample into various sub-groups does increase levels of uncertainty and so we suggest that readers keep this in mind. To test whether the treatment effect differs across distinct farmer groups, we divided farmers into two broadly equal-sized groups in terms of age, education and farm size. In one group, for instance, we have farmers who score above the mean value in age (e.g. over 56) and the other group consists of farmers who score below the mean value (e.g. less than or equal to 56 years of age). We also conducted a sub-group analysis in relation to gender. In this case, the groups are not broadly equal in size which reflects the much larger share of the population of farmers who are males. Our aim with these analyses was to see if there is scope to target interventions at particularly responsive subgroups.
Table 2 presents the results of these sub-group analyses. In all cases, the estimated treatment effect is positive, i.e. farmers in the treatment group express a higher level of interest in the technologies than the control group. There is some weak evidence to suggest that the treatment effect is larger for younger farmers and females, but these differences are not statistically significantly different from each other.8 We do observe statistically significant differences in the estimated treatment effect for farmers who have participated in tertiary-level education as opposed to farmers who have not. In the former case, the estimated difference between the treatment and the control group is 2.6 per cent (effect size d = 0.05), whereas in the latter it is 14.5 per cent (effect size d = 0.28). This suggests that all things being equal, farmers with a lower level of educational attainment may be more receptive to the treatment. One possible reason is that farmers with below average levels of education may have less confidence or capability to adopt new technologies. Hearing what other farmers do or think may hold particular relevance to this group as they may suffer from greater psychological barriers that prevent them from changing practices. Alternatively, relatively less well-educated cohorts may have a greater motivation to fit in and receive peer validation.
Sub-group analysis
| Mean Control | Mean Combined | Diff. | Obs. | |
|---|---|---|---|---|
| Age group | ||||
| ≤56 | 6.02 | 6.54 | −0.52* | 270 |
| >56 | 5.22 | 5.43 | −0.22 | 291 |
| Gender | ||||
| Male | 5.46 | 5.89 | −0.43* | 491 |
| Female | 6.01 | 6.84 | −0.83 | 103 |
| Education level | ||||
| Below tertiary | 5.57 | 6.37 | −0.81** | 291 |
| Tertiary | 5.60 | 5.75 | −0.15 | 306 |
| Farm size | ||||
| Small < 100 ha | 5.11 | 5.84 | −0.72* | 263 |
| Large > 100 ha | 5.88 | 6.21 | −0.34 | 341 |
Note: **p < 0.05.
p < 0.
3.3. Limitations
A potential limitation with this work is that we rely on stated intentions as opposed to the actual behaviour when estimating the impact of our proposed interventions. It is possible that farmers either behaved strategically or were influenced by social desirability bias, particularly if they felt a need to impress researchers. In practice, this seems unlikely to have had a large impact on results, given that the mean interest levels reported were close to the middle of the 0–10 scale. However, we cannot be certain of the actual proportion of farmers who would actually adopt each technology. Crucially, because farmers were randomly assigned to treatments, there is no reason to expect that any source of bias such as social desirability differs between treatment and control groups. This means that our treatment effects should be reliable in capturing the relative impact of the nudges. For similar reasons, while we appreciate that a response bias is possible in that respondents may be more likely to be favourable towards academic research or technology, again this is unlikely to have an impact on relative treatment effects.
4. Discussion and conclusions
In this study, we examined the impact of three different nudge treatments designed to motivate technology uptake amongst farm managers. Our randomised survey experiment provides minimal support for the hypothesis that isolated behavioural interventions which leverage injunctive norms and social status effects may have the potential to enhance technology uptake. Specifically, we found that the social norm and status signalling treatments used in isolation led to a 5.8 per cent and 2.4 per cent estimated overall increase in stated interest for adopting the novel farming smartphone apps, but neither treatment reached statistical significance at conventional levels (p = 0.10 and p = 0.45, respectively). We found stronger evidence to suggest that using these two types of intervention message in tandem is effective in influencing behavioural intentions towards the adoption of new farm technologies (9.2 per cent estimated increase, p = 0.01).
Considering first injunctive norms, many farmers feel that farmers in general have a duty or responsibility to embrace new technologies. Simply communicating this information to farmers in the form of an injunctive norm message may, we suggest, help to shift farmer behaviour towards the adoption of these technologies due to a desire to ‘fit in’. Our findings also suggest that there may be a role for policy to increase the conspicuousness of farmer behaviours. Such an approach can be seen as leveraging a ‘keeping up with the Joneses’ type of effect, although in this case, eliciting a relative comparison would be serving to motivate societally beneficial outcomes.
The main novelty of this study is that we found no evidence of significant crowd out effects when combining our two nudges together—specifically the combination of a social norm nudge with a status signalling nudge. Using messages that target both of these mechanisms in a single treatment appears to be at least as effective as the sum of the effects of the two nudges in isolation. In view of these results, we believe this combination nudge approach is ready to be tested in the field on actual farmer behaviour. Both of our nudge interventions target a similar psychological phenomenon, namely social comparison, but in two slightly different ways. The injunctive norm nudge informs farmers of the behaviour that their peers believe other farmers should be demonstrating, and so this informs farmers that there is a risk that they might violate a social norm if they go against this behaviour. On the other hand, the promise of a social status reward appeals to a farmer’s rank position in the social hierarchy. This can be important if farmers are concerned with how they are perceived by the general public.
Our results support the lack of crowding out effects previously observed by Brandon et al. (2019) in the domain of electricity consumption, although similar to Brandon et al. we make no claim that these findings will generalise across locations and other contexts. One would also need to beware of contexts where the psychological mechanisms behind multiple nudges could interfere with each other. For example, combining a nudge that evokes a productivist farmer identity with a nudge that evokes a progressive or conservationist farmer identity seems unlikely to generate additive effects. As such, we emphasise the need for future work to test for crowding out using nudges that target different psychological mechanisms and across different contexts.
Notwithstanding recent developments, particularly in testing the impact of message framings designed to engender norm conformity (Kuhfuss et al., 2016; Howley and Ocean, 2021), the use of nudges in the agricultural sphere is still very limited in contrast to other sectors (e.g. health, development and education). As an illustration, Dessart, Barreiro-Hurlé and Van Bavel (2019) noted that the four annual reports by the pioneering UK Behavioural Insights Team include only one mention of agriculture, despite showcasing hundreds of behavioural-orientated interventions for policy. From an overall policy implications standpoint, a characteristic feature of the nudge interventions employed here (and indeed interventions which draw on behavioural science more generally) is that these measures have a negligible cost compared to the potential benefit they could have.
We note here that sensible appraisals of the value of nudges will look not just at absolute effect sizes, which are often modest, but also at the value for money they represent (Benartzi et al., 2017). A good illustration of this idea can be found in the domain of electricity consumption and water conservation, where estimated effect sizes of social norm nudges range from 1 to 3 per cent (Allcott, 2011; Ferraro and Price, 2013). While these effect sizes appear small, the cost of implementing these interventions is low (notwithstanding the initial cost of testing them), and the cost of achieving similar reductions through more traditional economic interventions such as price increases can be quite high. For example, Allcott (2011) estimated that the impact of a social norm nudge intervention on electricity consumption (2 per cent) is equivalent to a short-run electricity price increase of 11–20 per cent. We posit therefore that nudge-based interventions can have an important role to play alongside other approaches such as market-based interventions (e.g. subsidies and regulations) when it comes to encouraging new farm practices.
Our research also highlights that the impact of social-comparison-oriented nudges may not be identical across demographic groups, highlighting the importance of heterogeneity analysis. To date, the focus has been on estimating main effects. We have provided some preliminary evidence in this study to suggest that our combined nudge may be more impactful when it comes to technology uptake for farmers with relatively lower levels of education. We suggest that now that we are beginning to understand more about the main effect of various nudges, a useful avenue for future work would be to focus primarily on estimating any treatment effect heterogeneity. Such research brings its own challenges but would enable policymakers to target interventions towards people who would be most receptive of the nudge intervention and in contexts where the treatment would be most effective.
Acknowledgements
We thank Jon Ensor and our other colleagues working on this project for helpful comments and suggestions. We are particularly grateful to Tom McNamara founder of FreeUp who along with the Department of Electrical and Electronic Engineering at the University of Manchester developed the smartphone applications that we described in our survey. We are grateful to two anonymous reviewers for many helpful comments and guidance. The usual disclaimer applies.
Supplementary data
Supplementary data are available at ERAE online.
Funding
This study was funded through the Global Food Security’s ‘Resilience of the UK Food System Programme’ with support from the Biotechnology and Biological Sciences Research Council, Economic and Social Research Council, Natural Environment Research Council and the Scottish Government.
Footnotes
Data for a further treatment were collected as part of a separate study, so the overall required sample was based on needing to obtain five groups of roughly equal size.
A pnorm plot revealed that the outcome variable does not exhibit any clear characteristics of non-normality that would make a t-test unsuitable. Repeating the t-tests assuming unequal variances makes virtually no difference to p values. Therefore, we believe the use of t-tests is suitable for these analyses.
The combined treatment was not significantly greater than the social norm treatment alone but it was significantly greater than the status treatment alone (p = 0.073).
An F-test of the restriction that the sum of the marginal effects of the norm and status treatment is equal to the marginal effect of the combined treatment is also not rejected (p = 0.846), further suggesting an absence of any significant crowding out effect.
The combined treatment for smartphone users is also significantly better than the social norm treatment alone (p = 0.034) but not the status treatment alone (p = 0.293).
As in the smartphone only case, the combined treatment was significantly better than the social norm treatment alone (p = 0.044) but not the status treatment alone (p = 0.288).
Here we employed the standard z statistics: |${\rm{Z}} = \left( {{\rm{b}}1 -{\rm{b}}2} \right)/\sqrt{{{\left( {{\rm{SEb}}1} \right)}^2} + {{\left( {{\rm{SEb}}2} \right)}^2}}$| see Clogg, Petkova and Haritou (1995).
References
Appendix A Question text and treatments
Control
A team of engineers from the University of Manchester have been working on two new smartphone-based technologies to assist farmers with their work.
We have provided a brief description of each of these technologies below and are keen to learn more about farmers’ interest in using them:
1. Worker safety
This is a smartphone application aimed at ensuring people’s safety when working alone in sheds, typically with animals. When the app identifies that the worker is near a shed, it monitors the worker’s physical movement to ensure that they are okay. If a farmer stops moving and does not respond to a prompt by the phone, a notification is sent to other people (e.g. other workers or family members) with the app installed. A text message is also sent to the farm manager’s phone. A farmer can also just trigger the alert manually if they are in distress. We have provided an example of the app in the image below:

2. Animal health
This is a smartphone application that is aimed at allowing farmers to make in-field notes on animals quickly and easily without the need for pen and paper notes. For example, farmers can log the ear tag number of an animal and make notes on their pregnancy outcomes. The data can be viewed on other devices such as home computers and are always automatically backed up. We have provided an example of the app in the image below:

Below, please state how interested you would be in adopting each of these farm smartphone applications on a scale from 0–10, where 0 means ‘not at all interested’, and 10 means ‘completely interested’:
Social norm treatment
A team of engineers from the University of Manchester have been working on two new smartphone-based technologies to assist farmers with their work. Many farmers have highlighted the importance they place on new innovations. For instance, in a recent survey we ran, over 90 per cent of farmers believed that other farmers should embrace new technology and new approaches to farming.
We have provided a brief description of each of these technologies below and are keen to learn more about farmers’ interest in using them:
1. Worker safety
This is a smartphone application aimed at ensuring people’s safety when working alone in sheds, typically with animals. When the app identifies that the worker is near a shed, it monitors the worker’s physical movement to ensure that they are okay. If a farmer stops moving and does not respond to a prompt by the phone, a notification is sent to other people (e.g. other workers or family members) with the app installed. A text message is also sent to the farm manager’s phone. A farmer can also just trigger the alert manually if they are in distress. We have provided an example of the app in the image below:

2. Animal health
This is a smartphone application that is aimed at allowing farmers to make in-field notes on animals quickly and easily without the need for pen and paper notes. For example, farmers can log the ear tag number of an animal and make notes on their pregnancy outcomes. The data can be viewed on other devices such as home computers and are always automatically backed up. We have provided an example of the app in the image below:

Below, please state how interested you would be in adopting each of these farm smartphone applications on a scale from 0–10, where 0 means ‘not at all interested’, and 10 means ‘completely interested’:
Status signalling treatment
A team of engineers from the University of Manchester have been working on two new smartphone-based technologies to assist farmers with their work.
We have provided a brief description of each of these technologies below and are keen to learn more about farmers’ interest in using them:
1. Worker safety
This is a smartphone application aimed at ensuring people’s safety when working alone in sheds, typically with animals. When the app identifies that the worker is near a shed, it monitors the worker’s physical movement to ensure that they are okay. If a farmer stops moving and does not respond to a prompt by the phone, a notification is sent to other people (e.g. other workers or family members) with the app installed. A text message is also sent to the farm manager’s phone. A farmer can also just trigger the alert manually if they are in distress. We have provided an example of the app in the image below:

2. Animal health
This is a smartphone application that is aimed at allowing farmers to make in-field notes on animals quickly and easily without the need for pen and paper notes. For example, farmers can log the ear tag number of an animal and make notes on their pregnancy outcomes. The data can be viewed on other devices such as home computers and are always automatically backed up. We have provided an example of the app in the image below:

Suppose a farming network offered you the ability to participate in an award scheme where you would be publicised on their website for using these new technologies. This is to help make the general public more aware of the importance farmers place on worker safety and animal health, as well as to see how your farm was taking advantage of new technologies in its daily operation.
Below, please state how interested you would be in adopting each of these farm smartphone applications on a scale from 0–10, where 0 means ‘not at all interested’, and 10 means ‘completely interested’:
Combined treatment
A team of engineers from the University of Manchester have been working on two new smartphone-based technologies to assist farmers with their work. Many farmers have highlighted the importance they place on new innovations. For instance, in a recent survey we ran, over 90 per cent of farmers believed that other farmers should embrace new technology and new approaches to farming.
We have provided a brief description of each of these technologies below and are keen to learn more about farmers’ interest in using them:
1. Worker safety
This is a smartphone application aimed at ensuring people’s safety when working alone in sheds, typically with animals. When the app identifies that the worker is near a shed, it monitors the worker’s physical movement to ensure that they are okay. If a farmer stops moving and does not respond to a prompt by the phone,a notification is sent to other people (e.g. other workers or family members) with the app installed. A text message is also sent to the farm manager’s phone. A farmer can also just trigger the alert manually if they are in distress. We have provided an example of the app in the image below:

2. Animal health
This is a smartphone application that is aimed at allowing farmers to make in-field notes on animals quickly and easily without the need for pen and paper notes. For example, farmers can log the ear tag number of an animal and make notes on their pregnancy outcomes. The data can be viewed on other devices such as home computers and are always automatically backed up. We have provided an example of the app in the image below:

Suppose a farming network offered you the ability to participate in an award scheme where you would be publicised on their website for using these new technologies. This is to help make the general public more aware of the importance farmers place on worker safety and animal health, as well as to see how your farm was taking advantage of new technologies in its daily operation.
Below, please state how interested you would be in adopting each of these farm smartphone applications on a scale from 0–10, where 0 means ‘not at all interested’, and 10 means ‘completely interested’.
Appendix B Respondent characteristics
Table B1. Farm characteristics
| N | % | |
|---|---|---|
| Farm classification | ||
| Cereal | 191 | 12.4 |
| Dairy | 130 | 8.41 |
| General Cropping | 126 | 8.16 |
| Livestock (lowland) | 305 | 19.7 |
| Livestock (LFA) | 303 | 19.6 |
| Mixed | 364 | 23.6 |
| Specialist pig | 10 | 0.65 |
| Specialist poultry | 9 | 0.58 |
| Horticulture | 29 | 1.88 |
| Other | 78 | 5.05 |
| UK Region | ||
| East Midlands | 129 | 8.35 |
| East of England | 146 | 9.45 |
| London | 2 | 0.13 |
| North East England | 67 | 4.34 |
| North West England | 103 | 6.67 |
| Northern Ireland | 11 | 0.71 |
| Scotland | 253 | 16.4 |
| South East England | 149 | 9.64 |
| South West England | 296 | 19.2 |
| Wales | 120 | 7.77 |
| West Midlands | 126 | 8.16 |
| Yorkshire and Humber | 143 | 9.26 |
| Total holding size | ||
| 0 to 19 ha | 128 | 8.30 |
| 20 to 49 ha | 242 | 15.7 |
| 50 to 99 ha | 299 | 19.4 |
| 100 to 199 ha | 381 | 24.7 |
| 200 ha or more | 492 | 31.9 |
| Annual farm income (inc. subsidies) | ||
| £0–45,000 | 669 | 49.0 |
| £45,001–90,000 | 218 | 16.0 |
| £90,001–1,35,000 | 159 | 11.7 |
| £1,35,001–1,80,000 | 56 | 4.11 |
| £1,80,001+ | 262 | 19.2 |
Table B2. Demographic characteristics
| N | % | |
|---|---|---|
| Gender | ||
| Male | 1,263 | 82.9 |
| Female | 251 | 16.5 |
| Other | 1 | 0.066 |
| Prefer not to say | 9 | 0.59 |
| Age group | ||
| 0–39 years old | 158 | 11.2 |
| 40–49 years old | 225 | 15.9 |
| 50–59 years old | 420 | 29.7 |
| 60–69 years old | 366 | 25.9 |
| 70 or above | 245 | 17.3 |
| Marital Status | ||
| Single | 124 | 8.15 |
| Married/living with partner | 1,281 | 84.2 |
| Divorced/separated | 53 | 3.48 |
| Widowed | 41 | 2.69 |
| Prefer not to say | 23 | 1.51 |
| Highest level of education | ||
| Below high school | 99 | 6.51 |
| High school | 322 | 21.2 |
| A-levels | 317 | 20.9 |
| Undergraduate degree | 603 | 39.7 |
| Postgraduate degree | 179 | 11.8 |
Table B3. Number of observations within the control and each treatment group, by farm and individual characteristics
| Control | Norm | Status | Combined | |
|---|---|---|---|---|
| Farm classification | ||||
| Cereal | 35 | 49 | 29 | 43 |
| Dairy | 21 | 32 | 27 | 26 |
| General Cropping | 29 | 19 | 26 | 20 |
| Livestock (lowland) | 52 | 68 | 66 | 59 |
| Livestock (LFA) | 69 | 62 | 56 | 57 |
| Mixed | 84 | 83 | 64 | 59 |
| Other | 33 | 24 | 21 | 19 |
| UK region | ||||
| East Midlands | 32 | 30 | 25 | 17 |
| East of England | 24 | 27 | 36 | 32 |
| London | 2 | 0 | 0 | 0 |
| North East England | 13 | 22 | 11 | 10 |
| North West England | 18 | 25 | 20 | 18 |
| Northern Ireland | 2 | 2 | 1 | 2 |
| Scotland | 61 | 56 | 38 | 47 |
| South East England | 29 | 38 | 28 | 27 |
| South West England | 53 | 57 | 56 | 61 |
| Wales | 26 | 29 | 23 | 17 |
| West Midlands | 28 | 30 | 22 | 21 |
| Yorkshire and Humber | 35 | 21 | 29 | 31 |
| Total holding size | ||||
| 0 to 19 ha | 26 | 24 | 25 | 23 |
| 20 to 49 ha | 44 | 57 | 51 | 51 |
| 50 to 99 ha | 59 | – | 63 | 60 |
| 100 to 199 ha | 89 | 62 | 63 | 63 |
| 200 ha or more | 104 | – | 87 | 85 |
| Annual farm income (inc. subsidies) | ||||
| £0–45,000 | 140 | 154 | 127 | 121 |
| £45,001–90,000 | 44 | 55 | 39 | 35 |
| £90,001–1,35,000 | 28 | 27 | 35 | 37 |
| £1,35,001–1,80,000 | 9 | 12 | 11 | 12 |
| £1,80,001+ | 57 | 55 | 50 | 49 |
| Gender | ||||
| Male | 258 | 282 | 236 | 233 |
| Female | 62 | 49 | 49 | 41 |
| Prefer not to say | 1 | 1 | 1 | 3 |
| Age group | ||||
| 0–39 | 30 | 30 | 31 | 35 |
| 40–49 | 48 | 49 | 39 | 37 |
| 50–59 | 104 | 91 | 67 | 80 |
| 60–69 | 68 | 87 | 68 | 69 |
| 70 or above | 50 | 57 | 48 | 40 |
| Marital Status | ||||
| Single | 29 | 30 | 24 | 18 |
| Married/living with partner | 260 | 282 | 239 | 237 |
| Divorced/separated | 15 | 11 | 8 | 11 |
| Widowed | 10 | 6 | 11 | 9 |
| Prefer not to say | 7 | 3 | 4 | 2 |
| Highest level of education | ||||
| Below high school | 20 | 23 | 20 | 12 |
| High school | 74 | 67 | 60 | 61 |
| A-levels | 58 | 70 | 60 | 66 |
| Undergraduate degree | 130 | 132 | 104 | 112 |
| Postgraduate degree | 38 | 38 | 42 | 26 |
