


Leptin signaling in the central nervous system, and particularly the arcuate hypothalamic nucleus, is important for regulating energy and glucose homeostasis. However, the roles of extra-arcuate leptin responsive neurons are less defined. In the current study, we generated mice with widespread inactivation of the long leptin receptor isoform in the central nervous system via Synapsin promoter-driven Cre (Leprflox/flox Syn-cre mice). Within the hypothalamus, leptin signaling was disrupted in the lateral hypothalamic area (LHA) and ventral premammillary nucleus (PMV) but remained intact in the arcuate hypothalamic nucleus and ventromedial hypothalamic nucleus, dorsomedial hypothalamic nucleus, and nucleus of the tractus solitarius. To investigate the role of LHA/PMV neuronal leptin signaling, we examined glucose and energy homeostasis in Leprflox/flox Syn-cre mice and Leprflox/flox littermates under basal and diet-induced obese conditions and tested the role of LHA/PMV neurons in leptin-mediated glucose lowering in streptozotocin-induced diabetes. Leprflox/flox Syn-cre mice did not have altered body weight or blood glucose levels but were hyperinsulinemic and had enhanced glucagon secretion in response to experimental hypoglycemia. Surprisingly, when placed on a high-fat diet, Leprflox/flox Syn-cre mice were protected from weight gain, glucose intolerance, and diet-induced hyperinsulinemia. Peripheral leptin administration lowered blood glucose in streptozotocin-induced diabetic Leprflox/flox Syn-cre mice as effectively as in Leprflox/flox littermate controls. Collectively these findings suggest that leptin signaling in LHA/PMV neurons is not critical for regulating glucose levels but has an indispensable role in the regulation of insulin and glucagon levels and, may promote the development of diet-induced hyperinsulinemia and weight gain.
The adipocyte-derived hormone leptin plays a critical role in the regulation of energy balance and glucose homeostasis. Leptin-deficient ob/ob mice and leptin receptor-deficient db/db mice are obese and have a phenotype similar to type 2 diabetes, including hyperglycemia, hyperinsulinemia, and insulin resistance (1–6). Whereas there are six isoforms of the leptin receptor, evidence suggests that the long Lepr-b isoform mediates most of leptin action (7, 8) and that many actions of leptin can be mediated by Lepr-b-expressing neurons of the central nervous system (CNS) (9–14). Lepr-b is expressed throughout the CNS and is particularly abundant in hypothalamic neurons (15–18). Proopiomelanocortin (POMC) and agouti-related peptide (AgRP) neurons of the arcuate hypothalamic nucleus (ARH) are arguably the most well studied leptin-responsive neurons and are key mediators of metabolic leptin action. Lepr-b reconstitution in either POMC neurons or the ARH is sufficient to reverse hyperglycemia in leptin receptor-deficient rodents (19–22). Interestingly however, these studies have consistently shown that hyperinsulinemia is only partially reduced by POMC or ARH Lepr-b expression, suggesting that leptin signaling outside the ARH is indispensable for the regulation of insulin levels. In addition, disruption of leptin receptor signaling in POMC neurons (23), AgRP neurons, or both (24) only modestly perturbs glucose homeostasis, suggesting the presence of either redundant or alternate neurocircuits that can regulate leptin action on glucose and insulin levels. Indeed, Lepr-b is highly expressed in other hypothalamic neurons and in extrahypothalamic neurons; however, the role of these leptin responsive neurons has not been fully elucidated. Some studies have shown that deletion of leptin receptors in defined extra-ARH neuronal subsets, including steroidogenic factor 1 neurons of the ventromedial hypothalamic nucleus (VMH) (25, 26) and glucagon-like peptide-1-expressing neurons of the hindbrain (27), results in increased body weight, without major changes in insulinemia or glycemia. Thus, we sought to better define the role of extra-ARH/VMH neuronal leptin receptor signaling in glucose and energy homeostasis, using Leprflox/flox Syn-cre mice, in which neuronal leptin receptor signaling domains are deleted throughout the CNS but left intact in the ARH, VMH, DMH, and nucleus of the tractus solitarius (NTS).
Materials and Methods
Mice
Leprflox/flox mice (originally provided by Streamson Chua) were mated with B6.Cg-Tg(Syn1-cre)671Jxm/J mice (The Jackson Laboratory), which have a Cre transgene driven by the rat Synapsin1 promoter (Syn-cre), to generate Leprflox/+Syn-cre and Leprflox/+ progeny. Leprflox/+Syn-cre and Leprflox/+ mice were crossed to generate 12.5% Leprflox/flox Syn-cre and 12.5% Leprflox/flox mice. Experimental mice were generated by crossing Leprflox/flox Syn-cre females with Leprflox/flox males, as Syn-cre is expressed in the testes (28), to obtain litters consisting of 50% Leprflox/flox Syn-cre mice and 50% Leprflox/flox controls. A small proportion of Leprflox/flox Syn-cre mice were obese and displayed recombination of the Lepr gene in tail/ear biopsies, indicative of early embryonic Syn-cre expression. To identify and exclude these mice from experiments, all mice were genotyped for Leprflox recombination (primers mLepr101 and mLepr102) in ear or tail biopsies. Lepr+/+Syn-cre and Lepr+/+ mice were generated on the same genetic background as the Leprflox/floxSyn-cre line by intercrossing Lepr+/+Syn-cre and Lepr+/+ mice that were generated from the same Leprflox/+Syn-cre and Leprflox/+ cross above. B6.129(Cg)-Gt(ROSA)26Sortm4(ACTB-tdTomato,EGFP)Luo/J mice (29) (The Jackson Laboratory) were crossed with Syn-cre mice to generate dual-fluorescent reporter mice (R26mTmG/+Syn-cre mice and R26mTmG/+ controls) for analysis of Cre-induced recombination by histology. All mice were housed with a 12-hour light, 12-hour dark cycle with ad libitum access to chow diet (2918; Harlan Laboratories) and water. Where indicated, mice were placed on high-fat diet (45% kcal from fat, number D12451i; Research Diets) or control diet (10% kcal from fat, number D12450Bi; Research Diets) at 8 weeks of age. All procedures with animals were approved by the University of British Columbia Animal Care Committee and were carried out in accordance with the Canadian Council on Animal Care guidelines.
Polymerase chain reaction
To assess the Cre-induced recombination of the Leprflox allele, DNA was extracted by salt extraction (30) from tissues of 12-week-old Leprflox/flox Syn-cre and Leprflox/flox mice. PCR was performed as described previously (31) with primers mLepr101 (5′-ATGCTATCGACAAGCAGCAGAATGACG-3′) and mLepr102 (5′-CAGGCTTGAGAACATGAACACAACAAC-3′) (Supplemental Figure 1A; Integrated DNA Technologies). For measurement of Lepr-b transcript levels in the CNS, dissected brain regions were immediately frozen in liquid nitrogen and stored at −80°C. For the hypothalamus, cerebellum, and brainstem, the entire region was collected and homogenized. For the olfactory bulb, cortex, hippocampus, and spinal cord, a portion of each region was collected and homogenized, with consistency in size and location among mice. RNA was extracted via RNeasy lipid tissue minikit (QIAGEN), with on-column deoxyribonuclease digestion (QIAGEN) according to the manufacturer's instructions. cDNA was synthesized from 310 ng RNA using an iScript cDNA synthesis kit (Bio-Rad Laboratories) and stored at −80°C.
Quantitative PCR for wild-type Lepr-b cDNA was performed with primers LeprE17-forward (5′-AAGTTGTTTTGGGACGATGTTCC-3′) and LeprE17-reverse (5′-GGGACCATCTCATCTTTATTTTTC-3′) (Supplemental Figure 1A) in duplicate using Eva Green SsoFast super mix with low ROX (Bio-Rad Laboratories) in a 20-μL reaction containing 2 μL of 1:5 diluted cDNA and 0.2 μM of each primer, using a StepOnePlus real-time PCR system (Life Technologies Inc) and the following reaction conditions: 95°C for 10 minutes, 40 cycles of 95°C for 15 seconds, 60°C for 60 seconds, and melt curve at 95°C for 15 seconds, 60°C for 60 seconds, + 0.3°C/sec. Phosphoglyceratekinase (Pgk1) was selected as a reference gene by geNorm analysis using BioGazelle qBase+ software in accordance with Minimum Information for Publication of Quantitative Real-Time PCR Experiments guidelines (32) (forward, 5′-GCAGATTGTTTGGAATGGTC-3′; reverse, 5′-TGCTCACATGGCTGACTTTA-3′). Lepr-b cDNA abundance relative to hypothalamic cDNA from a Leprflox/flox control mouse was determined by the method of Pfaffl (33).
Metabolic analyses
Blood glucose and plasma insulin, leptin, glucagon, free fatty acids, triglycerides, and cholesterol were measured from the saphenous vein as previously described (34, 35) after a 4-hour fast unless otherwise indicated. For oral glucose tolerance tests and glucose stimulated insulin secretion tests, mice were fasted for 6 hours and received 1.5 g/kg body weight glucose solution via oral gavage at time 0. Blood glucose or plasma insulin was measured from the saphenous vein at the indicated time points. For insulin tolerance tests, after a 4-hour fast, insulin (Novolin ge Toronto) was injected ip at a dose of 0.85 U/kg body weight at time 0, and blood glucose was measured from the saphenous vein at indicated time points. For 2-deoxyglucose-stimulated glucagon secretion, mice were fasted for 4 hours, and injected ip with 500 mg/kg body weight 2-deoxyglucose (Sigma-Aldrich) or vehicle at time 0. Blood was collected at 15 minutes after the injection for the measurement of plasma glucagon.
Enhanced green fluorescent protein (EGFP) immunofluorescence in brain sections
Mice were transcardially perfused (4% paraformaldehyde in PBS) and brains were fixed overnight, transferred to 25% sucrose for approximately 72 hours, and frozen in an isopentane dry ice bath at −40°C. Brains were sectioned coronally on a sliding microtome at 30 μm in a one-in-six series through the rostrocaudal extent of the hypothalamus and brainstem. For Cre-mediated recombination in R26mTmG/+Syn-cre reporter brains, every sixth section containing hypothalamus or NTS was incubated in rabbit anti-EGFP antibody (antibody details in Supplemental Table 1) in 50 mmol/L potassium PBS (KPBS) with 0.4% Triton X-100 for 2 days at 4°C. Sections were washed and subsequently incubated for 1 hour in AlexaFluor-conjugated secondary antibodies (Life Technologies) in 50 mmol/L KPBS with 0.4% Triton X-100. Sections were mounted on gelatin-coated glass slides, dried overnight, and subsequently hard mounted with 4′,6-diamino-2-phenylindole (DAPI) fluorescence. Whole sections were scanned at ×20 magnification using ImageXpress imaging system (Molecular Devices Corp). Individual images were stitched together to recreate the entire brain section.
Phosphorylated signal transducer and activator of transcription 3 (p-STAT3) immunofluorescence and quantification
Brains were collected and sectioned as above from mice perfused transcardially (4% paraformaldehyde in borate buffer, pH 9.5) 45 minutes after injection of 2 μg/g body weight murine leptin ip (Peprotech). Every sixth section from the cervical spinal cord through the extent of the brainstem and hypothalamus was incubated in rabbit anti-p-STAT3 (Tyr705) and the neuronal nucleus marker mouse anti-NeuN (Supplemental Table 1) in 50 mmol/L KPBS with 0.4% Triton X-100 and 2% normal goat serum for 2 days at 4°C, washed, and incubated for 1 hour in AlexaFluor-conjugated secondary antibodies (Life Technologies) in 50 mmol/L KPBS with 0.4% Triton X-100. Sections were mounted on gelatin-coated glass slides, dried overnight, and subsequently hardmounted with DAPI fluorescence. Whole sections were scanned at ×10 magnification, using the ImageXpress imaging system (Molecular Devices). Individual images were stitched together to recreate the entire brain section. p-STAT3/NeuN double-positive cells were quantified using the Multi Wavelength Cell Scoring module of the MetaXpress software (Molecular Devices), allowing for unbiased quantification of costained cells in a nucleocentric manner. Quantification was performed in anatomically matched sections in the ARH, VMH, dorsomedial hypothalamic nucleus (DMH), lateral hypothalamic area (LHA), ventral premammillary nucleus (PMV), and NTS.
Immunofluorescence in pancreas sections and quantification of β-cell and α-cell area
Pancreas sections were immunostained for insulin, glucagon, and EGFP (Supplemental Table 1) overnight at 4°C and were subsequently incubated with AlexaFluor-conjugated secondary antibodies (Life Technologies) for 1 hour at room temperature and mounted using Vectashield hard set mounting medium for fluorescence with DAPI (Vector Laboratories). Whole sections were scanned at ×20 magnification using ImageXpress imaging system (Molecular Devices). Individual images were stitched together to recreate the entire pancreatic section. The EGFP-positive area was measured relative to total area using the Positive Pixel Count Algorithm on MetaXpress software (Molecular Devices) as previously described (36). Quantification of β-cell and α-cell area was performed as previously described (37).
Adeno-associated virus (AAV) RIP-cre preparation and administration
The AAV RIP-Cre plasmid was generated from a double-stranded AAV RIP-EGFP plasmid kindly provided by Dr Paul Robbins (The Scripps Research Institute), and contains a 410-bp fragment of the rat insulin 1 promoter driving Cre expression. The administration of AAV RIP-cre was performed ip as previously described (38) at a dose of 5 × 10¹² viral genomes 26 days prior to pancreas collection.
Indirect calorimetry and body composition
Mice were anesthetized with isoflurane, and body composition was measured by dual-energy x-ray absorbance, using a Lunar PIXImus 2.0 densitometer (Inside Outside Sales). Indirect calorimetry, activity, and food intake were measured using PhenoMaster/LabMaster metabolic cages (TSE Systems). Mice were singly housed and acclimated for at least 72 hours prior to metabolic measurements. The metabolic run was initiated for three full light-dark cycles at 21°C, with measurements collected every 15–16 minutes. Data collected from the first light and first dark were discarded. Data from two full light and dark cycles were averaged. Energy expenditure was adjusted for lean mass by analysis of covariance (Systat Software).
Streptozotocin (STZ) administration and leptin treatment
Male Leprflox/flox and Leprflox/flox Syn-cre mice were injected ip with 170 mg/kg STZ (Sigma-Aldrich) prepared in acetate buffer (pH 4.5). Diabetes was defined as fasting blood glucose of 16 mmol/L or greater on 2 consecutive days. Osmotic pump (DURECT Corp) implantation was carried out as previously described (35, 37, 39), delivering 10 μg/d (pump catalog number 1002) or 20 μg/d (pump catalog number 1007D) recombinant mouse leptin (Peprotech) or vehicle.
Data analyses
Data are presented as mean ± SEM unless otherwise indicated. Statistical analyses were performed using GraphPad Prism Software. Significance was set at P < .05.
Results
Leprflox/flox Syn-cre mice have disrupted leptin signaling in LHA and PMV neurons
Leprflox/flox Syn-cre mice were generated by crossing mice harboring a Leprflox allele with mice carrying the Syn-cre transgene. Recombination of the Leprflox allele by Cre recombinase produces the LeprΔ17 allele, in which deletion of exon 17 and a frame shift mutation deletes the intracellular domain rendering it incapable of initiating Janus kinase 2-signal transducer and activator of transcription (STAT) signaling and disrupting the intracellular domains of all transmembrane leptin receptor isoforms (40) (Supplemental Figure 1A). To examine the pattern of Syn-cre expression in the brain, we used R26mTmG/+ reporter mice, which express EGFP in cells that have undergone Cre-mediated recombination (29). Male R26mTmG/+Syn-cre mice displayed widespread EGFP immunoreactivity throughout the brain, including the hypothalamus and NTS (Figure 1A). Consistent with this, Leprflox/flox Syn-cre male (Figure 1B) and female (Supplemental Figure 1B) mice had extensive recombination of the Leprflox allele throughout the CNS, with minimal recombination in the cerebellum. Low cerebellum expression of Syn-cre has been previously reported (41). Recombination was not detected in any peripheral tissues except for the testes of male mice (Figure 1C), confirming previous reports (28, 41). Lepr-b transcript abundance was significantly reduced in several CNS regions of Leprflox/flox Syn-cre mice, including the brainstem, cortex, and spinal cord (Figure 1D), whereas nonsignificant reductions in Lepr-b transcript were also observed in the olfactory bulb (P = .097) and the hippocampus (P = .15). Lepr-b transcript was significantly reduced within the hypothalamus; however, approximately 40% remained, suggesting the retention of signaling-competent Lepr-b in some hypothalamic neurons.
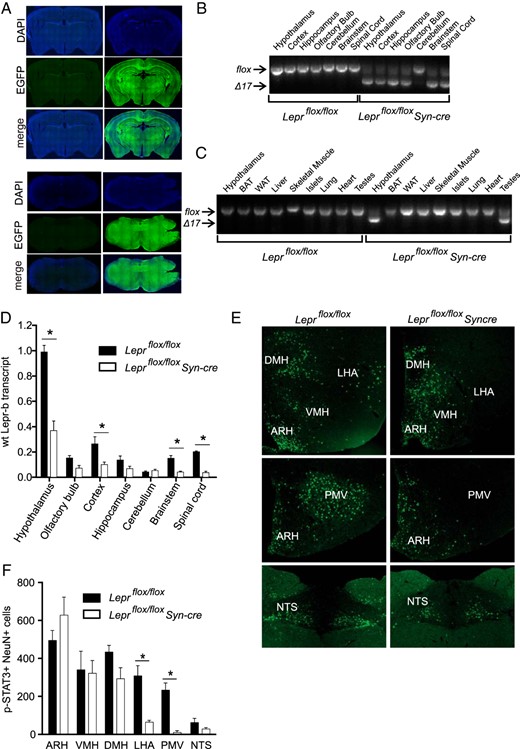
Leprflox/flox Syn-cre mice have disrupted neuronal leptin signaling outside the ARH and VMH. A, Representative images of EGFP immunoreactivity in coronal sections from R26mTmG/+Syn-cre mice (right panels) and R26mTmG/+ controls (left panels) demonstrate widespread Syn-cre-induced recombination in anatomically matched sections at the level of the arcuate nucleus (upper panels) and the NTS (lower panels). Representative images of recombination of Leprflox allele in indicated CNS regions (B) and peripheral tissues (C; with hypothalamus included for comparison), assessed by PCR of genomic DNA from male Leprflox/flox Syn-cre and Leprflox/flox male littermates, using primers mLepr101 and mLepr102. D, Abundance of wild-type (wt) Lepr-b cDNA in CNS regions of 8-week-old Leprflox/flox Syn-cre (n = 5) and Leprflox/flox (n = 4) male mice, assessed by quantitative RT-PCR with LeprE17 primers and expressed relative to Leprflox/flox hypothalamus. E, Representative images of p-STAT3 staining in hypothalamic nuclei (ARH, VMH, DMH, and LHA, top panels; ARH and PMV, middle panels; NTS lower panels) in brain sections from 10-week-old Leprflox/flox Syn-cre (n = 4) male mice and Leprflox/flox littermate (n = 3) controls, 45 minutes after injection of 2 μg/g leptin or vehicle, quantified in panel F. *, P < .05 between genotypes via Student's t test corrected for repeated measures.
To examine the distribution of hypothalamic neurons with impaired hypothalamic leptin receptor signaling, we examined leptin-stimulated p-STAT3 immunoreactivity throughout the brains of male Leprflox/flox Syn-cre and Leprflox/flox mice (Figure 1, E and F). To control for possible p-STAT3 activation in nonneuronal cells of the brain, such as astrocytes or endothelial cells, p-STAT3 was quantified specifically in neuronal cells, identified by positive staining for the neuronal marker NeuN (Figure 1F). Hypothalamic p-STAT3 immunoreactivity was minimal in vehicle-injected Leprflox/flox Syn-cre and Leprflox/flox mice (data not shown). Leptin injection induced robust p-STAT3 immunoreactivity in the hypothalamus of Leprflox/flox mice, particularly within the ARH, and also within the VMH, DMH, LHA, PMV, and NTS. Leprflox/flox Syn-cre mice displayed a similar number of leptin-induced p-STAT3 positive neurons in the ARH, VMH, DMH, and NTS compared with Leprflox/flox mice, revealing that leptin signaling is intact within these nuclei. In contrast, Leprflox/flox Syn-cre mice had a striking reduction of leptin-induced p-STAT3 immunoreactivity in the LHA and PMV. No differences in nonneuronal p-STAT3-positive cells were observed between Leprflox/flox and Leprflox/flox Syncre mice in any brain region (data not shown). A few scattered p-STAT3-positive neurons were observed in the periaqueductal gray region without differences between genotypes (data not shown). No additional regions of p-STAT3-positive neurons were observed, including those regions with significantly reduced Lepr-b transcript levels in Leprflox/flox Syncre mice, namely the hippocampus, cortex, and spinal cord. Therefore, of the regions that respond to peripheral leptin, only the LHA and PMV had reduced neuronal leptin signaling, and consequently, Leprflox/flox Syn-cre mice provide a model to examine the role of neuronal leptin signaling in the LHA and PMV.
Leprflox/flox Syn-cre mice have normal body weight and fasting blood glucose levels
Cohen et al (42) previously reported that mice with Syn-cre-mediated deletion of all leptin receptor isoforms had an approximately 50% reduction in hypothalamic Lepr transcript and did not have altered body weight on average, whereas a small subset of mice had an approximately 85% reduction in hypothalamic Lepr transcript and were obese. We found that Leprflox/flox Syn-cre male (Figure 2A) and female (Figure 2B) mice did not have altered body weight compared with Leprflox/flox littermate controls, consistent with another report by Hinoi et al (43). Body weights of individual male (Supplemental Figure 2A) and female (Supplemental Figure 2B) Leprflox/flox Syn-cre and Leprflox/flox mice were similar in young mice (7 wk of age) but became more variable between individual mice within each group with age. This variation in body weight between individual mice was apparent in both Leprflox/flox Syn-cre mice and Leprflox/flox controls. Like Cohen et al (42), we found that a small subset of Leprflox/flox Syn-cre mice were extremely obese (169% ± 21% increase in body weight compared with littermate controls, P = .04, n = 3) with dramatically reduced hypothalamic Lepr-b transcript levels (5.8% ± 1.4% relative to Leprflox/flox controls); however, each of these obese mice also displayed substantial Leprflox recombination in tail and ear biopsies indicative of mosaic whole-body recombination of Leprflox. This could possibly be due to early embryonic expression of Syn-cre occurring in a small subset of mice. Although it is unknown whether this could account for the small subset of obese mice in the Cohen study, stochastic embryonic expression of Cre has been reported for the Syn-cre model (44) and for another neuron-specific Cre driver, AgRPcre (24). Consequently, we assessed all experimental mice for Leprflox recombination occurring in tail or ear biopsies to exclude these mice from phenotypic analysis.
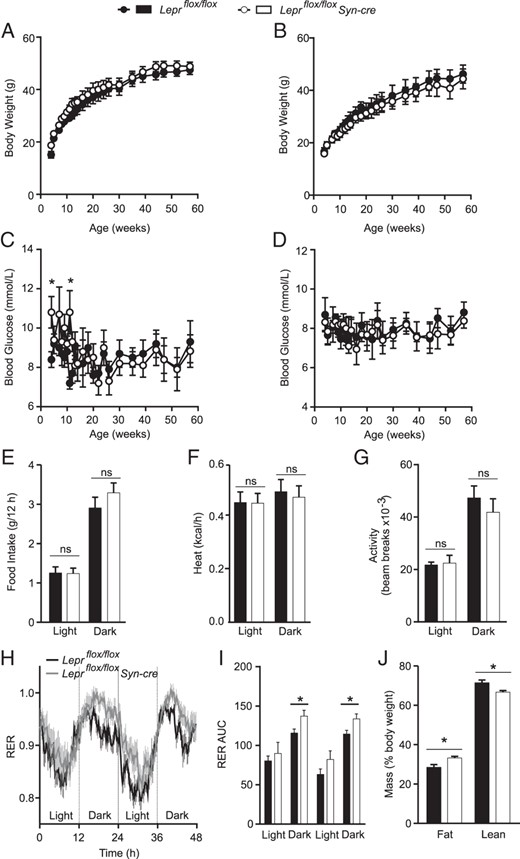
Male and female Leprflox/flox Syn-cre mice have normal body weight and fasting blood glucose. Four-hour-fasted body weight and blood glucose were tracked in male Leprflox/flox Syn-cre mice (white, n = 5) and Leprflox/flox littermate controls (black, n = 8) (A and C) and female Leprflox/flox Syn-cre mice (white, n = 5) and Leprflox/flox littermate controls (black, n = 5) (B and D) from 4 to 58 weeks of age. In a separate cohort of 10-week-old male Leprflox/flox Syn-cre (n = 7) and Leprflox/flox males (n = 6), food intake (E), energy expenditure adjusted for lean mass (F), and locomotor activity measured as total beam breaks (G) were averaged over two light/dark cycles. Respiratory exchange ratios (RERs) were tracked (H) for 48 hours (dark cycle indicated in gray, light cycle indicated in white) and analyzed by AUC (I). Fat and lean mass were measured in the same mice after the completion of the metabolic run (J). *, P < .05 between genotypes via a repeated-measures two-way ANOVA.
Although body weight was not altered, 4-hour fasted blood glucose levels were highly variable in Leprflox/flox Syn-cre young male mice, reaching significantly higher glucose levels on two time points and then stabilizing after 12 weeks of age (Figure 2C). Female Leprflox/flox Syn-cre mice had similar blood glucose levels to those of littermate controls throughout the study (Figure 2D). Food intake (Figure 2E), energy expenditure (Figure 2F), and activity (Figure 2G) were not significantly altered in male mice. Interestingly, the respiratory exchange ratio, a measure of relative carbohydrate and lipid oxidation, was significantly higher in Leprflox/flox Syn-cre males compared with controls during the dark cycle (Figure 2, H and I), and Leprflox/flox Syn-cre males had a modest increase in fat mass with a corresponding decrease in lean mass (Figure 2J). These data suggest that leptin signaling in the LHA and PMV neurons is not necessary for the weight-reducing actions of leptin but may play a role in promoting lipid oxidation.
Leprflox/flox Syn-cre mice have altered insulin and glucagon secretion
Despite having similar body weight, at 7–8 weeks of age Leprflox/flox Syn-cre males displayed fasting hyperinsulinemia and hyperleptinemia relative to littermate controls (Figure 3, A and B), with no significant differences in fasting triglycerides, free fatty acids, or cholesterol (Figure 3, C–E). The difference in insulin and leptin levels was lost as Leprflox/flox Syn-cre and Leprflox/flox mice became similarly hyperinsulinemic and hyperleptinemic with age (Figure 3, A and B). Leprflox/flox Syn-cre male mice had normal glucose tolerance relative to littermate controls (Figure 3, F and G). Despite having basal hyperinsulinemia, young Leprflox/flox Syn-cre male mice had similar incremental glucose-stimulated insulin excursions relative to controls (Figure 3H), evident by the area under the curve (AUC). Insulin levels after the glucose gavage were not different from controls in aged Leprflox/flox Syn-cre males (Figure 3I). No significant differences in metabolic profiles were observed between Leprflox/flox and Leprflox/flox Syn-cre females, although there was a trend toward hyperinsulinemia (Supplemental Table 2). Interestingly, during insulin tolerance tests, Leprflox/flox Syn-cre male mice had a similar insulin-induced decrease in glucose levels as littermate controls but recovered to baseline more rapidly (Figure 3J), a trend also observed in aged Leprflox/flox Syn-cre males (Figure 3K). This suggested that Leprflox/flox Syn-cre males may have an altered counterregulatory response to hypoglycemia. Leprflox/flox Syn-cre mice did not have altered fasting plasma glucagon compared with controls (Figure 3L) but displayed an approximately 2-fold higher glucagon secretion in response to 2-deoxy-D-glucose-induced neuroglycopenia than control littermates (Figure 3M), indicative of an enhanced counterregulatory response to hypoglycemia. No differences in β-cell and α-cell area or mass were observed between Leprflox/flox Syn-cre and Leprflox/flox mice (Figure 3, N and O).
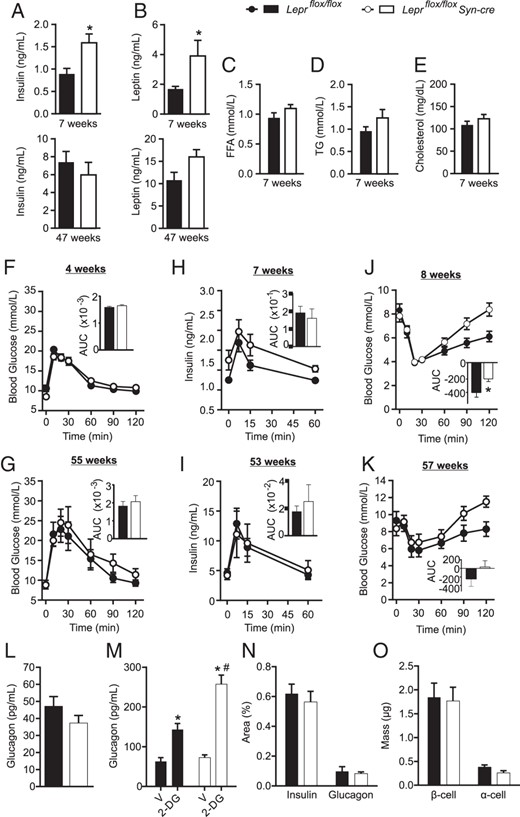
Leprflox/flox Syn-cre male mice are hyperinsulinemic and hyperleptinemic. Four-hour fasted plasma insulin (A), leptin (B), triglyceride (TG; C), free fatty acid (FFA; D), and cholesterol (E) levels were measured in Leprflox/flox Syn-cre (white) and Leprflox/flox (black) male mice at the ages indicated. Oral glucose tolerance tests were performed at 4 weeks (F) and 55 weeks (G) of age, AUC inset. Glucose-stimulated plasma insulin levels were measured at 7 (H) and 53 weeks (I) of age, AUC from baseline inset. Insulin tolerance tests were performed at 8 weeks (J) and 57 weeks (K) of age, net AUC from baseline inset. Overnight-fasted plasma glucagon levels in 8-week-old males (L). Plasma glucagon levels 15 minutes after an ip injection of 250 mg/kg 2-deoxyglucose (2-DG) or vehicle (V) in overnight-fasted 8-week-old mice (M). Insulin- and glucagon-positive area (N) and β-cell and α-cell mass (O) were assessed in 8-week-old Leprflox/flox Syn-cre and Leprflox/flox male mice. Statistical analyses were performed by Student's t test (n = 5–8; A–L) or two-way ANOVA with Holm-Sidak post hoc testing (n = 4–5; M–O). *, P < .05 between genotypes; #, P < .05 between V and 2-DG-injected groups of same genotype.
Given that endogenous Synapsin1 expression has been reported in rat islets (45) and that leptin signaling in α- and β-cells can inhibit glucagon and insulin secretion (31, 46, 47), we assessed the possibility of Syn-cre expression in the pancreatic islets in dual-fluorescent reporter R26mTmG/+ male mice with and without Syn-cre. EGFP immunoreactivity was undetectable in the pancreas of R26mTmG/+Syn-cre mice, similar to R26mTmG/+ controls (Supplemental Figure 3), supporting a lack of Syn-cre expression in pancreatic islets and consistent with the lack of Leprflox recombination seen in pancreatic islets of Leprflox/flox Syn-cre mice (Figure 1C). To examine whether there was a leptin receptor independent effect of Syn-cre on insulin secretion, we measured body weight, glucose tolerance, and glucose-stimulated insulin levels in male and female Lepr+/+Syn-cre and Lepr+/+ mice on the same genetic background as Leprflox/flox Syn-cre mice (Supplemental Figure 4). No differences were observed in any of the parameters measured, between Lepr+/+Syn-cre and Lepr+/+ mice, indicating that the Syn-cre transgene itself does not contribute to this phenotype.
The antidiabetic effect of leptin therapy is maintained in Leprflox/flox Syn-cre mice
Because peripheral (35, 37, 39, 48–52) and central (53–59) leptin therapy has been shown to reverse hyperglycemia in rodent models of type 1 diabetes, we next used Leprflox/flox Syn-cre mice to examine the role of LHA and PMV neuronal leptin signaling in leptin-induced diabetes reversal. Male Leprflox/flox Syn-cre and Leprflox/flox littermates aged 12–14 weeks were injected with STZ, a β-cell toxin. STZ induced similar levels of hyperglycemia, weight loss, hypoleptinemia, and insulinopenia in Leprflox/flox Syn-cre mice and Leprflox/flox controls (Figure 4A-D). Mice were subsequently treated with either 10 μg/d recombinant leptin (Leprflox/flox-L; Leprflox/flox Syn-cre-L) or vehicle (Leprflox/flox-V; Leprflox/flox Syn-cre-V) via implanted sc osmotic pumps. Despite disruption of leptin signaling in the LHA and PMV, hyperglycemia was attenuated as effectively by leptin therapy in Leprflox/flox Syn-cre mice, as it was in Leprflox/flox mice, whereas vehicle-treated controls remained hyperglycemic. On day 10, osmotic pumps were replaced to deliver 20 μg/d leptin or vehicle, but still no difference in glycemic response was observed. Interestingly, there was a nearly significant correlation between endogenous leptin levels prior to STZ administration, and the glucose lowering response to leptin (Supplemental Figure 5B), indicating that endogenous leptin levels prior to STZ-induced diabetes may influence sensitivity to subsequent leptin therapy. Collectively these data suggest that leptin signaling in LHA/PMV neurons is not required to mediate the antidiabetic effect of leptin therapy.
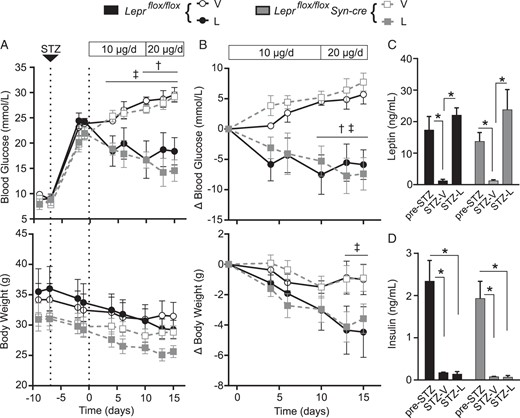
Attenuated neuronal leptin receptor signaling does not block therapeutic leptin action in STZ-diabetic mice. Leprflox/flox Syn-cre and Leprflox/flox male mice aged 11–14 weeks were injected with STZ 7 days prior to implantation of osmotic pumps delivering 10 μg/d leptin or vehicle on day 0. On day 10 after the pump implant, osmotic pumps were replaced delivering 20 μg/d leptin or vehicle. Four-hour-fasted blood glucose (top) and body weight (bottom) were tracked for the study duration and expressed as raw values (A) and relative to baseline on day −1 (B). Groups are as follows: Leprflox/flox-vehicle-treated mice (open black circles, n = 3); Leprflox/flox-leptin-treated mice (filled black circles, n = 5); Leprflox/flox Syn-cre-vehicle-treated mice (open gray squares, n = 5); and Leprflox/flox Syn-cre-leptin-treated mice (filled gray squares, n = 5). Four-hour-fasted plasma leptin (C) and insulin (D) were measured prior to STZ injection on day −9 (pre-STZ), and on day 13 after pump in vehicle- (STZ-vehicle) and leptin (STZ-leptin)-treated groups (n ≥ 3; Leprflox/flox mice in black bars, Leprflox/flox Syn-cre mice in gray bars). Data are presented as mean ± SEM. Statistical analyses were performed by repeated-measures, two-way ANOVA (A and B) or two-way ANOVA (C and D) with a Sidak post hoc test. *, P < .05; †, P < .05, leptin vs vehicle-treated Leprflox/flox mice; ‡, P < .05, leptin vs vehicle-treated Leprflox/flox Syn-cre mice. No significant differences were found between Leprflox/flox Syn-cre vs Leprflox/flox mice receiving the same treatment.
Leprflox/flox Syn-cre mice are protected from diet-induced weight gain and glucose intolerance
We next sought to use Leprflox/flox Syn-cre mice to examine the role of LHA/PMV leptin responsive neurons in diet-induced obesity. At 8 weeks of age, Leprflox/flox Syn-cre and Leprflox/flox male littermates were administered a high-fat diet (HFD) or a low-fat control diet (LFD). Leprflox/flox mice placed on HFD rapidly gained weight relative to LFD fed Leprflox/flox mice (Figure 5A). Remarkably, Leprflox/flox Syn-cre mice were protected from HFD-induced weight gain compared with HFD fed Leprflox/flox controls. Blood glucose levels were not different between genotypes over the course of the study (Figure 5B). HFD-fed Leprflox/flox mice displayed significantly impaired glucose tolerance relative to LFD controls after only 5 weeks of the diet, whereas Leprflox/flox Syn-cre mice were relatively protected from diet-induced glucose intolerance (Figure 5C). After 14 weeks, both HFD fed groups had similarly impaired glucose tolerance (Figure 5D), suggesting that in Leprflox/flox Syn-cre mice, diet-induced glucose intolerance is delayed but not completely prevented.
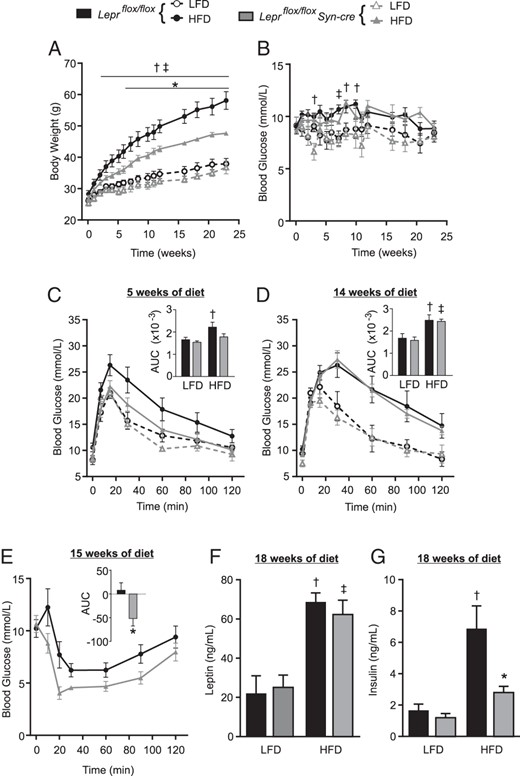
Leprflox/flox Syn-cre mice are protected from HFD-induced weight gain and glucose intolerance. At 8 weeks of age (time 0) male Leprflox/flox Syn-cre mice (gray triangles) and Leprflox/flox littermates (black circles) were placed on a HFD (filled symbols) or LFD (open symbols) for 24 weeks (n = 5–7 for HFD and n = 4–6 for LFD groups). Four-hour-fasted body weight (A) and blood glucose (B) were tracked over the course of diet manipulation. Oral glucose tolerance tests were performed at 5 (C) and 14 (D) weeks of diet manipulation, AUC inset. An insulin tolerance test was performed on HFD fed mice at 15 weeks of diet manipulation (E). One HFD fed Leprflox/flox Syn-cre mouse could not continue the insulin tolerance test after 20 minutes after injection due to hypoglycemia. Net AUC calculated from 0 to 20 minutes is inset. Four-hour-fasted plasma insulin (F) and leptin (G) were measured at 18 weeks of diet manipulation. Statistical analyses were performed by a two-way ANOVA (C–D, F, and G), a repeated-measures, two-way ANOVA (A-B) with Sidak post hoc testing, or Student's t test (E). ‡, P < .05, Leprflox/flox mice, HFD vs LFD; †, P < .05, Leprflox/flox Syn-cre mice, HFD vs LFD; *, P < .05, Leprflox/flox Syn-cre vs Leprflox/flox fed HFD. No statistical differences were found between Leprflox/flox Syn-cre and Leprflox/flox on the LFD.
During insulin tolerance tests, Leprflox/flox Syn-cre mice were also significantly more insulin sensitive compared with Leprflox/flox mice on the HFD (Figure 5E). Both Leprflox/flox Syn-cre and littermate controls were hyperleptinemic after 18 weeks on HFD (Figure 5F). Interestingly, Leprflox/flox Syn-cre mice had significantly blunted hyperinsulinemia on HFD, similar to LFD-fed controls (Figure 5G). We repeated HFD feeding in a second cohort of male mice and confirmed that diet-induced weight gain and hyperinsulinemia were blunted in Leprflox/flox Syn-cre mice relative to Leprflox/flox littermates (Figure 6, A–D). Notably, although HFD-induced hyperinsulinemia was apparent as early as 2 weeks on the HFD in Leprflox/flox controls, insulin levels remained relatively stable in Leprflox/floxSyn-cre mice on the HFD (Figure 6D). Protection from diet-induced weight gain in Leprflox/flox Syn-cre mice corresponded with significantly less lean mass gain and a trend toward reduced fat mass gain (Figure 6, E and F). There were no differences between food intake (Figure 6, G and H), energy expenditure, or activity (Figure 6, I and J) in Leprflox/flox Syn-cre mice compared with Leprflox/flox controls. These data reveal that disruption of neuronal leptin signaling in the LHA and PMV, while leaving ARH, VMH, DMH and NTS leptin signaling intact, limits weight gain, hyperinsulinemia, and glucose intolerance in diet-induced obese male mice.

Leprflox/flox Syn-cre mice are protected from HFD-induced hyperinsulinemia, without overt changes in food intake or energy expenditure. At 8 weeks of age (time 0), male Leprflox/flox Syn-cre mice (gray triangles, n = 6) and Leprflox/flox littermates (black circles, n = 3) were placed on a HFD for 30 weeks. Four-hour-fasted body weight (A), blood glucose (B), plasma leptin (C), plasma insulin (D), lean mass (E), and fat mass (F) were tracked over the course of the HFD. Average daily food intake (G), cumulative food intake (H), energy expenditure adjusted to lean mass (I), and locomotor activity measured as total beam breaks (J) were measured in mice after 10 weeks of diet manipulation. Statistical analyses were performed by a two-way, repeated-measures ANOVA with a Sidak post hoc test (A–F) or by a Student's t test (G–J). Energy expenditure values in panel I were adjusted to lean body mass and analyzed by analysis of covariance. *, P < .05, Leprflox/flox Syn-cre vs Leprflox/flox.
Discussion
In the current study, we examined the role of LHA and PMV neuronal leptin signaling by examining glucose homeostasis in Leprflox/flox Syn-cre mice, which we found to have disrupted Lepr-b signaling in neurons of the LHA and PMV, while maintaining leptin signaling in ARH, VMH, DMH, and NTS neurons. Disruption of leptin signaling in the LHA/PMV had no effect on body weight, food intake, energy expenditure or glucose tolerance but resulted in hyperleptinemia, hyperinsulinemia, and increased counterregulatory glucagon secretion. The differences in insulin and leptin levels were age dependent and were lost as male mice became more hyperinsulinemic and hyperleptinemic with age. Metabolic parameters were not different between Leprflox/flox Syn-cre and Leprflox/flox female mice. Unexpectedly, Leprflox/flox Syn-cre male mice were protected from diet-induced weight gain, without significant differences in daily food intake or energy expenditure relative to Leprflox/flox controls on HFD. In addition, Leprflox/flox Syn-cre male mice were transiently protected from glucose intolerance and hyperinsulinemia when fed a HFD. Collectively these data reveal an important role for neuronal leptin signaling in the LHA and PMV in the regulation of insulin and glucagon levels; in young male mice on a chow diet, LHA/PMV leptin-responsive neurons contribute to the suppression of insulin and glucagon levels, and in diet-induced obese male mice, these neurons may promote diet-induced hyperinsulinemia and weight gain.
Several limitations to this study exist. As necessitated due to the expression of Syn-cre in testes, Leprflox/flox Syn-cre females were mated with Leprflox/flox males. Therefore, it is possible that a maternal effect influences the parameters measured in both Leprflox/flox Syn-cre and Leprflox/flox experimental mice. The direct comparison with littermate Leprflox/flox controls in all our studies allows us to conclude that the observed phenotype is due to the loss of LHA/PMV leptin signaling in experimental mice, although a possible interaction between the Leprflox/flox Syn-cre genotype and the in utero environment provided by the Leprflox/flox Syn-cre mother could exist. Interestingly, leptin signaling in PMV neurons is important for fertility (60); although we did not test effects on fertility or sexual behavior directly, Leprflox/flox Syn-cre females mated with Leprflox/flox males did produce litters. This is consistent with a report that shows leptin responsive neurons in the PMV are sufficient but not required for leptin's effect on fertility (61). Secondly, although we observed a trend toward hyperinsulinemia in young females on the chow diet, this did not reach significance due to substantial variability between mice. Because we did not control for differences in estrous cycle stages between individual females, this could contribute to the observed variability and may potentially mask a true phenotype. Alternatively, differences in hyperinsulinemia between males and females may be related to sex differences in insulin sensitivity and β-cell function. Another limitation is that Syn-cre is expressed in neurons at embryonic day 12.5, and thus, the phenotype of Leprflox/flox Syn-cre mice may be due to disrupting neuronal leptin signaling during development rather than the disruption of leptin signaling of LHA/PMV neurons in adulthood. Such a role for leptin in promoting neurite outgrowth has previously been demonstrated for ARH neurons during the early postnatal period (62). Finally, we cannot determine whether the metabolic phenotype we observe in Leprflox/flox Syn-cre mice is mediated predominantly by the LHA, PMV, or a combination of the two. Finally, because we observed a trend toward decreased p-STAT3 in the DMH and NTS, this may indicate that leptin signaling was also diminished in a small subpopulation of neurons within these regions, which could also contribute to the observed phenotype.
Cohen et al (42) reported that similar mice with a Syn-cre-mediated deletion of all leptin receptor isoforms had no body weight phenotype but that a small subset were obese, corresponding to an 85% reduction in hypothalamic Lepr expression, whereas most mice were not obese with an approximately 50% reduction of hypothalamic Lepr expression. Similar to Cohen et al, we found that Syn-cre reduced expression of Lepr-b by only approximately 60% in the hypothalamus (although recombination was more robust in other brain regions) and that approximately 94% of Leprflox/flox Syn-cre mice were not obese, whereas a small subset of mice were obese with very low hypothalamic Lepr-b expression. However, these obese mice also had an off-target whole-body recombination of Leprflox potentially resulting from early embryonic expression of Syn-cre. Interestingly, similar early embryonic expression has been reported recently in the Syn-cre model (44) and in mice expressing Cre under the AgRP promoter (24). It is unclear whether the obese subset of mice in the study by Cohen et al also had early embryonic Syn-cre expression, resulting in whole-body mosaic Lepr deletion. Nevertheless, our study along with those of Cohen et al (42) and Hinoi et al (43) clearly demonstrates that on the chow diet, the deletion of leptin receptors by Syn-cre does not alter body weight in most mice. The low level of Lepr recombination we observed in the hypothalamus of Leprflox/flox Syn-cre mice is likely accounted for by mosaic Syn-cre expression within various hypothalamic nuclei, consistent with the disruption of leptin signaling in the LHA and PMV but not in the ARH, VMH, and DMH as demonstrated by immunofluorescent p-STAT3 analysis. Whereas we did not quantify p-STAT3 localization specifically in AgRP and POMC neurons of the ARH, a recent report determined that Syn-cre-induced recombination in reporter mice was not observed in AgRP and POMC neurons (44). Because ARH-restricted reconstitution of leptin signaling in leptin receptor-deficient mice is sufficient to reduce body weight and reverse hyperglycemia in leptin receptor-deficient rodents (19–22), the preservation of functional leptin signaling in the ARH of Leprflox/flox Syn-cre mice likely explains the lack of body weight phenotype.
The results of this study reveal an indispensable role for leptin signaling in LHA/PMV neurons in regulating insulin and glucagon levels. The hyperinsulinemia observed in young chow-fed Leprflox/flox Syn-cre mice is consistent with the well-documented suppressive effect of leptin on insulin secretion that occurs through hypothalamic and direct β-cell signaling pathways (47, 63). In addition, the increased counterregulatory glucagon secretion in Leprflox/flox Syn-cre mice indicates a role for leptin signaling in LHA/PMV neurons in suppressing neuroglycopenia-induced glucagon secretion. Interestingly, augmented glucose-sensing within LHA neurons increases counterregulatory glucagon secretion (64). Leptin signaling in glucose-sensing neurons of the parabrachial nucleus inhibits the sympathetic response to hypoglycemia (65), and Hinoi et al (43) reported that Leprflox/flox Syn-cre mice have reduced sympathetic tone. We have observed hypoglycemia in mouse models of type 1 diabetes treated with high doses of leptin (39). Therefore, in addition to directly suppressing glucagon secretion in α-cells (46), the current study suggests that leptin may promote hypoglycemia in part by acting on LHA/PMV neurons to dampen the neuronal response that initiates sympathetically-induced glucagon secretion. Nevertheless, this pathway does not appear to be required for leptin-induced glucose lowering in STZ-induced diabetic models because hyperglycemia was attenuated by leptin therapy in Leprflox/flox Syn-cre mice.
Antibody Table
| Peptide/Protein Target | Name of Antibody | Manufacturer, Catalog Number, and/or Name of Individual Providing the Antibody | Species Raised (Monoclonal or Polyclonal) | Dilution Used |
|---|---|---|---|---|
| EGFP | Anti-GFP | Invitrogen, A-11122 | Rabbit polyclonal | 1:1000–1:2000 |
| p-STAT3 (Tyr705) | Anti-p-STAT3 (Tyr705) | Cell Signaling, 9145 | Rabbit polyclonal | 1:100 |
| Insulin | Anti-insulin | Sigma-Aldrich, I8510 | Guinea pig polyclonal | 1:1000 |
| Glucagon | Anti-glucagon | Sigma-Aldrich, G2654 | Mouse monoclonal | 1:1000 |
| NeuN | Anti-NeuN clone A60 | Millipore, MAB377 | Mouse monoclonal | 1:100 |
Perhaps the most surprising finding in this study was that on the HFD, Leprflox/floxSyn-cre mice were protected from hyperinsulinemia and weight gain. This is in stark contrast to the known effects of leptin in inhibiting weight gain and suppressing insulin secretion through ARH neurons. Thus, our study indicates that in HFD-fed mice, leptin action in a subset of neurons in the LHA/PMV may have an opposing effect on insulin levels and body weight to that of leptin action in the ARH. Although surprising, this is consistent with the theory of selective leptin resistance. In diet-induced obese rodents, it has been reported that leptin resistance occurs specifically within the ARH, whereas leptin signaling is maintained in other hypothalamic nuclei (66, 67). Thus, the contribution of leptin resistance to weight gain may be primarily due to defects in ARH leptin signaling. In contrast, the maintenance of leptin signaling in the DMH during diet-induced obesity has been implicated in some deleterious effects of obesity, including increased sympathetic tone and blood pressure (67–69). Similarly, we postulate that leptin signaling in LHA/PMV neurons has deleterious effects on body weight and glucose metabolism, as diminished leptin signaling in the LHA/PMV of Leprflox/flox Syn-cre mice resulted in protection from diet-induced weight gain, glucose intolerance, and hyperinsulinemia. In absolute leptin/leptin receptor deficiency, the protective effect of deleting leptin receptors in LHA/PMV neurons is likely masked by the obesogenic impact of disrupted ARH leptin signaling. Likewise, distinct neuronal subsets that exert opposing biological outcomes in response to insulin have also been recently reported (70). The precise mechanism by which disrupted LHA/PMV neuronal leptin signaling limits weight gain in Leprflox/flox Syn-cre mice requires further study. A possible explanation is that the blunted HFD-induced hyperinsulinemia drives the protection against weight gain and glucose intolerance in these mice. Indeed, several lines of evidence suggest that limiting hyperinsulinemia can protect against obesity and its associated metabolic defects: 1) reduced insulin gene dosage protects against diet-induced obesity and glucose intolerance (71, 72); 2) hyperinsulinemia develops prior to obesity in leptin-deficient and leptin receptor-deficient rodents (5, 73–80); and 3) pharmacological inhibition of hyperinsulinemia by diazoxide reverses insulin resistance in mice with dysfunctional leptin signaling in β-cells (81). Further delineation of these putative hyperinsulinemia-promoting, leptin-responsive LHA and PMV neurons will require Lepr-b deletion in specific neuronal subsets and could help to elucidate the complex role of central leptin signaling in glucose homeostasis.
Acknowledgments
Author contributions included the following: H.C.D. and T.J.K. conceived and designed the experiments. H.C.D. researched and analyzed the data and wrote the manuscript. E.T. and M.M.G. provided technical assistance and contributed to the discussion and interpretation of the data and experimental design. M.M.G. performed the staining and quantification of the brain sections. S.K. and S.M.C. contributed to the collection, analysis, and discussion of the data and provided the equipment and expertise for all the experiments involving metabolic cages and dual-energy x-ray absorbance. M.P., W.L.Q., and H.S. researched and analyzed the data. All authors contributed to the discussion and revision of the manuscript and approved the final version. T.J.K. is the guarantor of this work.
This work was supported by the Canadian Institutes of Health Research. T.J.K. received a senior scholarship from the Michael Smith Foundation for Health Research. H.C.D. was supported by an Alexander Graham Bell Canada Graduate Scholarship from the Natural Sciences and Engineering Research Council of Canada. E.T. received a fellowship from the Canadian Diabetes Association. S.M.C. is a Canada Research Chair and Michael Smith Foundation for Health Research Scholar.
Disclosure Summary: The authors have nothing to disclose.
Abbreviations
- AAV
adeno-associated virus
- AgRP
agouti-related peptide
- ARH
arcuate hypothalamic nucleus
- AUC
area under the curve
- CNS
central nervous system
- DAPI
4′,6-diamino-2-phenylindole
- DMH
dorsomedial hypothalamic nucleus
- EGFP
enhanced green fluorescent protein
- HFD
high-fat diet
- KPBS
potassium PBS
- LHA
lateral hypothalamic area
- LFD
low-fat diet
- NTS
nucleus of the tractus solitarius
- PMV
ventral premammillary nucleus
- POMC
proopiomelanocortin
- p-STAT3
phosphorylated-STAT3
- STAT
signal transducer and activator of transcription
- STZ
streptozotocin
- VMH
ventromedial hypothalamic nucleus.
