


Although Agouti-related peptide (AgRP) neurons play a key role in the regulation of food intake, their contribution to the anorexia caused by proinflammatory insults has yet to be identified. Using a combination of neuroanatomical and pharmacogenetics experiments, this study sought to investigate the importance of AgRP neurons and downstream targets in the anorexia caused by the peripheral administration of a moderate dose of lipopolysaccharide (LPS) (100 μg/kg, ip). First, in the C57/Bl6 mouse, we demonstrated that LPS induced c-fos in select AgRP-innervated brain sites involved in feeding but not in any arcuate proopiomelanocortin neurons. Double immunohistochemistry further showed that LPS selectively induced c-Fos in a large subset of melanocortin 4 receptor-expressing neurons in the lateral parabrachial nucleus. Secondly, we used pharmacogenetics to stimulate the activity of AgRP neurons during the course of LPS-induced anorexia. In AgRP-Cre mice expressing the designer receptor hM3Dq-Gq only in AgRP neurons, the administration of the designer drug clozapine-N-oxide (CNO) induced robust food intake. Strikingly, CNO-mediated food intake was rapidly and completely blunted by the coadministration of LPS. Neuroanatomical experiments further indicated that LPS did not interfere with the ability of CNO to stimulate c-Fos in AgRP neurons. In summary, our findings combined together support the view that the stimulation of select AgRP-innervated brain sites and target neurons, rather than the inhibition of AgRP neurons themselves, is likely to contribute to the rapid suppression of food intake observed during acute bacterial endotoxemia.
Diminished appetite levels are a common symptom of a large number of communicable and noncommunicable chronic diseases (1–4). The lack of appetite seen in these diseases is often associated with and is believed to be partly mediated by elevated circulating levels of proinflammatory cytokines. Arguably, proinflammatory cytokines are among the most potent endogenous anorectic factors known to physiologists (5–9). Notably, the cellular and molecular mechanisms underlying inflammatory-associated anorexia have commonly been studied in laboratory rodents in response to the peripheral administration of bacterial lipopolysaccharide (LPS), a potent inducer of the release of proinflammatory cytokines from macrophages and microglia (10–12). Although the neural pathways recruited in response to LPS have been extensively mapped in the past (13–18), the neural pathways responsible for initiating LPS-induced anorexia have yet to be identified definitively. In particular, the relative contribution of hypothalamic neurons to the anorexia caused by inflammatory insults has been difficult to demonstrate (19, 20).
Agouti-related peptide (AgRP)-expressing neurons form a discrete population of cells exclusively located in the arcuate nucleus of the hypothalamus (ARC) (21–23). As recently emphasized by several chemo- and opto-genetic studies, AgRP neurons play a critical role in the regulation of feeding behavior. Specifically, although the activation of AgRP neurons rapidly initiates robust food intake, conversely, the inhibition or ablation of AgRP neurons is sufficient to suppress feeding behavior (24–28). Moreover, although AgRP neurons innervate a large number of brain sites distributed across the neuraxis (21, 23, 29), 4 identified brain sites are sufficient to mediate the orexigenic actions of AgRP neurons (24). Hence, AgRP neurons exert a rapid, robust and mandatory regulatory effect on food intake via a well-delineated neural circuit. Notably, proopiomelanocortin (POMC) neurons residing in the ARC are known to oppose the orexigenic actions of AgRP neurons via melanocortin-4 receptor (MC4R) signaling (30, 31). Considering the key role of AgRP neurons in the regulation of appetite, it has been postulated that inflammatory anorexia might be caused by the inhibition of AgRP neurons by proinflammatory factors. As explained before, the inhibition or ablation of AgRP neurons is sufficient to suppress feeding behavior. In agreement with such a view, one study demonstrated that LPS could hyperpolarize AgRP neurons when applied ex vivo to preparations of the hypothalamus (32). Moreover, IL-1β was also shown to decrease the release of AgRP from brain slices (33). AgRP mRNA itself was demonstrated to be reduced transiently after the administration of LPS or the anorectic cytokine ciliary neurotrophic factor (6, 34). In addition, central injection of AgRP diminished the anorectic effects of LPS (35, 36). In contrast, other studies have demonstrated a lack of involvement of ARC neurons in inflammatory anorexia. For example, we and others have found no clear evidence that the administration of LPS significantly regulated neuropeptides or immediate early gene expression in ARC neurons (13, 18, 37, 38). Importantly, Reyes and Sawchenko (19) elegantly showed that neither the chemical ablation of ARC neurons nor the surgical disconnection of the ARC afferents from the remainder of the brain prevented IL-1β-induced anorexia, suggesting that the neurons located in the ARC are not critical to the initiation of an inflammatory anorexia.
Here, using neuroanatomical techniques, we attempted to delineate the exact neural circuits linking LPS-induced anorexia to the AgRP pathway. Moreover, we hypothesized that, if the cellular inhibition of AgRP neurons played a causative role in mediating inflammatory anorexia, then the experimental activation of AgRP neurons during inflammation would significantly attenuate the anorexia caused by an inflammatory insult. To test the above hypothesis, we sought to activate AgRP neurons using pharmacogenetics during the course of an anorexia caused by peripheral LPS.
Materials and Methods
Mice
The experimental mice were all single-housed age-matched males housed in a light (12 h on/12 h off; lights on at 6 am)- and temperature-controlled environment (21.5°C–22.5°C) with ad libitum access to standard chow (Harlan Teklad TD.2016 Global). Females were only used for breeding purposes. All the procedures listed below including surgeries were approved by The University of Texas Southwestern Institutional Animal Care and Use Committee, under protocols 1090–06-02–1 and 2013–0062. The breeding of MC4R-GFP mice was approved by the University of Iowa Institutional Animal Care and Use Committee.
Wild-type mice
Mice with a pure C57Bl/6 background were used for histology. Experiments were performed with these animals when they reached 6 weeks of age. These mice were all obtained from the Animal Resource Center at The University of Texas Southwestern Medical Center.
MC4R-GFP mice
Histology was performed on the brain of 6 mice on a mixed C57Bl/6 background that expressed τ-Sapphire green fluorescent protein (GFP) under the control of the MC4R promoter. These mice were extensively characterized by us in the past (39, 40). Experiments were performed with these animals over 7 weeks of age. These mice were all obtained from the Office of Animal Resource at the University of Iowa (39, 40).
AgRP-Cre mice
To conduct pharmacogenetics, AgRP-Cre mice were obtained from the Lowell lab (41) and were bred onto a C57Bl/6 background using standard breeding strategies, and genotyped using 3 primers (JJa12, GGGCCCTAAGTTGAGTTTTCCT; JJa13, GATTACCCAACCTGGGCAGAAC; and JJa14, GGGTCGC TACAGACGTTGTTTG). Brain surgery was performed on the mice positive for AgRP-Cre when they reached 6 weeks of age.
Pharmacogenetics and brain surgery
AgRP neurons were activated in a reversible and temporally restricted manner using pharmacogenetics and the technique called designer receptors exclusively activated by designer drug (26). To the best of our knowledge, designer receptors exclusively activated by designer drug has been seldom used to investigate inflammatory anorexia (42). A unique advantage of this technique is that it allows for robust stimulation of feeding without the need for fasting of animals, which can interfere with immunity and the endocrine axis (43–45). Moreover, each mouse can be used as its own control. Briefly, AgRP-Cre mice were anesthetized with ketamine/xylazine (120/16 mg/kg, ip) and treated with carprofen analgesic (5 mg/kg, sc). Using a stereotaxic apparatus (Kopf), we delivered to the ARC (−1.46 mm from the bregma, ±0.25 mm from midline, −5.56 mm from the dura) an adeno-associated virus (AAV) of serotype 8 expressing in a Cre-dependent manner a designer receptor coupled to Gq signaling (hM3D-Gq-mCherry) (University of North Carolina). This vector was originally constructed by Dr Bryan Roth. To minimize brain injury, the AAV8 was administered using a glass micropipette connected to an air-pressure system, as described by us (46). Each mouse unilaterally received 150 nL of virus over a period of 5 minutes.
Feeding studies
Starting 2 weeks after brain surgery, at the beginning of the light phase (between 9 and 10 am), individually housed and fed ad libitum AgRP-Cre mice were randomized to receive pyrogen-free 0.9% saline, a ligand called clozapine-N-oxide (CNO), or a combination of CNO and LPS (see dosage below). A couple of food pellets placed in each basket was weighed at 1, 2, 4, and 24 hours after injection. In crossover studies, the same mice received alternate treatments at 1-week intervals. LPS was never injected twice in the same mouse to avoid endotoxin tolerance.
We also sought to examine the early anorectic response to LPS in a separate cohort of AgRP-Cre mice that received brain surgery, as described before. Two weeks after surgery, an observer continuously recorded the feeding bouts of each mouse over a period of 40 minutes after the administration of CNO (between 9 and 10 am). A feeding bout was only considered when the mouse was seen eating chow in its food basket or in its paw. Other behaviors, such as sniffing food or eating of feces or bedding, were not included. One week later, the experiment was repeated after the coadministration of CNO and LPS. Data were used to calculate the latency to start feeding and the length and number of feeding bouts, as well as the total amount of time spent eating.
Drug preparation and dosage
A stock solution of CNO (C0832; Sigma) was prepared by adding 5 mg of CNO to 1 mL of water containing 100-mg α-cyclodextrin (10016-20-3; Fisher). Aliquots were kept at −20°C until needed. CNO was administered at 1 mg/kg of body weight (ip) by freshly diluting CNO stock solution 50× in sterile 0.9% saline (Sigma) and then injecting a volume (μL) corresponding to 10× body weight. This dose was used in previous feeding studies (31, 47).
A stock solution of LPS at 1 mg/mL (Sigma L2880 Escherichia coli 055:B5) was prepared in sterile pyrogen-free 0.9% saline (Sigma), aliquoted, and stored at −20°C until needed. LPS was diluted 100× in sterile saline or freshly made CNO (see above). We administered a single dose of LPS at 100 μg/kg of body weight (ip). We chose a moderate dose of LPS very commonly used in feeding studies performed in using laboratory rodents (48–53).
Immunohistochemistry (IHC)
The mice were deeply anesthetized with chloral hydrate (500 mg/kg, ip) at between 9 and 11 am and were transcardially perfused with 0.9% saline followed by 10% formalin. Their brains were rapidly collected and immerged overnight in a solution of 20% sucrose in PBS (pH 7.4). Coronal cryostat-cut sections (25 μm) were collected in PBS, transferred to cryoprotective solution, and kept at −20°C until needed. After several PBS washes, the sections were incubated overnight at room temperature in the primary antisera of interest in 1% normal donkey serum with 0.1% Triton X-100 in PBS (pH 7.4). For peroxidase applications, tissue was pretreated with 1% H2O2 in PBS for 10 minutes. The primary antisera used in the present study included a rabbit polyclonal antibody against c-fos (1:2000, F7799; Sigma), a goat polyclonal antibody against AgRP (1:1000, AF634; R&D Systems), a chicken anti-GFP polyclonal antibody (1:1000, GFP-1020; Aves Labs), and a rabbit polyclonal antibody against Discosoma sp. red fluorescent protein (DsRed) that recognizes mCherry (1:1000, 632496; Clontech). Controls for specificity can be found in previous studies and manufacturer's reports using these primary antisera (39, 54–56). Moreover, staining in our samples displayed an intracellular distribution pattern consistent with aforementioned previous reports. After several PBS washes, sections were incubated for 1 hour at room temperature in a biotinylated antirabbit (1:1000, 711-065-152; Jackson ImmunoResearch), a goat antichicken Alexa Fluor 488 (1:1000, A11039; Life Technologies), antirabbit Alexa Fluor 488 (1:1000, A21206; Life Technologies), or antigoat Alexa Fluor 594 (1:1000, A-11058; Life Technologies) secondary antibodies. After the biotinylated secondary antibodies, tissue was incubated with Streptavidin Alexa Fluor 488 (1:1000, S11223; Invitrogen) or in a solution of ABC (Vectastain Elite ABC kit; 1:1000). Peroxidase-labeled tissue was revealed in a solution containing 0.04% diaminobenzidine (DAB) (Sigma) and 0.01% H2O2. All of our fluorescent samples were mounted on SuperFrost slides before being coverslipped with Vectashield mounting medium containing 4′,6-diamino-2-phenylindole, dihydrochloride (DAPI) (H-1500; Vector Laboratories). DAB-labeled samples were mounted on SuperFrost slides, dehydrated in ethanol, immersed in xylene, and mounted with Permaslips.
In situ hybridization (ISH)
Brains from C57Bl/6 mice were processed for double fluorescent ISH after the administration of sterile pyrogen-free 0.9% saline (Sigma), LPS (see above for route and dosage). At 1 hour and 30 minutes after injection, the mice received an overdose of chloral hydrate (500 mg/kg, ip). Their brains were rapidly dissected and frozen on dry ice on a piece of aluminum foil. A cryostat was used to prepare 12- to 14-μm sections on SuperFrost slides. Tissue was kept at −20°C during the sectioning before being stored at −80°C. The tissue was processed for ISH following the manufacturer's instructions (Advanced Cell Diagnostic). Briefly, the tissue was fixed tissue in 10% formalin and was pretreated with a protease-based solution (pretreatment 4) followed by hybridization at 40°C for 2 hours with double-Z oligo probes. The probes were mixed at a ratio of 50:1 by volume (c1:c2 probes). Table 1 summarizes the probes used in the current study. Signal amplification was achieved using specific fluorophores (fluorescein for channel 1 and cyanine for channel 2). Fluorescently labeled sections were counterstained with DAPI (H-1500; Vector Laboratories).
List of Reagents Used for ISH
| ISH RNAScope Probes | ||||
|---|---|---|---|---|
| Gene Name(s) | Accession Number | Probe Region | Manufacturer | Catalog Number |
| Agrp | NM_001271806.1 | 11–764 | Advanced Cell Diagnostics | 400711-C2 |
| C-fos | NM_010234.2 | 443–1447 | Advanced Cell Diagnostics | 316921-C1 |
| Pomc | NM_008895.3 | 19–995 | Advanced Cell Diagnostics | 314081-C2 |
Microscopy and digital images
Brightfield images were captured using a Zeiss microscope (Imager ZI) attached to a digital camera (Axiocam). A camera lucida attached to the microscope was also used to draw brain sections containing mCherry-, c-fos-, and AgRP-positive cells and fibers. Fluorescent digital images were all acquired with the ×63 objective (oil) of a Leica TCS SP5 confocal microscope (The University of Texas Southwestern Live Cell Imaging Core). Scanning parameters were adjusted appropriately to improve the signal/background. We collected z-stacks separated by 0.35–0.45 μm in a 512 × 512-pixel format. NIH ImageJ software was used to generate our final TIFF images with combined z-stacks. Adobe Photoshop CS2 software was used to combine digital images into plates with annotations. The contrast, brightness, and vibrance of our final images were uniformly adjusted. DAPI-stained nuclei were converted to gray for better contrast. Finally, the abbreviations and levels relative to the bregma were derived from Franklin and Paxinos's Mouse Brain in Stereotaxic Coordinates (3rd edition).
Histology analysis
Fluorescent ISH signals were evaluated on single optical sections of the ARC, acquired by confocal microscopy. Specifically, we counted the number of fluorescent dots per identified cell profile with a DAPI-counterstained nucleus. Brain sections doubly labeled for Agrp, Pomc, and c-fos mRNAs was used to estimate the signal for c-fos in ARC cell profiles in 4 mice per experimental condition (saline vs LPS). Although the Pomc mRNA signal was too high to be evaluated reliably, a visual inspection of our tissues did not reveal obvious differences between saline- and LPS-treated animals. In the hypothalamus, the cell profiles of individual AgRP and POMC neurons was readily identifiable by a simple visual inspection, because these neurons are generally sufficiently far apart from each other to be distinguished. DAB-labeled brain sections were used to count manually the total number of mCherry-positive cells across the ARC of the AgRP-Cre mice used in our pharmacogenetic experiments. Fluorescent IHC was analyzed by manually counting the total number of cells positive for c-Fos, mCherry, or both positive cells in 1 of 5 series of ARC sections. In addition, we counted c-Fos-positive cells per brain section across the neuraxis of C57Bl/6 mice. Lastly, we manually counted the number of cells doubly labeled for c-Fos and GFP in the brain of 3 MC4R-GFP mice treated with ip LPS 100 μg/kg.
Statistics
All of the quantitative data are expressed as the mean value ± SEM. Numbers of mice per group are indicated in legends. Statistical analysis was performed using GraphPad Prism software, version 6.07. As indicated in the legends, the data were analyzed using Student's unpaired t test, one- or two-way ANOVA, followed by the post hoc test recommended by the software. P < .05 was considered statistically significant.
Results
Mapping of AgRP-innervated brain sites stimulated by LPS
Our initial mapping efforts were aimed at determining to what extent brain sites recruited by LPS were otherwise innervated by AgRP neurons. In particular, double IHC for c-Fos and AgRP was performed in the brains of wild-type C5/Bl6 mice and revealed that LPS induced c-Fos in select AgRP-innervated sites (Figures 1 and 2). Robust c-Fos induction, overlapping with areas containing AgRP immunoreactive fibers, was observed in the paraventricular hypothalamus (PVH) (Figures 1, A and B, and 2, A and B), periventricular hypothalamus (Figure 2, A and B), select subdivisions of the bed nucleus of the stria terminalis (ST) (Figures 1, C and D, and 2, A and B), the anterior and posterior paraventricular thalamus (PVT) (Figures 1H, and 2, A and B), and the external lateral parabrachial (LPBE) (Figures 1G and 2, A and B). In agreement with the literature, c-Fos induction within the PVH encompassed all its major subdivisions including the parvocellular, magnocellular and autonomic subdivisions. In the aforementioned areas, a dense network of AgRP-containing fibers circled around c-Fos-positive cells. To a lesser extent, c-Fos was also induced in AgRP-containing areas of the lateral periaqueductal gray (Figures 1I and 2, A and B) and central amygdala (CeA) (Figures 1F and 2, A and B). LPS induced a smaller c-Fos response in areas lightly innervated by AgRP including, among a few other examples, the parasubthalamic nucleus, dorsomedial hypothalamus, and a region encompassing the locus coeruleus and adjacent sites (Figure 2, A and B). Notably, LPS did not stimulate c-Fos in the perifornical area or lateral hypothalamus (LHA) (Figure 1E). Lastly, c-Fos also accumulated in regions with little or no AgRP innervation including, most notably, the dorsovagal complex (DVC) (Supplemental Figure 1). Our anatomical findings suggested that LPS might suppress appetite by activating brain sites normally downstream and inhibited by AgRP neurons. The distribution pattern of AgRP-positive fibers was entirely consistent with previous studies (21, 24, 29).
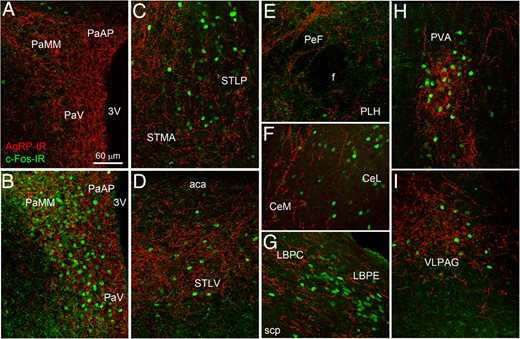
Dual-label immunofluorescence for c-Fos (green) and AgRP (red) in the mouse brain (confocal microscopy). A, In a saline-treated mouse, c-Fos labeling was minimal. All of the other images are from LPS-treated animals. B–I, In response to LPS (2-h time point), c-Fos accumulated in areas highly innervated by AgRP-positive fibers. 3v, third ventricle; aca, anterior part of anterior commissure; CeL, lateral division of the CeA nucleus; CeM, medial division of the CeA nucleus; f, fornix; LBPC, central part of the lateral parabrachial nucleus; LBPE, external part of the lateral parabrachial nucleus; PaAP, anterior parvicellular part of the PVH; PaMM, medial magnocellular part of the PVH; PaV, ventral part of the PVH; PeF, perifornical area; PLH, peduncular part of the LHA; PVA, anterior part of the paraventricular thalamus; scp, superior cerebellar peduncle; STMA, anterior part of the lateral division of the bed nucleus of the ST; STLP, posterior part of the medial division of the bed nucleus of the ST; STLV, ventral part of the lateral division of the bed nucleus of the ST; VLPAG, ventrolateral part of the periaqueductal gray.
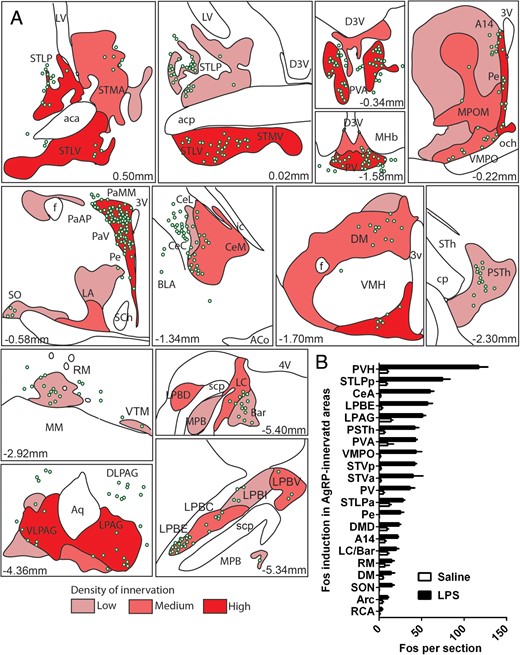
A, Camera lucida drawings of representative brain sections labeled for c-Fos (green circles) and AgRP (red areas). Estimated distance to bregma is indicated next to each drawing (Franklin and Paxinos, 3rd edition). 4v, fourth ventricle; A14, A14 dopamine cells; acp, posterior nerve of the anterior commissure; Aq, aqueduct; Bar, Barrington's nucleus; BLA, anterior part of the basolateral amygdaloid nucleus; D3V, dorsal third ventricle; DM, dorsomedial nucleus of the hypothalamus; cp, cerebral peduncle; DLPAG, dorsolateral periaqueductal gray; ic, internal capsule; LA, lateroanterior hypothalamic nucleus; LC, locus coeruleus; LPAG, lateral periaqueductal gray; LPBD, dorsal part of the lateral parabrachial nucleus; LPBC, central part of the lateral parabrachial nucleus; LPBI, internal part of the lateral parabrachial nucleus; LPBV, ventral part of the lateral parabrachial nucleus; LV, lateral ventricle; MM, medial part of the medial mammillary nucleus; MHb, medial habenular nucleus; MPB, medial parabrachial nucleus; och, optic chiasm; PSth, parasubthalamic nucleus; RM, retromammillary nucleus; SCh, suprachiasmatic hypothalamus; SO, supraoptic nucleus; STh, subthalamic nucleus; VMH, ventromedial hypothalamus; VMPO, ventromedial preoptic nucleus; VTM, ventral tuberomammillary nucleus. Other abbreviations can be found in Figure 5. B, Estimates of the number of C-Fos-positive cells in AgRP-innervated areas in saline- and LPS-treated mice. Data are expressed as the mean numbers ± SEM of C-Fos-positive cells per section (n = 3 mice per group)
In order to further establish that LPS activated neurons downstream of the melanocortin system, we performed double IHC for c-Fos and GFP in the brain of MC4R-GFP mice treated with either saline or LPS. In saline-treated animals, basal levels of c-Fos immunoreactivity were low across the brain and, consequently, double-labeled cells were never observed (data not shown). LPS induced c-Fos in the exact same regions described in Figure 2. Double-labeled for c-Fos and GFP were absent from most areas targeted by AgRP neurons, including the anterior part of the paraventricular thalamus (Figure 3A), STL (Figure 3B), or LHA (Figure 3C). Double-labeled cells were occasionally seen in other brain sites involved in feeding, including, most notably, the posterior PVH (Figure 3D) and the dorsomedial hypothalamus (Figure 3E). However, the external part of the external part of the lateral parabrachial nucleus was the only brain site that consistently displayed significant numbers of double-labeled cells (Figure 3, F–I). In this region, an average of 24 ± 1 double-labeled cells per section (n = 3) was observed. The latter observation is consistent with a previous report in the rat (57).
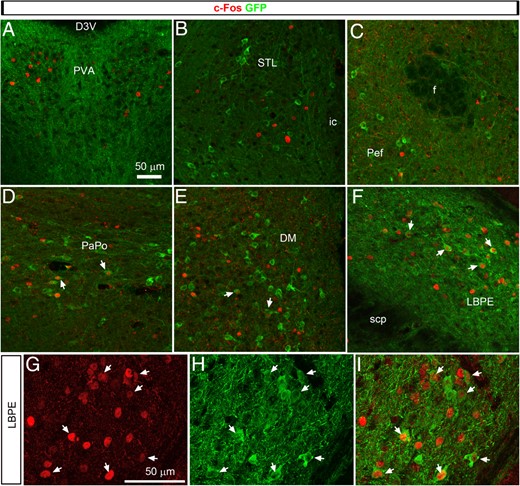
Distribution of c-Fos (Alexa Fluor 594) and GFP immunoreactivity (Alexa Fluor 488) in representative brain sites of MC4R-GFP mice treated with LPS (confocal microscopy). Images from A to F are z-stacks of about 20 optical sections taken with a ×40 objective. Images from G to I were taken with a ×63 objective and are representative of the LPBE. White arrows indicate cells with evident colocalization between c-Fos and GFP. PaPo, posterior part of the paraventricular nucleus of the hypothalamus; PeF, perifornical area. Other abbreviations can be found in Figures 1 and 2.
Finally, in order to determine whether LPS-induced neuronal activation was caused by the recruitment of POMC neurons, we further examined c-fos expression in identified ARC neurons using double IHC and ISH. In wild-type mice, we observed a very limited induction of c-Fos in the ARC in response to LPS (Figure 4A). Nonetheless, a few isolated cells were found in the dorsolateral ARC, near the edge of the ventromedial hypothalamus. Double ISH for c-fos and Pomc mRNAs further confirmed the induction of c-fos in the dorsolateral ARC but never in POMC neurons (Figure 4B). The identity of the stimulated cells remains to be determined. Quantitative analysis showed no significant changes in c-fos expression in the POMC neurons of LPS-treated mice (Figure 4C). In the same animals, double ISH for Agrp and c-fos mRNAs did not reveal obvious differences between groups (Figure 4, D and E). C-fos mRNA was generally very low in Agrp neurons, and quantification of the Agrp mRNA signal per cell profile showed no changes between saline- and LPS-treated mice (Figure 4F).
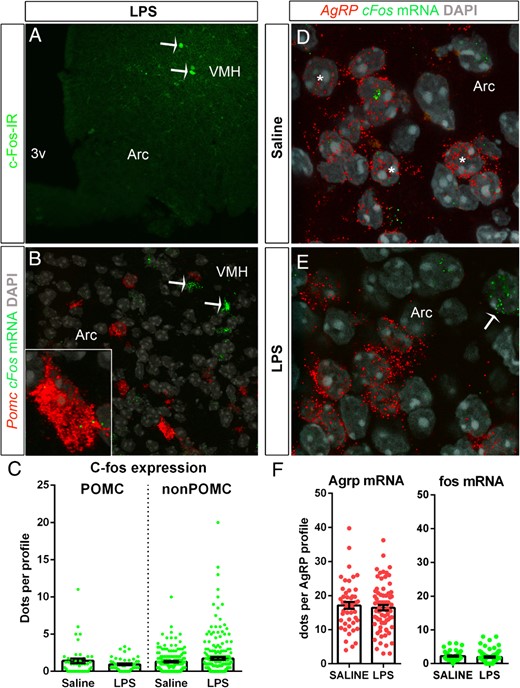
A, Immunofluorescence for c-Fos (green) in the ARC of a representative LPS-treated C57/Bl6 mouse. White arrows indicate c-Fos-positive cells at the edge with the ventromedial hypothalamus (VMH). B, Double fluorescent ISH for POMC (red) and c-fos (green) mRNAs in the ARC of a representative LPS-treated C57/Bl6 mouse. White arrows indicate c-fos-expressing cells. Minimal c-fos expression was observed in POMC neurons. C, Graphs showing the ISH signal strengths for c-fos in POMC and non-POMC cells after saline or LPS treatments. In single optical sections, the number of positive dots per identified profile was counted. Each dot represents 1 profile. Data are expressed as the mean numbers of dots per profile ± SEM. Groups consisted of n = 4 mice. Data were analyzed using Student's t test. D and E, Double fluorescent ISH for AgRP (red) and c-fos (green) mRNAs in the ARC of representative saline- and LPS-treated C57/Bl6 mice. White asterisks and arrows indicate AgRP- and c-fos-expressing cells, respectively. A visual inspection of the tissue did not reveal obvious changes in the number of positive cells or intensity of signals for either AgRP or c-fos. F, Graphs showing the average ISH signal strengths for AgRP and c-fos in AgRP cells after saline or LPS treatments. In single optical sections, the number of positive dots per identified AgRP profile was counted. Each dot represents 1 profile. Data are expressed as the mean numbers of dots per profile ± SEM. Groups consisted of n = 4 mice. Data were analyzed using Student's unpaired t test
LPS rapidly and completely suppressed AgRP neuron-mediated food intake
Based on the above mapping, we hypothesized that the experimental activation of AgRP neurons may significantly attenuate the anorexia caused by LPS. Pharmacogenetics was used to stimulate AgRP neurons as previously described (26). Mice with a successful AAV injection centered in the ARC showed mCherry expression at the site injection (Figure 5, A and B). Because the success of our injections varied between animals, a posteriori, we scored mice considered to be misses (no or <10 mCherry cells in the entire ARC) vs mice considered to be hits (≥10 mCherry cells) (Figure 5B). Mice eating less than 0.1 g of food in 2 hours were always missed cases. The rostrocaudal distribution of mCherry in each case in hits is summarized in Figure 5.
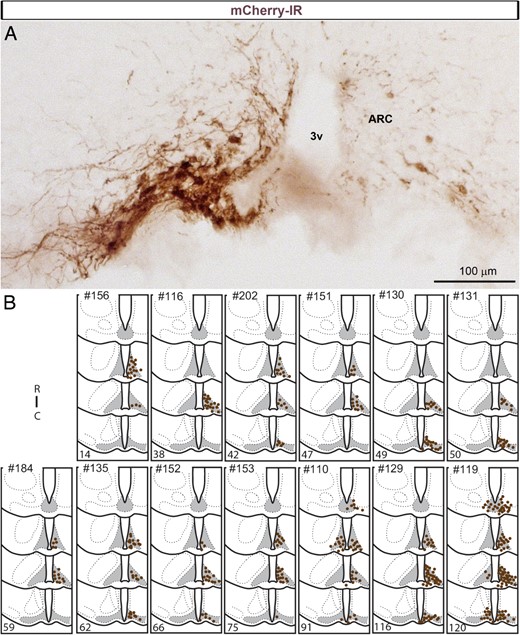
A, Expression of mCherry (brightfield illumination) detected with IHC in 1 successful injection of AAV8-hM3D-Gq-mCherry. Immunoreactivity is observed in the somas and proximate dendrites of neurons at the site of injection but not in the surrounding structures. A few DAB-labeled neurons were also seen on the contralateral side of the injection, presumably due to the diffusion of viral particles via the median eminence. B, Camera lucida drawings of 4 rostral-to-caudal levels of the mouse hypothalamus illustrate the distribution of cells positive for mCherry in the ARC of 13 successful cases (AgRP-Cre mice). Each dot represents 2 positive cells. Numbers in the bottom left corner of each case correspond to the number of positive cells counted in a 1:5 series of brains sections. Note that the number of mCherry-positive neurons and their rostrocaudal distribution vary between animals. 3v, third ventricle; C, caudal; IR, immunoreactivity; R, rostral
As anticipated, hit mice receiving saline did not eat a significant amount of food over the light phase (Figure 6A). The administration of CNO induced a robust feeding behavior during the 4 hours after injection (post hoc P < .001 at 1, 2, and 4 h) (Figure 6A). Interestingly, over a period of 24 hours, CNO- and saline-treated animals ate a similar amount of food, suggesting a compensatory reduction in food intake after the effects of CNO had washed out. The food intake of mice receiving CNO in combination with LPS was not different from that of saline-treated mice during the 4 hours after injection (Figure 6A), indicating that the effects of CNO were largely blunted. Food intake over 24 hours remained significantly lower in LPS-treated mice than in mice given either saline of CNO (post hoc P < .05 at 24 h) (Figure 6A). CNO- and saline-treated missed mice ate the same amount of food over the entire period of time, demonstrating that CNO did not have any effect of its own (Figure 6B). Notably, hit mice did not significantly eat more food than missed mice at any time point (Figure 6C), indicating that LPS completely abrogated CNO's stimulatory actions on food intake.
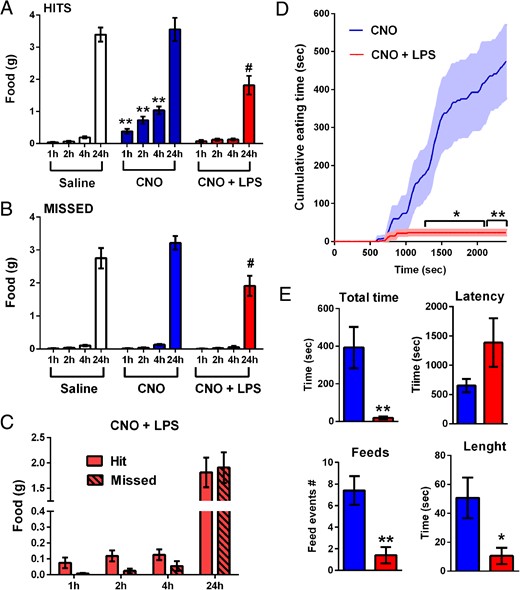
A and B, Graphs illustrating the cumulative food intake in response to saline (white), CNO (blue; 1 mg/kg, ip), or CNO combined with LPS (red; 100 μg/kg, ip) of AgRP-Cre mice at different time points postinjection (x-axis). Data included were analyzed using a one-way ANOVA (treatment factor) separately run at each individual time point, comparing the mean of each column to the mean of every other column, followed by Tukey's post hoc test; **, P < .01 compared with saline-treated mice at same time point; #, P < .05 compared with saline and CNO group at the same time point. C, Graph illustrating the compared food intake of hit and missed groups after the coadministration of CNO and LPS (red). Data were analyzed using two-way ANOVA (group and time factors), comparing each cell mean with the other cell mean in that row, followed by Sidak's post hoc test. Data were not significantly different. Data in A–C are expressed as the mean of cumulative food intake (g) ± SEM. Groups consisted of n = 9–13 mice. D, Graph illustrating the cumulated time spent eating of AgRP-Cre mice (n = 5) in response to CNO (blue) or CNO combined with LPS (red). Shaded areas correspond to the SEM. Data were analyzed using Student's unpaired t test of the mean of each row; *, P < .05 compared with CNO; **, P < .01 compared with CNO. E, Graphs illustrating feeding parameters in the mice described in D. Data were analyzed using Student's unpaired t test; *, P < .05 compared with CNO; **, P < .01 compared with CNO.
In a separate cohort of AgRP-Cre mice, we further examined the early anorectic response to LPS (<40 min). In mice treated with CNO alone, the average latency to the first eating episode was approximately 10 minutes after injection (Figure 6, D and E). From that time point, feeding continued without interruptions to reach a cumulative time of approximately 7 minutes (Figure 6, D and E). When CNO was coadministered with LPS in the same mice, food intake was dramatically reduced (Figure 6, D and E). The difference in cumulative eating time between the groups reached statistical significance 20 minutes after injection (Student's unpaired t test P < .05 from CNO) (Figure 6D). However, 2 LPS-treated mice did not eat any food at all, suggesting that anorexia occurred very early in these animals, before the onset of CNO-induced eating. The total time spent eating and the length and number of feeding bouts were all significantly reduced (Student's unpaired t test P = .0095, P = .0297, and P = .0043, respectively) (Figure 6, D and E).
We next examined c-Fos immunoreactivity in a subset of CNO-treated mice receiving or not receiving LPS. CNO induced c-Fos selectively in the vast majority of mCherry cells of the ARC (Figure 7A). Interestingly, the same proportion of mCherry cells was c-Fos-positive in mice administered CNO and LPS (Figure 7B).
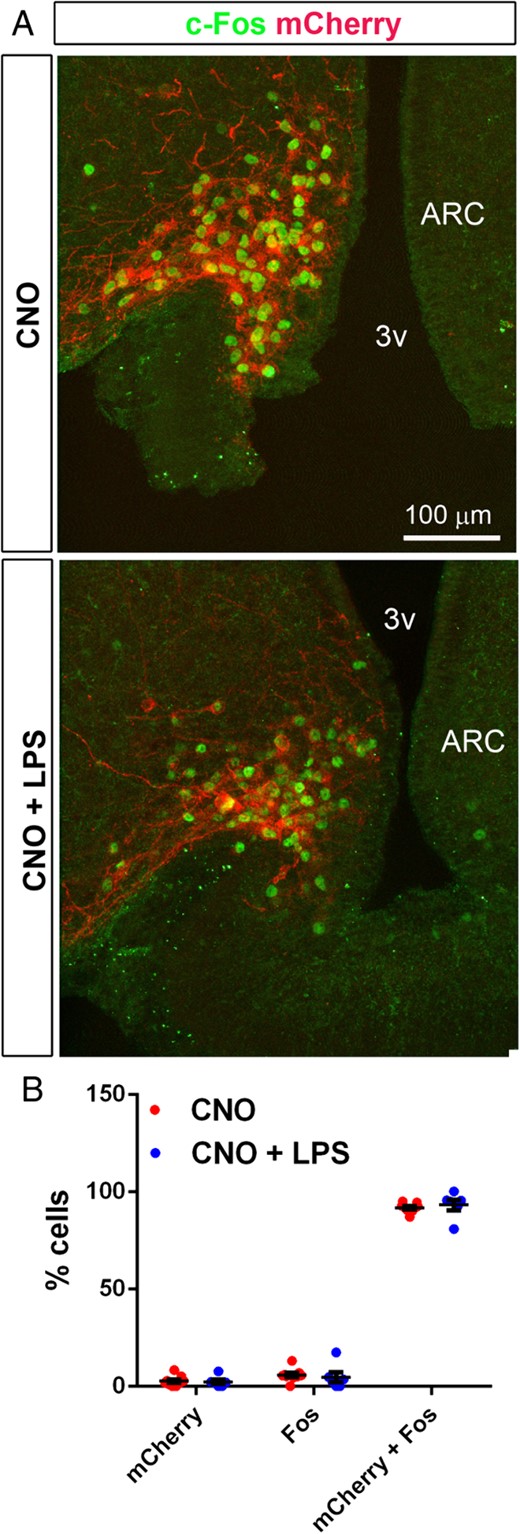
A, CNO administration induced robust C-Fos immunoreactivity (green) in mCherry cells (red endogenous fluorescence) distributed in the ARC of AgRP-Cre mice. Images were obtained with confocal microscopy. Note that c-Fos immunoreactivity was contained in mCherry cells. B, Histogram showing the percentage of total cells expressing mCherry and/or C-Fos after the administration of CNO (red dots, n = 9) or CNO combined with LPS (blue dots, n = 6). Data are expressed as the mean percentage of cells ± SEM
Discussion
Role of the ARC in inflammatory anorexia
Because of their critical roles in regulating appetite, ARC neurons have been the focus of several studies of inflammatory anorexia (58). However, the role of ARC neurons in inflammatory-associated anorexia has not been fully elucidated. If the inhibition of AgRP was a major contributor to LPS-induced anorexia, then one would expect the experimental activation of AgRP neurons to prevent LPS-induced anorexia. Our data indicated otherwise, thus making us confident that the inhibition of AgRP neurons might not play a predominant role in inflammatory anorexia. One study reported that the central administration of AgRP diminished the anorectic effects of LPS (35). However, the study only included 1 24-hour time point. A similar observation was reported in the sheep at 12 hours after LPS (36). Another interesting pharmacological study (53) similarly showed that the acute intracerebroventricular administration of a MC4R antagonist reduced the severity of LPS-induced anorexia but only at the 24-hour time point, which is far beyond the peak of anorexia. The same antagonist was without effect between 0 and 8 hours after LPS. One way of interpreting these data is that elevated AgRP signaling helped the animals to recover faster from LPS-induced anorexia, likely due to indirect and delayed actions on immunity and/or autonomic functions. However, the early anorectic response to LPS remained largely unaffected by elevated AgRP and/or down-regulated MC4R signaling. This finding further indicated that the reported attenuation of LPS-induced anorexia by fasting and leptin blockade was probably caused by altered immune and/or autonomic functions rather than by elevated AgRP signaling (18, 59, 60).
We also showed that the stimulation of AgRP neurons by CNO was unaltered by the administration of LPS. Nonetheless, it cannot be excluded that subtle changes in the electrophysiological activity of AgRP neurons may have been missed by us. For example, one recent study examined the electrophysiological response to LPS on AgRP neurons in hypothalamic slices (32). Based on their data, the authors concluded that LPS reduced the firing of AgRP cells via a microglial response. Puzzlingly, the reported electrophysiological response of AgRP cells was very rapid and independent of changes in membrane polarization. It also must be noted that Reis et al (32) directly applied LPS to hypothalamic slices and this at a very high dose (10 μg of LPS/mL for 2 min).
We considered the stimulation of POMC neurons to be a contributing factor to the anorexia caused by LPS. However, our neuroanatomical data show that the early responses to LPS were not accompanied by detectable changes in c-fos transcription in POMC neurons, in agreement with 2 previous studies in the rat (18, 61). Previous studies have also documented that LPS-induced changes in immediate early genes, neuropeptides, and inflammatory genes are typically more profound in the PVH than in the ARC (13, 18, 38, 62–66). Although IL-1β was demonstrated to induce c-fos in a small subset of POMC neurons (19) and to induce their depolarization (34), it was clearly shown that the disconnection/ablation of the ARC did not prevent IL-1β-induced anorexia (19). Jang et al (35) further reported that the deletion of nuclear factor κB (NF-κB) signaling in POMC neurons prevented LPS-induced anorexia. However, it must be emphasized that the results of the latter study have been directly contradicted by a large body of literature demonstrating that NF-κB signaling is largely unresponsive in neurons (67–70). Additionally, the administration of peripheral LPS exclusively stimulated NF-κB signaling in nonneuronal brain cells (71, 72). In summary, our data combined with the literature strongly suggested that ARC neurons were not directly involved in initiating LPS-induced anorexia under our experimental conditions. Instead, our findings suggest that endotoxin-mediated anorexia may be rapidly initiated by the recruitment of central viscerosensory pathways as discussed below. Further studies are warranted to examine the roles of ARC neurons in other inflammatory paradigms. Moreover, because LPS-induced anorexia is dose-dependent, further experiments are also warranted to determine the minimal amount of LPS needed to suppress AgRP neuron-mediated food intake.
Antibody Table
| Peptide/Protein Target | Antigen Sequence (if Known) | Name of Antibody | Manufacturer, Catalog Number, and/or Name of Individual Providing the Antibody | Species Raised in; Monoclonal or Polyclonal | Dilution Used |
|---|---|---|---|---|---|
| C-Fos | Synthetic peptide corresponding to the N-terminal region of the human c-Fos proto-oncogene (p55), amino acids 3–16 | Anti-c-Fos antibody | Sigma, F7799 | Rabbit | 1:2000 |
| AgRP | Val25-Thr131 | Mouse AgRP/ART antibody | R&D Systems, AF634 | Goat | 1:1000 |
| DsRed | DsRed-Express, a variant of Discosoma sp. Red | DsRed polyclonal antibody | Clontech, 632496 | Rabbit | 1:1000 |
| GFP | Recombinant GFP | Chicken anti-GFP | Aves Labs, GFP-1020 | Chicken | 1:1000 |
Central viscerosensory pathways involved in inflammatory anorexia
Our understanding of the distributed neuronal networks regulating appetite has considerably evolved in recent years. In particular, Betley et al (24) described a core feeding network downstream of AgRP neurons necessary for their orexigenic effects. This network consisted of 4 interconnected brain sites; the PVH, ST, LHA, and PVT. Because AgRP neurons are γ-aminobutyric acid (GABA)ergic, they normally inhibit the neuronal activity of their postsynaptic targets located in the aforementioned sites. Put simply, low levels of neuronal activity in this network would be correlated with increased appetite and food intake. Conversely, food intake is expected to diminish as neuronal activity rises within this core feeding network, in response to varied psychogenic, humoral or viscerosensory stimuli. In this study, we found that LPS induced robust c-Fos expression in 3 of the above AgRP neurons-innervated brain sites, including the PVH, ST, and PVT. Hypothetically, the activation of these sites by LPS might be sufficient to prevent AgRP neuron-induced eating. Previous neuroanatomical studies have also implicated these sites in inflammatory anorexia (73–76). It has also been suggested that melanocortin signaling in GABAergic interneurons contacting orexin neurons in the LHA might contribute to the regulation of appetite (40, 77). Interestingly, we and others have previously demonstrated that LPS could reduce the activity of LHA neurons, including orexin neurons, in fasted animals (18, 78). Therefore, it is likely that the inhibition of orexin neurons by LPS participates in suppressing AgRP neuron-mediated feeding.
The model described above is certainly oversimplified and does not exclude the contribution of brainstem viscerosensory relays in suppressing AgRP neuron-mediated eating. In particular, one previous study showed that neuronal activity in the LPBE was required for LPS-induced anorexia (42). Briefly, the LPBE was a major relay for viscerosensory signals originating from the DVC (57, 79). Moreover, the inhibition of neurons in the DVC reduced c-Fos induction in key central autonomic nuclei after LPS (17). Further pharmaco- and opto-genetic studies are therefore warranted to determine the requirement of each of the aforementioned brain sites in the initiation of inflammatory anorexia triggered by bacterial endotoxins.
One limitation of our interpretation related to it not being entirely clear that c-Fos-expressing neurons in response to LPS are postsynaptic targets of AgRP neurons. Our data showed that LPS stimulated the accumulation of c-Fos in the PVH and LPBE, 2 brain sites are critical to the regulation of feeding including LPS-induced anorexia (42, 80–82). Most notably, LPS activated many MC4R-expressing neurons in the LPBE. Thus, the recruitment of MC4R-expressing neurons in the LPBE in response to LPS is likely to play an important role in inflammatory anorexia and the suppression of AgRP mediated food intake. Nonetheless, across the rest of the brain, the numbers of MC4R-expressing neurons activated by LPS were small. This suggests that forebrain MC4R-expressing neurons may be marginally involved in LPS anorectic effects. In agreement with this view, recent studies suggested that the orexigenic actions of AgRP neurons occur independently of MC4R signaling (83). In fact, it is known that AgRP neurons concomitantly release GABA and neuropeptide Y, in addition to AgRP. Future mapping studies are therefore warranted to determine the extent to which LPS stimulates neurons expressing the different receptors for GABA and neuropeptide Y.
Acknowledgments
We thank Abhijit Bugde from the University of Texas Southwestern Medical Center Live Cell Imaging Core Facility for his help with confocal microscopy. We also thank Solène and Syann for their support.
This work was supported by an American Neurogastroenterology and Motility Society Research Grant (2013–2014). This work was also supported by the National Center for Advancing Translational Sciences of the National Institutes of Health Award UL1TR001105 (to L.G.) and the American Heart Association Scientist Developmental Grant 14SDG20140054 (to H.C.).
Disclosure Summary: The authors have nothing to disclose.
Abbreviations
- AAV
adeno-associated virus
- AgRP
Agouti-related peptide
- ARC
arcuate nucleus of the hypothalamus
- CeA
central amygdala
- CNO
clozapine-N-oxide
- DAB
diaminobenzidine
- DAPI
4′,6-diamino-2-phenylindole, dihydrochloride
- DsRed
Discosoma sp. red fluroescent protein
- DVC
dorsovagal complex
- GABA
γ-aminobutyric acid
- GFP
green fluorescent protein
- IHC
immunohistochemistry
- ISH
in situ hybridization
- LHA
lateral hypothalamus
- LPBE
external lateral parabrachial
- LPS
lipopolysaccharide
- MC4R
melanocortin-4 receptor
- NF-κB
nuclear factor κB
- POMC
proopiomelanocortin
- PVH
paraventricular hypothalamus
- PVT
paraventricular thalamus
- ST
stria terminalis.
