


Summary
To investigate the extent to which post-orthodontic white spot lesions (WSLs) change in appearance over a period of ≥15 years and whether an association with caries data exists.
Seventy-two patients treated with a Herbst-Multibracket appliance at age 14.0 ± 2.7 years for 20.1 ± 5.1 months who attended a recall 18.3 ± 2.9 years post-treatment. Post-treatment (T1) intraoral photographs were assessed by a panel of five dentists using a modified version of the WSL-Index by Gorelick. For affected incisors, photographs from before treatment (T0) and recall (T3) were evaluated. In addition, the WSL-Change Index by Pancherz and Muehlich was assessed for all adequately visible incisors considering T1, T2 (if available), and T3. Radiographic (T0, T1, and T2—if available) and clinical (T3) MFT data were used.
37.5% of the patients exhibited WSLs on ≥ 1 incisor at T1; in total, 81 incisors (14.9%) were affected. At T3, 48% of the WSLs had improved. The modified WSL-Index decreased from 1.2 ± 0.4 to 0.8 ± 0.6 (P < .001), with a score 0 in 28% of the previously affected incisors. When comparing T2 vs. T3, additional improvement after T2 occurred in 11% of the teeth. While no difference existed at T0, the MFT values at T1, T2, and T3 were higher (P ≤ .05) in patients with WSLs at T1 than in those without.
The homogeneity of the subjects was limited and no patient-reported outcome was assessed.
Long-term, post-orthodontic WSLs showed spontaneous full recovery in 28% and improvement in 48% of the teeth. Patients affected with WSLs exhibited higher post-treatment MFT values.
Introduction
White spot lesions (WSLs) on labial tooth surfaces are a frequent unwanted side effect of orthodontic treatment (Tx) involving multibracket appliance (MBAs). General post-Tx prevalence values of up to 97.5% can be found in the literature [1]; these data, however, vary a lot depending on the respective reference (patient vs. tooth vs. tooth surface), the evaluated teeth (full vs. partial recording) and the method of assessment (clinical vs. photo evaluation) [2–7].
Considering this range of prevalence data, it seems more appropriate to assess the incidence of WSLs during orthodontic Tx, but the respective values also exhibit a tremendous variation ranging between 13% and 74% (percentage of patients who developed WSLs), respectively 7% and 36% (percentage of evaluated teeth which developed WSLs) [5, 8–11]. Despite these unclear data, the upper lateral incisors seem to be the most frequently affected teeth [3, 6, 8, 9, 12–16].
While WSLs are considered as a risk factor for the development of caries lesions which require invasive therapy [17], an investigation in the 1980s found the incidence of filled tooth surfaces not to differ between orthodontically treated and untreated patients at age 10 and 18 years (before or about 5 years after the end of orthodontic Tx, respectively) [18]. Nevertheless, when assessing the prevalence for WSL 5.7 years after orthodontic Tx, more incisors (12.8% vs. 0.9%) were affected in the treated group compared to the untreated controls [19].
Several risk factors for WSL development during MBA Tx have been described: insufficient oral hygiene before [9, 20] and during MBA Tx [9, 15, 21, 22, 17], long Tx duration [15, 22, 17], young age [9, 20], male sex [3, 15, 17], pre-existing WSLs at the start of MBA Tx [17], frequently missed appointments [9], teeth without fluorosis [17], increased frequency of sugar consumption [18], obesity [19], lack of regular use of fluoride varnish [15], or ≥ 1 decayed, filled or missing first permanent molar [20].
Post-orthodontic WSLs might be perceived as distinct aesthetic impairment by patients and parents [23, 24]. Multiple Tx options attempting to alleviate the aesthetic impact have been described over the years. For example, resin infiltration [25–29], micro abrasion [30, 31], bleaching of the surrounding enamel [32, 33], application of fluoride [34–39], casein phosphopeptide amorphous calcium phosphate [37, 40–45], or bioactive glass [46]. None of these approaches, however, has yet proven to result in durable, fully satisfying outcomes [32, 34, 35, 39, 47–51].
On the other hand, it is known that WSLs vanish to some extent over time [52–55]. A randomized controlled trial detected a certain amount of regression in 75% of the lesions 6 years after debonding [56]. Little, however, is known regarding the long-term development of these lesions. One prospective trial assessed WSLs quantitatively on photographs of upper lateral incisors and lower canines and found an increase in size during orthodontic Tx followed by a marked reduction in size during the post-Tx period of 12 years [24]. The actual impact in terms of clinical visibility, however, was not considered.
Therefore, the main objective of the present study was to investigate the extent to which orthodontically induced WSLs—not subjected to any particular intervention—change in appearance over an observation period of ≥15 years. In addition, it was to be investigated whether these changes are associated with the patients’ caries experience.
The null hypothesis was defined as: Orthodontically induced WSLs do not change in appearance over an observation period of ≥15 years.
Subjects and methods
The study was an amendment to a long-term recall of (former) orthodontic Class II patients who had undergone Herbst-MBA Tx at the Department of Orthodontics, University of Giessen, Germany and whose active Tx period had ended at least 15 years ago (ethical approval: Nr. 146/13, Medical Faculty, University of Giessen, Germany; trial registration: DRKS00006354); 72 out of 116 former patients participated. Part of this long-term recall (T3) was taking a full set of standardized intraoral photographs which were supposed to be evaluated along with corresponding material from before Tx (T0), immediately after MBA debonding (T1) and from a recall investigation approximately 2 years later (T2—available for only 62 of the 72 participants). The camera that had been used at T3 was a Nikon D300, while for T0, T1, and T2 the exact types are not known, but they were Nikon reflex cameras. For natural reasons, the initial photographs were analogue slides.
Photograph assessment (frontal and—if the labial tooth surfaces were not fully rateable—lateral view) was performed by a panel of five female dentists (one cariologist: C.G.; three orthodontists: K.K., S.R., J.V.B.; one pedodontist: N.S.W.) with ≥9.5 years of professional experience each; standardized conditions prevailed: dark room without natural light, distance of 200 cm to the screen (celexon, Emsdetten, Germany) where enlarged versions of two photographs (67 × 101 cm) were displayed abreast. The photographic series of each patient were assessed in chronological order and each panel member assessed all photographs individually.
On each photograph from T1, all adequately visible incisors were evaluated regarding the presence and severity of WSLs using a modified version of the WSL-Index [14] (Fig. 1). For all patients who were determined to be affected at T1, all further photographs from T0 and T3 were also evaluated (affected teeth that were not adequately visible at T0 or T3, were excluded). In addition, a modified version of the WSL-Change-Index [57] was applied to determine if subjective changes not being determined by the WSL-Index had occurred between T1 and T3 as well as T1 and T2 (in case of photographs being available). Thus, when comparing the photographs, a rating of ‘improvement’, ‘no change’, or ‘deterioration’ was given. If the labial surface of a tooth was not fully visible (i.e. due to a deep bite or massive gingival hyperplasia) the tooth was considered ‘unrateable’.
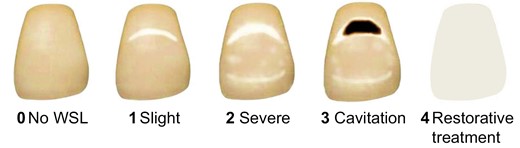
Modified version of the WSL-Index originally described by Gorelick et al. 1982.
Before the actual evaluation of the photographs, two calibration meetings of the panel members within 2 weeks were organized where pre- and post-Tx photographs of six patients from a different sample were assessed in terms of WSL occurrence, WSL-Index as well as WSL-Change-Index. Afterwards, the respective findings were discussed until mutual agreement was achieved and all panel members felt confident to evaluate the photographs of the recall participants individually. Figure 2 illustrates the study flow.
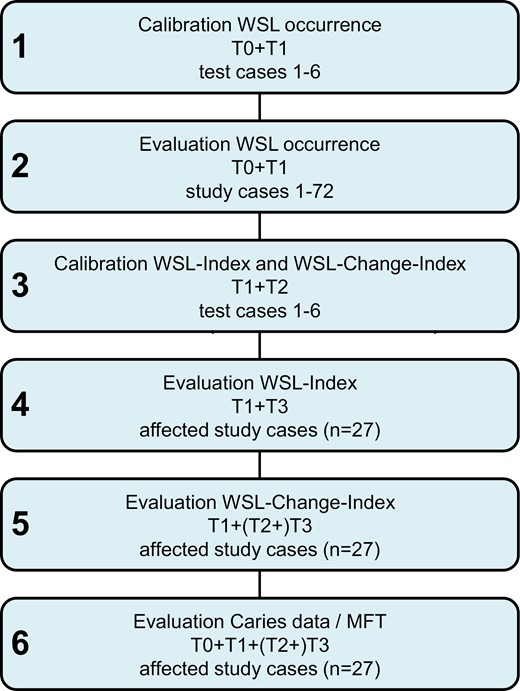
Flow chart exhibiting the progress of the study; T0: before Tx, T1: immediately after MBA debonding, T2: 2 years after Tx (if available), T3: long-term recall.
In terms of caries data [58]—which were collected using panoramic radiographs (OPGs) taken with an Orthopantomograph 5 (Siemens, Bensheim, Germany) before Tx (T0), immediately after Tx (T1) and 2 years after Tx (T2 - if available)—the number of filled teeth (FT) and missing teeth (MT) due to caries was recorded as well as the respective sum (MFT).
Prior to the evaluation of the OPGs, the diagnostic criteria were agreed upon and written down. Subsequently, the radiographs were assessed under standardized conditions (light table in a dark room). Two examiners (one cariologist: C.G.; pedodontist: N.S.W.; ≥20 years of professional experience each) performed the assessment independently; both were blinded to each other’s assessments and to WSL diagnoses. All OPGs of each patient were assessed in chronological order. After the evaluations were completed, radiographs were re-evaluated by the two examiners if there were inconsistencies in the assessments; these were discussed until agreement was reached. If thereafter any unclear issues remained (e.g. whether teeth had been removed for orthodontic reasons or due to caries), this was clarified with a third examiner (N.C.B.) and the aid of the patient’s medical record. For T3, only data from the clinical examination were available.
Statistics
All statistical analyses and calculations were performed using either Stata 16.1 (©StataCorp LLC, College Station, TX, USA) or IBM® SPSS® 28 (IBM Corporation, Armonk, NY, USA) software.
A descriptive statistical analysis was performed determining mean value, standard deviation, 95% confidence interval (CI), and median value.
As most data did not exhibit a normal distribution (Kolmogorov–Smirnov–Test), non-parametric tests (Sign test, Mann–Whitney test) were used for inter-group and inter-occasion comparisons. P-values ≤.05 were considered statistically significant.
For the modified WSL-Index, both the patient and the tooth level were considered, defining the following sub-variables:
WSL-Index maximum score—the maximum value determined in each included patient was used for further processing.
WSL-Index sum score—the sum score determined in each included patient was used for further processing.
WSL-Index sum score/number of affected incisors in patients—the sum score determined in each included patient divided by the number of affected incisors was used for further processing.
WSL-Index median score: median value determined from all included teeth was used for further processing.
Possible associations between the WSL-Index and caries data (MFT) as well as sex, respectively, were determined using bivariate analyses (Cramèrs V for the effect size in case of two binary variables respectively Spearman’s correlation in case of two continuous variables or a combination one continuous and one binary variable); values >0.5 were considered as moderate correlations.
As the WSL-Index and WSL-Change-Index were assessed by five examiners, the respective median values were used for further calculations. For the caries data, only one value per assessment was generated (mutual agreement). For the WSL-Index and WSL-Change-Index, the Krippendorff’s alpha reliability estimate was chosen to assess observer reliability. For the WSL-Index, the respective values (exact agreement of all five assessors) ranged between 0.53 and 0.66 and for the WSL-Change-Index, values of 0.40 and 0.43 were determined.
Results
Seventy-two patients (55.6% female, 44.4% male) participated in the recall investigation. Those patients had started active Tx at age 14.0 ± 2.7 years; the average duration was 20.1 ± 5.1 months and the recall was attended 18.3 ± 2.9 years post-Tx.
Prevalence/Incidence
At T0, 11 out of 71 patients (15.5%) already exhibited ≥1 incisor(s) with a WSL (Tables 1 and 2). In total, 19 out of 395 rateable incisors (4.8%) were affected with a mean WSL-Index score of 1.7 ± 1.19.
Numbers of patients and rateable affected incisors as well as WSL prevalence (T0, T1) and incidence (T1-T0).
| T0 | T1 | T3 | ||
|---|---|---|---|---|
| Patients | with rateable incisors | n =71 | n = 72 | n = 72 |
| ♀ = 54.9/♂ = 45.1% | ♀ = 55.6/♂ = 44.4% | ♀ = 55.6/♂ = 44.4% | ||
| with ≥1 incisor(s) exhibiting a WSL | n = 11 | n = 27 | n = 19 | |
| ♀ = 54.5/♂ = 45.5% | ♀ = 48.1/♂ = 51.9% | ♀ = 47.4/♂ = 52.6% | ||
| Prevalence | 15.5% | 37.5% | - | |
| with ≥1 incisor(s) exhibiting a new or deteriorated WSL | - | n = 22 | n = 18 | |
| ♀ = 50.0/♂ = 50.0% | ♀ = 42.1/♂ = 57.9% | |||
| Incidence | - | 30.6% | - | |
| Incisors | being rateable | n = 395 | n = 541 | n = 71 |
| out of n = 81 exhibiting a WSL at T1 | ||||
| exhibiting a WSL | n = 19 | n = 81 | n = 48 | |
| out of n = 71 exhibiting a WSL at T1 and being rateable | ||||
| Prevalence | 4.8% | 15.0% | - | |
| exhibiting a new or deteriorated WSL | - | n = 64 | n = 37 | |
| out of n = 59 exhibiting a new or deteriorated WSL at T1 and being rateable | ||||
| Incidence | - | 16.2% | - | |
In addition, the respective data for T3 are given for all patients and incisors, respectively, which were rateable and affected at T1.
Affected incisors: distribution (number and percentage) among the different incisor types at T0, T1 and T3 (prevalence for T0 and T1, incidence for T1).
| T0 | T1 | T3 | |||||
|---|---|---|---|---|---|---|---|
| n | % (prevalence) | n | % (prevalence) | n | % | ||
| Incisors exhibiting a WSL | Total | 19 | 100.0 | 81 | 100.0 | 48 | 100.0 |
| Tooth 12 | 5 | 26.3 | 17 | 21.0 | 10 | 20.8 | |
| Tooth 11 | 2 | 10.5 | 5 | 6.2 | 2 | 4.2 | |
| Tooth 21 | 2 | 10.5 | 7 | 8.6 | 4 | 8.3 | |
| Tooth 22 | 8 | 42.1 | 22 | 27.2 | 13 | 27.1 | |
| Tooth 32 | 0 | 0.0 | 7 | 8.6 | 4 | 8.3 | |
| Tooth 31 | 0 | 0.0 | 6 | 7.4 | 4 | 8.3 | |
| Tooth 41 | 1 | 5.3 | 8 | 9.9 | 5 | 10.4 | |
| Tooth 42 | 1 | 5.3 | 9 | 11.1 | 6 | 12.6 | |
| n | % (incidence) | n | % (incidence) | n | % | ||
| Incisors exhibiting a new or deteriorated WSL | Total | - | 64 | 100.0 | 37 | 100.0 | |
| Tooth 12 | 14 | 21.9 | 8 | 21.6 | |||
| Tooth 11 | 3 | 4.7 | 1 | 2.7 | |||
| Tooth 21 | 5 | 7.7 | 3 | 8.1 | |||
| Tooth 22 | 17 | 26.6 | 10 | 27.0 | |||
| Tooth 32 | 6 | 9.4 | 3 | 8.1 | |||
| Tooth 31 | 6 | 9.4 | 4 | 10.8 | |||
| Tooth 41 | 6 | 9.4 | 3 | 8.1 | |||
| Tooth 42 | 7 | 10.9 | 5 | 13.6 | |||
At T1, 27 out of 72 patients (37.5%) exhibited ≥1 affected incisor(s). In 22 of those 27 affected patients, ≥1 WSL(s) had newly developed or deteriorated during Tx. In total, 81 out of 541 rateable incisors (15.0%) were affected. In 64 of those 81 affected incisors, the WSL had newly developed or deteriorated during Tx; in 13 incisors, the WSL was stable and 4 incisors were unrateable at T0. Therefore, the concordant incidence values (T1-T0) were 30.6% on the patient and 16.2% on the tooth level. A detailed overview is given in Table 1.
At T3, 19 out of the 27 patients (70.4%) exhibiting ≥1 affected incisor at T1 were still affected. Looking only at the 22 patients with newly developed or deteriorated WSL(s) during Tx, the ratio is 18 out of 22 (81.8%). In total, out of 71 incisors which were affected at T1 and were rateable at T3, 48 (67.6%) were still affected. Looking only at the incisors with a newly developed or deteriorated WSL during Tx, the ratio is 37 out of 59 (62.7%).
At all occasions, the most frequently affected teeth were the upper lateral incisors (20.8-42.1%); for all other incisor types the frequency ranged between 0 and 13.6% (Table 2).
Severity
The number of incisors exhibiting a WSL in affected patients decreased significantly (p≤0.001) from 3.0 ± 2.24 at T1 to 1.9 ± 2.01 at T3 (Table 3). Although to a lesser extent, this was also true for patients with newly developed or deteriorated WSLs (from 2.4 ± 2.36 to 1.8 ± 1.97) (Tables 3 and 4). The WSL-Index maximum score, however, stayed more or less unchanged (T1: 1.4 ± 0.50 vs. T3: 1.2 ± 1.12, respectively T1: 1.2 ± 0.74 vs. T3: 1.2 ± 1.25 in patients with new or deteriorated WSLs; P = .035/.057). The WSL-Index sum score, on the other hand, decreased significantly (P ≤ .001) from 3.5 ± 3.20 at T1 to 2.4 ± 2.94 at T3 (from 2.9 ± 3.26 to 2.5 ± 2.96 in patients with new or deteriorated WSLs). This is also apparent when considering the number of affected and newly affected or deteriorated incisors, respectively, at T1 (affected—T1: 1.1 ± 0.38 vs. T3: 0.8 ± 0.81; newly affected/deteriorated—T1: 1.2 ± 0.40 vs. T3: 0.8 ± 0.92; P = .001/.001). In addition, the WSL-Index median score (Table 4) decreased from 1.3 ± 0.46 at T1 to 0.9 ± 0.87 at T3 (from 1.3 ± 0.47 to 1.0 ± 0.91 in incisors with a new or deteriorated WSLs, respectively).
WSL-Index.
| T1 | T3 | T1 vs. T3 | |||||||||
|---|---|---|---|---|---|---|---|---|---|---|---|
| M | SD | 95% CI | Med | M | SD | 95% CI | Med | P | |||
| Number of affected teeth in patients | with ≥1 incisor(s) exhibiting a WSL | at T1 | 3.0 | 2.24 | 2.1–3.9 | 2.0 | 1.9 | 2.01 | 1.0–2.7 | 1.0 | .001 |
| with ≥1 incisor(s) exhibiting a new or deteriorated WSL | 2.4 | 2.36 | 1.4–3.3 | 2.0 | 1.8 | 1.97 | 0.9–2.7 | 1.0 | .001 | ||
| WSL-Index maximum score in patients | with ≥1 incisor(s) exhibiting a WSL | 1.4 | 0.50 | 1.2–1.6 | 1.0 | 1.2 | 1.12 | 0.7–1.6 | 1.0 | .035 | |
| with ≥1 incisor(s) exhibiting a new or deteriorated WSL | 1.2 | 0.74 | 0.9–1.5 | 1.0 | 1.2 | 1.25 | 0.6–1.8 | 1.0 | .057 | ||
| WSL-Index sum score in patients | with ≥1 incisor(s) exhibiting a WSL | 3.5 | 3.20 | 2.2–4.8 | 2.0 | 2.4 | 2.94 | 1.3–3.6 | 1.5 | .001 | |
| with ≥1 incisor(s) exhibiting a new or deteriorated WSL | 2.9 | 3.26 | 1.5–4.2 | 1.5 | 2.5 | 2.96 | 1.2–3.9 | 1.0 | .001 | ||
| WSL-Index sum score/number of affected incisors in patients | with ≥1 incisor(s) exhibiting a WSL | 1.1 | 0.38 | 1.0–1.3 | 1.0 | 0.8 | 0.81 | 0.4–1.1 | 0.8 | .001 | |
| with ≥1 incisor(s) exhibiting a new or deteriorated WSL | 1.2 | 0.40 | 1.0–1.4 | 1.0 | 0.8 | 0.92 | 0.4–1.2 | 0.9 | .001 | ||
The number of affected teeth, the maximum and sum scores on the patient level as well as the sum score on the tooth level are given for T1 and T3. In addition to the mean value (M), standard deviation (SD), 95% confidence interval (CI) and median value, the P-values for the comparison T1 vs. T3 are given.
WSL-Index median score in affected incisors at T1 and T3: the mean value (M), standard deviation (SD), 95% confidence interval (CI) and median value are given for the different incisor types.
| T1 | T3 | T1 vs. T3 | ||||||||||
|---|---|---|---|---|---|---|---|---|---|---|---|---|
| n | WSL-Index median score | n | WSL-Index median score | |||||||||
| M | SD | 95% CI | Med | M | SD | 95% CI | Med | P | ||||
| Incisors exhibiting a WSL | Total | 81 | 1.3 | 0.46 | 1.2–1.4 | 1.0 | 71 | 0.9 | 0.87 | 0.7–1.1 | 1.0 | .001 |
| Tooth 12 | 17 | 1.4 | 0.49 | 1.1–1.6 | 1.0 | 16 | 1.1 | 1.29 | 0.4–1.8 | 1.0 | .065 | |
| Tooth 11 | 5 | 1.0 | 0.00 | 1.0–1.0 | 1.0 | 5 | 0.4 | 0.55 | −0.3–1.1 | 0.0 | .250 | |
| Tooth 21 | 7 | 1.3 | 0.49 | 0.8–1.7 | 1.0 | 5 | 0.8 | 0.45 | 0.2–1.4 | 1.0 | .250 | |
| Tooth 22 | 22 | 1.3 | 0.48 | 1.1–1.5 | 1.0 | 19 | 0.8 | 0.71 | 0.4–1.1 | 1.0 | .006 | |
| Tooth 32 | 7 | 1.3 | 0.49 | 0.8–1.7 | 1.0 | 6 | 0.8 | 0.75 | 0.0–1.6 | 1.0 | .250 | |
| Tooth 31 | 6 | 1.5 | 0.55 | 0.9–2.1 | 1.5 | 6 | 1.0 | 0.89 | 0.1–1.9 | 1.0 | .625 | |
| Tooth 41 | 8 | 1.3 | 0.46 | 0.9–1.6 | 1.0 | 7 | 1.0 | 0.82 | 0.2–1.8 | 1.0 | .625 | |
| Tooth 42 | 9 | 1.2 | 0.44 | 0.9–1.6 | 1.0 | 7 | 1.1 | 0.69 | 0.5–1.8 | 1.0 | 1.000 | |
| Incisors exhibiting a new or deteriorated WSL | Total | 64 | 1.3 | 0.48 | 1.2–1.5 | 1.0 | 55 | 1.0 | 0.94 | 0.7–1.2 | 1.0 | .001 |
| Tooth 12 | 14 | 1.4 | 0.50 | 1.1–1.6 | 1.0 | 13 | 1.2 | 1.41 | 0.3–2.0 | 1.0 | .180 | |
| Tooth 11 | 3 | 1.0 | 0.00 | 1.0–1.0 | 1.0 | 3 | 0.3 | 0.58 | −1.1–1.8 | 0.0 | .500 | |
| Tooth 21 | 5 | 1.4 | 0.55 | 0.7–2.1 | 1.0 | 3 | 1.0 | 0.00 | 1.0–1.0 | 1.0 | .500 | |
| Tooth 22 | 17 | 1.4 | 0.49 | 1.1–1.6 | 1.0 | 14 | 0.8 | 0.77 | 0.4–1.3 | 1.0 | .039 | |
| Tooth 32 | 6 | 1.3 | 0.52 | 0.8–0.9 | 1.0 | 5 | 0.8 | 0.84 | −0.2–1.8 | 1.0 | .250 | |
| Tooth 31 | 6 | 1.5 | 0.55 | 0.9–2.1 | 1.5 | 6 | 1.0 | 0.89 | 0.1–1.9 | 1.0 | .625 | |
| Tooth 41 | 6 | 1.3 | 0.52 | 0.8–1.9 | 1.0 | 5 | 1.0 | 1.00 | −0.2–2.2 | 1.0 | .625 | |
| Tooth 42 | 7 | 1.3 | 0.49 | 0.8–1.7 | 1.0 | 6 | 1.2 | 0.75 | 0.4–2.0 | 1.0 | 1.000 | |
In addition, the p-value for the comparison T1 vs. T3 is given.
These changes are also visible when considering the percentages of categorizations for ‘No WSL’ (T1: not applicable, T3: 28.4%), ‘Slight’ (T1: 70.4%, T3: 45.7%), ‘Severe’ (T1: 29.6%, T3: 9.9%), ‘Cavitation’ (T1: not applicable, T3: 1.2%), and ‘Restorative treatment’ (T1: not applicable, T3: 2.5%) shown in Fig. 3.
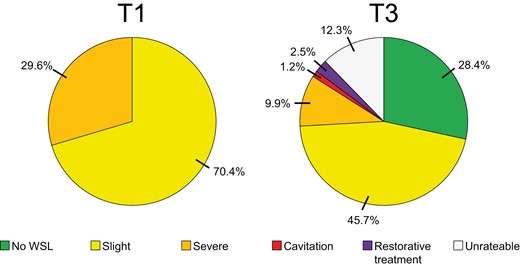
WSL-Index at T1 and T3: percentages (%) of upper incisors exhibiting the WSL categories ‘No WSL’, ‘Slight’, ‘Severe’ or ‘Cavitation’ respectively showing ‘Restorative treatment’, ‘Unrateable’.
These data are in concordance with the findings regarding the modified WSL-Change-Index (Fig. 4). When comparing the photographs from T1 and T3, on 28.4% of the incisors no WSL was visible any more, and additional 21.0% of the WSLs were rated as improved. Of the remaining incisors 30.9% exhibited no change, 12.3% a deterioration and the remaining 7.4% were categorized as unrateable. For incisors exhibiting a new or deteriorated WSL at T1, the values at T3 were similar: 29.0% no WSL, 27.5% improved, 25.8% unchanged, 8.0% deteriorated, and 9.7% unrateable.
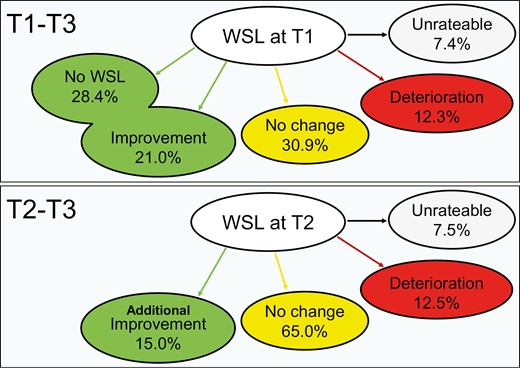
WSL-Change-Index (T1-T3, T2-T3): percentages of affected incisors (WSL at T1) showing ‘No WSL’/”Improvement”, ‘No change’, ‘Deterioration’ or being ‘Unrateable’.
For the affected 64 incisors (T1), where short- and long-term data (T2 and T3) were available, additional improvement after T2 was found in 15.0%. A majority of 65.0% exhibited no further change during the long-term observation period; 12.5% were rated as ‘deteriorated’ and 7.5% as ‘unrateable’. The respective values for affected incisors with a new or deteriorated WSL were very similar (additional improvement: 15.6%, no further change: 60.9%, deterioration: 14.1%, unrateable: 9.4%)
Caries data—missing and filled teeth (MFT)
Looking at MFT, the values ranged between 2.2 ± 3.16 and 3.5 ± 2.72 (T0), 2.3 ± 3.44 and 5.1 ± 3.27 (T1), 2.1 ± 2.53 and 7.1 ± 5.23 (T2), and 5.6 ± 3.92 and 10.4 ± 6.10 (T3), respectively (Tables 5 and 6).
Data on missing and filled teeth (MFT, MT, FT).
| T0 | T1 | T2 | T3 | |||||||||||||||||||
|---|---|---|---|---|---|---|---|---|---|---|---|---|---|---|---|---|---|---|---|---|---|---|
| M | SD | 95% CI | Med | P | M | SD | 95% CI | Med | P | M | SD | 95% CI | Med | P | M | SD | 95% CI | Med | P | |||
| Patients | MFT | |||||||||||||||||||||
| with | WSL(s) at T0 | 3.5 | 2.72 | 1.6–5.4 | 3.5 | .085 | 5.1 | 3.27 | 2.4–7.9 | 4.5 | .018 | 7.1 | 5.23 | 3.1–11.1 | 6.0 | .008 | 10.4 | 6.1 | 6.3–14.5 | 11.0 | .043 | |
| without | 2.3 | 2.99 | 1.5-3.1 | 1.0 | 2.5 | 3.20 | 1.6-3.3 | 2.0 | 2.6 | 2.77 | 1.8-3.4 | 1.0 | 6.5 | 4.4 | 5.4-7.6 | 7.0 | ||||||
| with | WSL(s) at T1 | 2.9 | 2.43 | 1.9–3.9 | 3.0 | .064 | 3.9 | 2.77 | 2.6–5.1 | 3.0 | .009 | 5.2 | 4.24 | 3.3–7.0 | 5.0 | .003 | 9.5 | 5.2 | 7.5–11.6 | 9.0 | .002 | |
| without | 2.2 | 3.25 | 1.1–3.2 | 1.0 | 2.3 | 3.44 | 1.2-3.3 | 1.0 | 2.1 | 2.53 | 1.3–3.0 | 1.0 | 5.6 | 3.9 | 4.4–6.8 | 6.0 | ||||||
| with | new or deteriorated WSL(s) at T1 | 3.0 | 2.49 | 1.9–4.1 | 3.0 | .104 | 3.6 | 2.71 | 2.3–4.9 | 3.0 | .052 | 5.2 | 4.45 | 3.1–7.4 | 5.0 | .018 | 9.9 | 5.5 | 7.5–12.3 | 9.0 | .003 | |
| without | 2.2 | 3.16 | 1.2–3.1 | 1.0 | 2.5 | 3.48 | 1.4–3.5 | 1.0 | 2.4 | 2.73 | 1.5–3.3 | 1.0 | 5.8 | 4.0 | 4.7–6.9 | 6.5 | ||||||
| MT | ||||||||||||||||||||||
| with | WSL(s) at T0 | 0.0 | 0.00 | 0.0–0.0 | 0.0 | 1.000 | 0.0 | 0.00 | 0.0–0.0 | 0.0 | .593 | 0.0 | 0.00 | 0.0–0.0 | 0.0 | .549 | 0.4 | 0.92 | -0.3–1.0 | 0.0 | .522 | |
| without | 0.0 | 0.00 | 0.0–0.0 | 0.0 | 0.1 | 0.29 | 0.0–0.1 | 0.0 | 0.1 | 0.31 | 0.0–0.2 | 0.0 | 0.2 | 0.65 | 0.0–0.4 | 0.0 | ||||||
| with | WSL(s) at T1 | 0.0 | 0.00 | 0.0–0.0 | 0.0 | 1.000 | 0.1 | 0.43 | –0.1-0.3 | 0.0 | .610 | 0.1 | 0.42 | -0.1–0.3 | 0.0 | .714 | 0.4 | 1.01 | 0.0–0.9 | 0.0 | .049 | |
| without | 0.0 | 0.00 | 0.0–0.0 | 0.0 | 0.0 | 0.15 | 0.0–0.1 | 0.0 | 0.0 | 0.16 | 0.0–0.1 | 0.0 | 0.1 | 0.36 | 0.0–0.2 | 0.0 | ||||||
| with | new or deteriorated WSL(s) at T1 | 0.0 | 0.00 | 0.0–0.0 | 0.0 | 1.000 | 0.1 | 0.46 | −0.1–0.3 | 0.0 | .500 | 0.1 | 0.46 | −0.1–0.3 | 0.0 | .557 | 0.6 | 1.10 | 0.1–1.0 | 0.0 | .011 | |
| without | 0.0 | 0.00 | 0.0–0.0 | 0.0 | 0.0 | 0.15 | 0.0–0.7 | 0.0 | 0.0 | 0.16 | 0.0–0.1 | 0.0 | 0.1 | 0.34 | 0.0–0.2 | 0.0 | ||||||
| FT | ||||||||||||||||||||||
| with | WSL(s) at T0 | 3.5 | 2.72 | 1.6–5.4 | 3.5 | .085 | 5.1 | 3.27 | 2.4–7.9 | 4.5 | .016 | 7.1 | 5.23 | 3.1–11.1 | 6.0 | .008 | 10.0 | 5.60 | 6.2–13.8 | 11.0 | .034 | |
| without | 2.3 | 2.99 | 1.5–3.1 | 1.0 | 2.4 | 3.17 | 1.6–3.3 | 2.0 | 2.6 | 2.72 | 1.8–3.3 | 1.0 | 6.3 | 4.22 | 5.2–7,4 | 7.0 | ||||||
| with | WSL(s) at T1 | 2.9 | 2.43 | 1.9–3.9 | 3.0 | .064 | 3.8 | 2.69 | 2.6–5.0 | 3.0 | .010 | 5.1 | 4.20 | 3.3–6.9 | 5.0 | .003 | 9.1 | 4.95 | 7.1–11.0 | 8.0 | .003 | |
| without | 2.2 | 3.25 | 1.1–3.2 | 1.0 | 2.2 | 3.46 | 1.2–3.3 | 1.0 | 2.1 | 2.54 | 1.2–2.9 | 1.0 | 5.5 | 3.88 | 4.3–6.7 | 6.0 | ||||||
| with | new or deteriorated WSL(s) at T1 | 3.0 | 2.49 | 1.9–4.1 | 3.0 | .104 | 3.5 | 2.61 | 2.3–4.8 | 3.0 | .054 | 5.1 | 4.41 | 3.0–7.2 | 5.0 | .018 | 9.4 | 5.16 | 7.1–11.7 | 8.5 | .005 | |
| without | 2.2 | 3.16 | 1.2–3.1 | 1.0 | 2.4 | 3.49 | 1.4–3.5 | 1.0 | 2.4 | 2.75 | 1.5–3.2 | 1.0 | 5.7 | 3.92 | 4.6–6.9 | 6.0 | ||||||
The mean value (M), standard deviation (SD), 95% confidence interval (CI) and median value are given for T0, T1, T2 and T3. In addition, the P-values for the comparisons affected vs. non-affected at teeth at T0 respectively T1 are displayed.
Associations between the WSL-Index data (numbers of affected patients and teeth, WSL-Index sum and maximum scores) at T0, T1 and T2 and the caries data (MFT) as well as sex, respectively.
| T0 - caries | T0 - MFT | T1 - caries | T1 - MFT | T2 - caries | T2 - MFT | T3 – MFT | Sex | |||||||||||
|---|---|---|---|---|---|---|---|---|---|---|---|---|---|---|---|---|---|---|
| T0 | incisor(s) exhibiting a WSL | Patient affected | V | 0.143 | ρ | 0.072 | V | 0.054 | ρ | 0.206 | V | -0.097 | ρ | 0.174 | ρ | 0.050 | V | 0.086 |
| number of affected teeth | ρ | 0.151 | ρ | 0.075 | ρ | 0.048 | ρ | 0.206 | ρ | -0.097 | ρ | 0.177 | ρ | 0.050 | ρ | 0.093 | ||
| T1 | incisor(s) exhibiting a WSL | patient affected | V | 0.099 | ρ | 0.228 | V | 0.226 | ρ | 0.325 | V | 0.034 | ρ | 0.385 | ρ | 0.372 | V | 0.115 |
| number of affected teeth | ρ | 0.127 | ρ | 0.257 | ρ | 0.268 | ρ | 0.342 | ρ | 0.027 | ρ | 0.404 | ρ | 0.412 | ρ | 0.104 | ||
| WSL-Index sum score | ρ | 0.118 | ρ | 0.258 | ρ | 0.259 | ρ | 0.339 | ρ | 0.038 | ρ | 0.400 | ρ | 0.405 | ρ | 0.110 | ||
| WSL-Index maximum score | ρ | 0.112 | ρ | 0.260 | ρ | 0.240 | ρ | 0.343 | ρ | 0.061 | ρ | 0.406 | ρ | 0.390 | ρ | 0.140 | ||
| incisors exhibiting a new or deteriorated WSL | patient affected | V | 0.012 | ρ | 0.202 | V | 0.268 | ρ | 0.266 | V | 0.073 | ρ | 0.334 | ρ | 0.399 | V | 0.107 | |
| number of affected teeth | ρ | 0.034 | ρ | 0.213 | ρ | 0.250 | ρ | 0.250 | ρ | 0.082 | ρ | 0.323 | ρ | 0.393 | ρ | 0.054 | ||
| WSL-Index sum score | ρ | 0.032 | ρ | 0.216 | ρ | 0.245 | ρ | 0.252 | ρ | 0.089 | ρ | 0.321 | ρ | 0.388 | ρ | 0.063 | ||
| WSL-Index maximum score | ρ | 0.036 | ρ | 0.235 | ρ | 0.231 | ρ | 0.269 | ρ | 0.106 | ρ | 0.337 | ρ | 0.386 | ρ | 0.091 | ||
| T3 | incisor(s) exhibiting a WSL at T1 | patient affected | V | 0.300 | ρ | 0.314 | V | 0.413 | ρ | 0.311 | V | 0.103 | ρ | 0.271 | ρ | 0.220 | V | 0.201 |
| number of affected teeth | ρ | 0.385 | ρ | 0.404 | ρ | 0.524 | ρ | 0.377 | ρ | 0.322 | ρ | 0.343 | ρ | 0.314 | ρ | 0.284 | ||
| WSL-Index sum score | ρ | 0.428 | ρ | 0.492 | ρ | 0.581 | ρ | 0.454 | ρ | 0.526 | ρ | 0.384 | ρ | 0.373 | ρ | 0.283 | ||
| WSL-Index maximum score | ρ | 0.237 | ρ | 0.419 | ρ | 0.395 | ρ | 0.350 | ρ | 0.216 | ρ | 0.364 | ρ | 0.139 | ρ | 0.087 | ||
| incisors exhibiting a new or deteriorated WSL at T1 | patient affected | V | 0.242 | ρ | 0.252 | V | 0.409 | ρ | 0.270 | V | 0.105 | ρ | 0.230 | ρ | 0.162 | V | 0.105 | |
| number of affected teeth | ρ | 0.339 | ρ | 0.348 | ρ | 0.513 | ρ | 0.340 | ρ | 0.279 | ρ | 0.307 | ρ | 0.254 | ρ | 0.218 | ||
| WSL-Index sum score | ρ | 0.485 | ρ | 0.471 | ρ | 0.490 | ρ | 0.416 | ρ | 0.568 | ρ | 0.379 | ρ | 0.362 | ρ | 0.314 | ||
| WSL-Index maximum score | ρ | 0.224 | ρ | 0.348 | ρ | 0.250 | ρ | 0.221 | ρ | 0.250 | ρ | 0.332 | ρ | 0.109 | ρ | 0.067 | ||
The values of Cramèrs V (V) and Spearman’s correlation (ρ) are given; values >0.5 were considered as moderate associations.
Statistically significant differences were determined for all occasions T1, T2, and T3 when comparing patients with and without
incisor(s) exhibiting a WSL at T0 (P = .008–.043)
incisor(s) exhibiting a WSL at T1 (P = .002–.009)
incisor(s) exhibiting a new or deteriorated WSL at T1 (P = .003–.052)
in terms of higher MFT values being present in patients with WSL.
As the total number of teeth missing due to caries or alike was only 16 when looking at all 72 participants at T3, the values for FT and MT are only given in Table 5.
Evaluating the results of the bivariate analysis, no associations were found.
Discussion
The current study is the first to investigate the very long-term post-orthodontic changes of WSLs on incisor teeth after a period of ≥15 years. In accordance with our main objective, we were able to show with our study how WSLs present over a very long period of time, even without a specific therapeutic intervention (an example is given in Fig. 5). Nevertheless, summing up these results, the null hypothesis, that orthodontically induced WSLs do not change in appearance over an observation period of ≥15 years, has to be rejected. We were further able to show that there is an association between caries experience and WSLs. While a publication from 2014 describes the changes of the WSL sum area in 30 patients over a 12-year post-orthodontic period, it did not consider the actual impact in terms of clinical visibility [24]. In addition, the method of the current investigation was different as the assessment was not computer-based but performed by a panel of experienced dentists who independently evaluated the photographs focussing on the progress of WSLs on affected teeth only. The additional consideration of radiologic data for such a patient sample is also unique.
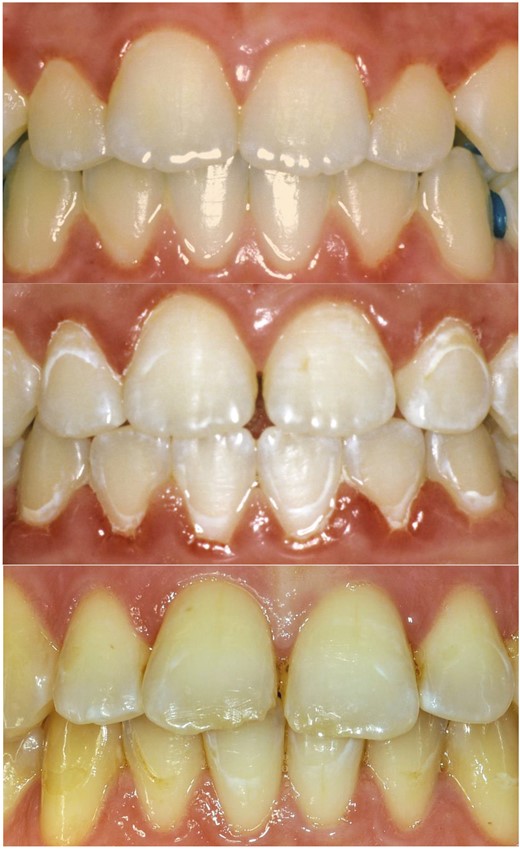
Case presentation: Teeth 12-22 and 32-42 affected at T1 and adequately visible/rateable at T0, T1, T2 and T3.
Looking at the current patient sample, it varied in terms of sex and age at the end of active treatment respectively recall, but it was rather homogenous in terms of the orthodontic Tx procedures (Herbst-MBA Tx). In addition, the current investigation was performed under as much standardized conditions as possible in terms of photograph and radiograph assessment (room lighting, projection size, distance between assessors and screen). Nevertheless, the records had been collected over a period of approximately 30 years where especially the quality of the radiographs might exhibit a certain degree of variation. In addition, all the photographs but those from T3 were original slides, therefore no standardization was performed, which might be considered as limitation. On the other hand, the same photographer had been employed at the department during all these years and the same room was used, so that the photographing protocol and the light conditions probably were more or less the same. On the downside, for natural reasons the camera equipment changed several times and switched from analogue to digital; this can be assumed to have come along with a quality reduction over the years and might be considered as limitation. However, the assessment was based on visible contrast/differences within individual photographs only, and in case of comparison (e.g. T1–T3), it was the visibility of these differences that was analysed; which means that no direct comparison of absolute colour values was performed/would have been possible.
Regarding the results, it can be stated that the pre-Tx prevalence for WSLs on front teeth (photograph assessment) of 15.5% of the patients being affected is slightly lower than the data given in the literature (32.3% and 37.9%) [3, 59]. A reason for this difference might be a certain selection bias as the participants of the recall investigation might not be fully representative for the general patient population. Participating in the recall investigation, these individuals might be and might always have been more interested in their teeth and oral health than those who did not participate. On the tooth level, the current investigation determined a prevalence of 4.8% for the incisors, which is also lower than most values in literature ranging between 3.5% and 25.4% [1, 16, 60].
Also concerning the prevalence of 37.5% for patients being affected with WSLs on the incisors immediately after orthodontic Tx, again the literature shows a distinctly higher value of 73.5%. While this value was generated at the same location as the present data using a similar method, only one assessor rated the incisors (upper only) and no ‘selection’ of patients happened due to a retrospective design [3], which might at least partly explain this difference. On the tooth level, again, the values in the literature are distinctly higher than the current prevalence of 15.0% and range between 32.3% and 57.4% [3, 60].
As several publications only report incidence values, it seems reasonable to compare these data to the current values of 30.6% (patient level) and 16.2% (tooth level) as well. Only one publication describes an incidence value for WSLs on (upper) anterior teeth which is 60.9% on the patient level [3] and therefore distinctly higher than the current value which, in contrast, is not only based on the upper but also on the lower incisors. On the tooth level, however, incidence values in the literature range between 3.4% and 42.4% for anterior teeth and are in accordance with the current investigation [1, 4, 6, 9, 14, 60–62].
When comparing the current prevalence data in terms of frequency of tooth types affected with WSLs to the literature, kind of a congruence can be observed. Upper lateral incisors were determined to be more frequently affected with WSLs (21.0–27.2%) than other incisors as it has been stated in other publications as well [6, 8, 9, 12, 13, 15].
Looking at severity of the WSLs and the respective development, a comparison to the literature is possible for immediately post-Tx, where two other publications reported similar and less favourable data, respectively [6, 14, 62], when applying the same method. No respective long-term data exist. Regarding the long-term development, only one publication which describes significant (P < .001) reductions in WSL size during the first and the second year after orthodontic Tx is available; an additional 10 years later, further improvement had occurred (P > .05), but the pre-Tx level was not achieved [24]. These observations are in concordance with the current investigation, even if the variables are different. Nevertheless, we want to highlight that the current investigation determined a reduction of lesions being categorized as severe from ≈30% immediately post-Tx (T1) to ≈10% ≥15 years later (T3).
Other investigations also describe a certain amount of improvement but no complete healing short-term [3, 54, 55, 59, 60]:
general improvement in 57.1% of affected patients when applying the modified version of the WSL-Index [14] ≈ 2 years after Tx [3]
a reduction in the mean number of affected teeth per patient by ≈10–15% and the mean extent of decalcification per tooth by ≈10–20% 13.7 ± 4.1 months after Tx [59]
a reduction of the mean size of the lesions by ≈50% 6 months after Tx [55]
a reduction of the total fluorescence loss per subject by ≈7% 6 months after Tx, while the lesion areas, however, did not change [54]
Nevertheless, as determined by the current investigation, only a limited amount of additional improvement can be expected after a post-Tx period of roundabout 2 years. While the majority of WSLs did not show any further improvement, 15% still did and as many as 12.5% worsened. This shows that even after the first 2 years there is change both to the positive and to the negative. This at least gives an indication of the dynamics of WSL within the overall observation period.
The finding that WSL can improve over time cannot be readily explained given their ultrastructure. WSL are characterized by the disruption of the crystallite structure with a reduction of the crystallite size, an increased pore volume resulting in the typical whitish-opaque appearance [63]. Non-apatitic mineral structures attributed to remineralization processes can be found within these lesions [64]. White spots can be arrested by appropriate caries preventive measures, but the natural structure of healthy enamel cannot be restored. Therefore, white spots remain visible even when they are arrested. For this reason, procedures aimed at improving the optical properties of WSL such as infiltration with acrylics or treatment with special peptides that can support a kind of biomineralization have been developed. Although no information is available on whether our patient group sought such treatment for their WSL, the use of respective procedures is unlikely due to the timing of the study. A systematic review that compiled clinical trials on masking WSL appearing up to 2015 was only able to include two infiltration trials, each with short follow-up periods. This indicates that this approach was still in its early days at that time and thus not relevant for the present investigation.
The disruption of the crystallite structure not only leads to a change in optical properties, but also to a reduction in microhardness compared to healthy enamel. In view of the fact that remineralization can only arrest WSL but not make it invisible, it can be speculated that WSL have been simply worn away to a certain extent over a longer period of time due to physiological wear. Such wear processes are caused by abrasion, for example, by the daily use of toothpastes. Thus, it has been shown, that in contrast to healthy enamel, initial caries lesions can be abraded by brushing abrasion and that the dimension of the abrasion depends on the abrasiveness of the toothpaste [65]. Abrasion should have been particularly effective in more pronounced active WSL, as microhardness loss is related to the degree of demineralization. It should progress to a degree where a microhardness is reached at which the usual intraoral abrasion processes no longer cause further loss of substance. This does not necessarily have to be the healthy enamel, so WSLs will at some point no longer wear out and then remain visible. This may explain that although WSL improved, they were still present in most patients even after the long observation period.
Another wear mechanism is erosion, for example due to fruit or acidic drinks consumption causing loss of substance in both healthy and demineralized enamel. Thus, erosion and abrasion, which was previously suggested as a treatment strategy [66], could also occur naturally over a longer period of time.
Although it is plausible to assume an association of caries experience and the prevalence, incidence and severity of WSL, there is little data in the literature to support this assumption. A more recent cross-sectional study investigated what factors might be associated with WSL at the time of debonding [17]; among others, the first molars were assessed and rated as healthy, filled, carious or missing. Of the 130 patients included, 71.1% had WSL. Those who had developed WSL did not have more diseased molars than those without WSL, but there was a significant association between diseased molars at the start of treatment and WSL at the time of debonding in a regression model adjusted for age. In contrast, the present data clearly showed that patients with WSL had significantly higher FT index scores and also a higher prevalence of caries. This could perhaps be explained by the fact that our patient group showed a wide range of caries experience. About 45% of the patients had either no caries experience or one filling, while the rest exhibited 2 to 19 fillings. This distribution may have well accentuated the relationship between caries experience and WSL.
The finding that there was a clear association between caries experience and WSL makes it evident that patients with WSL have a special need for caries prevention in general. Therefore, the focus should not only be on how to arrest or mask WSL, but also on how to prevent caries increment throughout the dentition in these patients. The limitation here, however, is that we only had OPGs available, which are not as suitable for caries diagnostics as, for example, bitewing images. However, the present results show that it would be worthwhile to pursue the topic further.
In addition to the beforementioned limitations regarding homogeneity of the sample, material quality and observer reliability, the fact that no patient-reported outcome was evaluated needs to be considered. This was basically due to the design of the study, but as reported in another publication on that sample, the majority of the participants reported to be fully (70.8%) or conditionally (27.8%) satisfied with the situation and appearance of their teeth as well as masticatory system function at the time of the recall [67]. In addition, it would have been favourable to include more teeth than just the incisors but due to possible light reflections caused by the naturally rotated position of canines in comparison to the incisors, only incisors were assessed in the current investigation. Finally, we did not have orthopantomograms at T3, so the MF data came from radiographs as well as from the clinical examination. This seemed to us to be justified, because the recording of filled and missing teeth is straightforward in both instances and should correspond well; nevertheless, this represents a slight limitation.
Conclusions
Post-orthodontic WSLs showed spontaneous improvement long-term (≥15 years after debonding). While improvement was determined in 48% of the teeth, full recovery occurred in only 28%. On the patient level, improvement occurred in 37%, full recovery in 30%. Patients affected with post-Tx WSLs exhibited higher MFT values pre- and immediately post-treatment as well as long-term.
Funding
The study was financially supported by the German Society of Dentistry and Oral Medicine (DGZMK); this comprised fees for insurances, participants’ compensation and travel expenses as well as consumables.
Conflict of interest
The authors declare that they have no conflict of interest.
Data availability
Data are available on reasonable request from the corresponding author.

