


Abstract

The quality of the outcome after cardiac surgery with cardiopulmonary bypass depends on the patient demographics, co-morbidities, complexity of the surgical procedure and expertise of surgeons and the whole staff. The purpose of the present study is to analyse the timing of surgery (morning versus afternoon) with respect to morbidity and mortality in adult cardiac surgery.
The primary end point was the incidence of major morbidity defined according to a modified Society of Thoracic Surgeon criterion. We consecutively included all the adult (>18 years) patients receiving a cardiac surgery operation at our Institution.
From 2017 through 2019, a total of 4003 cardiac surgery patients were operated. With a propensity-matching technique a final patient population of 1600 patients was selected, with 800 patients in the first-case surgery group and 800 in the second-case surgery group. Patients in the second-case group had a major morbidity rate of 13% vs 8.8% in the first-case group (P = 0.006), and a higher rate of 30-day mortality (4.1% vs 2.3%, P = 0.033). After correction for EuroSCORE and operating surgeon, the second-case group confirmed a higher rate of major morbidity (odds ratio 1.610, 95% confidence interval 1.16–2.23, P = 0.004).
Our study suggests that patients operated as second cases are exposed to an increased morbidity and mortality probably due to fatigue, loss of attention and hurriedness in the operating room and decreased human resources in the intensive care unit.
INTRODUCTION
The outcome after a cardiac surgery operation with cardiopulmonary bypass (CPB) depends on a number of factors. Some are related to patient’s demographics and co-morbidities. Others depend on the nature and complexity of the surgical procedure. Besides these factors, the technical skill and expertise of surgeons, anaesthesiologists, perfusionists, intensivists and nurses is of paramount importance.
The quality of the human performance is in turn dependent on other factors, like fatigue, decreased attention, sleep deprivation and stress [1]. Hospital admission during the night hours or the weekend has been associated with a worse outcome, and this has been attributed to a lower skill of the attending clinicians [2, 3]. In some non-cardiac surgeries, postoperative morbidity and mortality was higher in patients operated in the afternoon or night-time [4–6], and anaesthesia-linked adverse events are more frequent in cases operated after 4 pm [7].
Many authors addressed the timing of cardiac surgery (morning versus afternoon) to investigate if this had an impact in terms of postoperative morbidity and mortality.
There are studies where no differences were found [8–14], and others where there was a clear trend towards a higher mortality rate in the afternoon cases, however not reaching a statistical significance due to an inadequate power of the sample size [15, 16]. Other authors found different results, showing a clear increase in morbidity and mortality for the afternoon cases [17, 18].
In this controversial scenario, that is of course based on retrospective analyses, the great majority of the studies suffer from some sources of bias. Among these, the most important are the non-consideration of the operating surgeon expertise; the inclusion of low-risk patients only; and a disproportion in the sample size of the 2 groups (usually, considerably larger in the morning group).
The purpose of the present study is to analyse the timing of surgery with respect to morbidity and mortality, with a propensity-matched analysis, and the inclusion of many items that were underestimated in the previous studies.
METHODS
This is a retrospective, propensity-matched study. The study was monocentric, conducted at the IRCCS Policlinico San Donato, a Clinical Research Hospital partially funded by the Italian Ministry of Health.
The primary end point was the incidence of major morbidity defined according to a modified Society of Thoracic Surgeon definition [19] as surgical reoperation, stroke, acute kidney injury, sepsis (instead of deep wound infection) or mechanical ventilation >48 h. Secondary end points included mortality at 30 days, low cardiac output state (LCOS), duration of mechanical ventilation and intensive care unit (ICU) and postoperative hospital stay.
Ethics statement
The study was approved by the local Ethics Committee (IRCCS San Raffaele Hospital). The approval number is 119/INT/2022, the approval date October 12, 2022. Given the retrospective nature of the study, a specific written informed consent was obtained whenever feasible; the remaining patient population gave a written informed consent for the use of their clinical data in an anonymous form, and for scientific purposes.
Patient population
We included all the adult (>18 years) patients receiving a cardiac surgery operation with CPB at our institution from 2017 to 2019. Exclusion criteria were as follows: congenital heart disease and emergency cases. We excluded from the analysis the patients operated by surgeons with a minimal level of activity (<20 cases in the study period).
Data collection and definitions
All data were retrieved from our institutional database. This included demographics, co-morbidities (defined according to the EuroSCORE II) [20], surgical details and outcome. Mortality was considered at 30-day from surgery. Risk stratification was achieved according to the EuroSCORE II. EuroSCORE II predicts hospital mortality: according to the data published by the authors, we applied a modified EuroSCORE II for 30-day mortality, by adding 0.6% [20].
The morbidity events were defined as follows: acute kidney injury was adjudicated for a serum creatinine increase of 100% with respect to baseline; sepsis as systemic infection confirmed by blood cultures; and stroke as central nervous damage confirmed by imaging.
LCOS was adjudicated in case of need for inotropic drugs >48 h.
Additional items included a complete metabolic profile of the patient immediately at the ICU admission, with arterial blood gas analysis (inclusive of acid–base balance, arterial oxygen tension, inspiratory oxygen fraction and arterial blood lactates), haematocrit (%), systemic arterial pressure (mmHg), central venous pressure (mmHg), heart rate (beats/min) and central temperature (°C).
The first case group comprised patients operated in the morning (induction of anaesthesia at 8.00 am) and the second-case group patients operated after the first case (induction of anaesthesia between 12 am and 5.00 pm) (last timing applied in our Institution for initiating non-emergency cases).
Sample size and statistics
The sample size was settled based on the primary end point (difference in major morbidity). From a retrospective analysis of our database, the incidence of major morbidity was 12%. We hypothesized that the second versus first case had a 50% difference, i.e. first case 9% and second case 14%. Based on this hypothesis, and with an alpha value of 0.05 and a power of 80%, the sample size was settled at 1236 patients (638 in each group).
The propensity matching process followed the current state of the art [21, 22]. Basically, we performed a logistic regression model fitted with timing of surgery (first versus second case) as the dependent variable; explanatory variables suspected of being confounders had to fulfil these categories: (i) occur temporarily before the outcome measure; (ii) are associated with the timing of surgery; and (iii) are associated with the outcome at a level of absolute standardized mean difference (ASMD) >0.10.
The correct matching was checked through an analysis of the ASMD after matching. According to the current standards, an ASMD <0.15 is considered a very small effect size, and between 0.15 and 0.20 a small effect size [23]. Given the large sample size, a very sensitive threshold for imbalance was settled at <0.10.
All data are expressed as number (%) or mean (standard deviation) and median (interquartile range) depending on the normality of distribution. Differences between percentages have been tested with a Pearson’s chi squared; differences between continuous variables have been tested with a Student’s t-test or non-parametric tests as appropriate. For differences between means, the mean difference with 95% confidence interval was indicated. A logistic regression analysis was applied in the sensitivity analysis, producing odds ratios and 95% confidence intervals. We estimated the associations and the odds ratio between timing of surgery and postoperative outcome after matching, using logistic regression models with robust standard errors. All the statistical analyses were performed with computerized packages (SPSS 20.0, IBM, Chicago, IL, USA; GraphPad, GraphPad Software, Inc, San Diego, CA, USA; SAS version 9.4, SAS Institute, Inc., Cary, NC, USA, and MedCalc, MedCalc Software, Ostend, Belgium). A two-tailed P-value of <0.05 was considered significant for all the statistical tests.
RESULTS
From January 2017 through December 2019, a total of 4003 cardiac surgery patients were operated at our institution. Figure 1 shows the flowchart leading to our final patient population. After exclusion of congenital heart patients (N = 1384), emergency/salvage cases (N = 54) and surgeons with a minimal (<20 cases in 3 years) level of activity (N = 60), 2505 patients remained available for the analyses: 1458 patients belonged to the first-case group and 1047 to the second-case group.
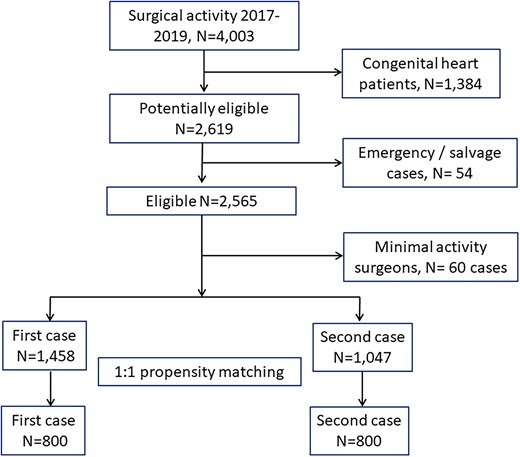
Flowchart leading to the final patient population.
In Table 1, we have reported the details of patients in the first- and second-case groups before and after matching. Before matching, the ASMD exceeded the limit of ±0.10 for a number of variables: left ventricular ejection fraction, serum creatinine, serum bilirubin, congestive heart failure, active endocarditis, previous cerebrovascular accident, redo surgery, non-elective surgery, CPB duration, aortic cross-clamp time, nadir temperature on CPB and operating surgeon. We did apply a logistic regression including these variables as independent variables and the timing of surgery (first versus second case) as dependent variable. The propensity-score matching required the elimination of 247 patients from the second-case group, due to impossible matching with similar propensity scores patients in the first-case group. The final patient population was 800 patients in the second-case group that were matched at a 1:1 ratio (without replacement) with patients of the first-case group. This final patient population largely exceeded the minimal sample size required to verify our hypothesis. After matching, the ASMD remained always <0.10, thus demonstrating a minimal between groups difference.
Pre- and intraoperative variables before and after matching
| Variable | First case (N = 1458) | Second case (N = 1047) | ASMD pre-match | First case post-match (N = 800) | Second case post-match (N = 800) | ASMD post-match |
|---|---|---|---|---|---|---|
| Age (years) | 66.6 (12.7) | 67.3 (12.5) | −0.05 | 67.2 (12.5) | 66.7 (12.6) | 0.04 |
| Weight (kg) | 73.4 (14.9) | 73,8 (15.6) | −0.02 | 73 (14.5) | 74.1 (15.7) | −0.07 |
| Gender male | 923 (63.3) | 686 (65.5) | −0.06 | 503 (62.9) | 527 (65.9) | −0.06 |
| Ejection fraction (%) | 55.1 (11.6) | 53.7 (11.8) | 0.11 | 55.1 (11.5) | 54.3 (11.6) | 0.07 |
| Serum creatinine (mg/dl) | 1.05 (0.70) | 1.14 (1.01) | −0.11 | 1.09 (0.80) | 1.12 (1.04) | −0.03 |
| Serum bilirubin (mg/dl) | 0.64 (0.30) | 0.68 (0.39) | −0.11 | 0.65 (0.29) | 0.67 (0.39) | −0.06 |
| Preoperative haematocrit (%) | 40.2 (11.3) | 39.5 (9.3) | 0.07 | 40.3 (14.8) | 39.9 (10.1) | 0.03 |
| Diabetes on medication | 246 (17) | 187 (18) | −0.03 | 143 (18) | 137 (17) | 0.03 |
| COPD | 34 (2.3) | 24 (2.3) | 0.00 | 22 (2.8) | 14 (1.8) | 0.07 |
| Congestive heart failure | 102 (7.0) | 109 (10.4) | −0.12 | 59 (7.4) | 66 (8.3) | −0.03 |
| Active endocarditis | 30 (2.1) | 45 (4.3) | −0.13 | 25 (3.1) | 26 (3.3) | −0.01 |
| Previous CVA | 39 (2.7) | 53 (5.1) | −0.12 | 29 (3.6) | 32 (4.0) | −0.02 |
| Isolated CABG | 318 (21.8) | 352 (24.1) | −0.05 | 185 (23.1) | 188 (23.5) | −0.01 |
| Isolated aortic valve surgery | 328 (22.5) | 203 (19.4) | 0.08 | 163 (20.4) | 163 (20.4) | 0 |
| Isolated mitral valve surgery | 260 (17.8) | 200 (19.1) | −0.03 | 141 (17.6) | 166 (20.8) | −0.08 |
| Ascending aorta surgery | 106 (7.3) | 83 (7.9) | −0.02 | 67 (8.4) | 60 (7.5) | 0.03 |
| Combined surgery | 495 (34) | 375 (35.8) | −0.04 | 281 (35.1) | 274 (34.3) | 0.02 |
| Others | 63 (4.3) | 34 (3.2) | 0.06 | 31 (3.9) | 24 (3.0) | 0.05 |
| Redo surgery | 95 (6.5) | 99 (9.5) | −0.11 | 62 (7.8) | 64 (8.0) | −0.01 |
| Non-elective surgery | 236 (16.2) | 290 (27.7) | −0.28 | 182 (22.8) | 176 (22) | 0.02 |
| EuroSCORE IIa | 3.4 (3.2) | 4.3 (4.8) | −0.22 | 3.8 (3.7) | 3.7 (3.6) | 0.03 |
| CPB time (min) | 85 (36) | 104 (54) | −0.41 | 93 (40) | 96 (45) | −0.07 |
| Aortic X-clamp time (min) | 63 (27) | 74 (36) | −0.35 | 68 (30) | 70 (33) | −0.06 |
| Nadir T on CPB (°C) | 33 (2.8) | 32.7 (2.2) | 0.12 | 33 (3.5) | 32.8 (2.1) | 0.07 |
| Surgeon | ||||||
| A (junior) | 67 (4.6) | 113 (10.8) | −0.23 | 64 (8.0) | 65 (8.1) | 0 |
| B (senior) | 84 (5.8) | 132 (12.6) | −0.24 | 80 (10) | 72 (9.0) | 0.03 |
| C (head of department)) | 492 (33.7) | 260 (24.8) | 0.21 | 240 (30) | 230 (28.7) | 0.03 |
| D (senior) | 30 (2.1) | 34 (3.2) | −0.07 | 23 (2.9) | 34 (4.3) | −0.07 |
| E (senior) | 13 (0.9) | 29 (2.8) | −0.14 | 11 (1.4) | 15 (1.9) | −0.04 |
| F (senior) | 72 (4.9) | 57 (5.4) | −0.02 | 44 (5.5) | 49 (6.1) | −0.03 |
| G (junior) | 38 (2.6) | 79 (7.5) | −0.22 | 37 (4.6) | 45 (5.6) | −0.04 |
| H (director) | 520 (36) | 209 (20) | 0.36 | 180 (22.5) | 194 (24.3) | −0.04 |
| I (senior) | 79 (5.4) | 103 (9.8) | −0.17 | 76 (9.5) | 66 (8.2) | 0.05 |
| J (senior) | 63 (4.3) | 31 (3.0) | 0.07 | 45 (5.6) | 30 (3.7) | 0.09 |
Data are mean (standard deviation) or number (%).
Corrected for 30-day mortality.
ASMD: absolute standardized mean difference; CABG: coronary artery bypass graft; COPD: chronic obstructive pulmonary disease; CPB: cardiopulmonary bypass; CVA: cerebrovascular accident; T: temperature.
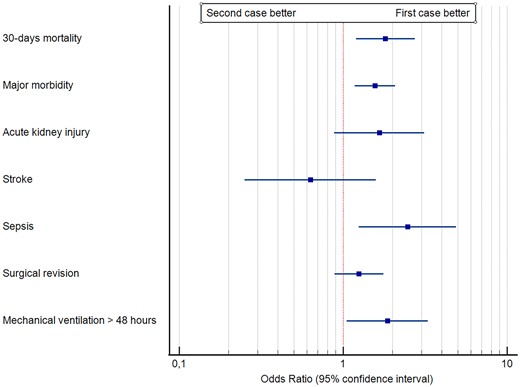
Table 2 and Fig. 2 report the outcome of the 2 groups. Patients in the second-case group had a significantly (P = 0.002) higher rate of major morbidity, and a significantly higher rate of 30-day mortality (P = 0.005). Within the components of major morbidity, sepsis and mechanical ventilation >48 h had a significantly (P = 0.010 and P = 0.032, respectively) higher rate in the second-case group. The rate of early (<6 h) extubation was significantly (P < 0.0001) lower in the second-case group, and the LCOS rate was significantly (P = 0.003) higher in the second-case group. No other outcome differences were noticed. The early extubated patients in the second-case group received a nocturnal extubation. Within the second-case group, those receiving nocturnal extubation (66 patients) had no significant morbidity and mortality differences with respect to patients extubated ≥6 h. We conducted a more specific analysis of the 30-day mortality within the second-case group, to identify whether the timing of surgery was associated with the outcome. Figure 3 shows the cubic spline function obtained in the interval between 12 am and 5 pm. No specific trend was identified, and, within the second-case group, an early or late beginning of surgery was not associated with differences in mortality.
Comparison of the outcome between the two groups.
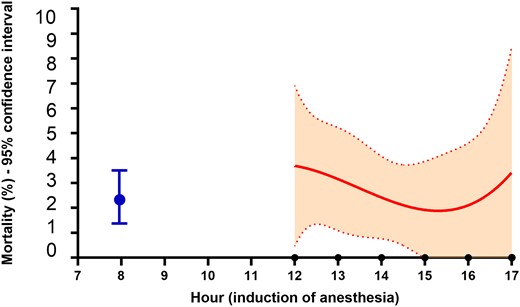
Cubic spline function of the association between the initial hour of anaesthesia induction and 30-day mortality within the second-case group. Dashed lines are 95% confidence interval. The blue dot is the mortality rate (with 95% confidence interval of the first-case group).
Postoperative outcome
| Item | First case, N = 800 | Second case, N = 800 | OR (95% CI) | P-Value |
|---|---|---|---|---|
| 30-Day mortality | 18 (2.3) | 33 (4.1) | 1.81 (1.20–2.73) | 0.005 |
| Major morbidity | 70 (8.8) | 104 (13) | 1.56 (1.18–2.07) | 0.002 |
| Acute kidney injury | 14 (1.8) | 23 (2.9) | 1.66 (0.88–3.13) | 0.116 |
| Stroke | 11 (1.4) | 7 (0.9) | 0.63 (0.25–1.58) | 0.326 |
| Sepsis | 12 (1.5) | 29 (3.6) | 2.47 (1.25–4.89) | 0.010 |
| Surgical revision | 29 (3.6) | 36 (4.5) | 1.25 (0.89–1.76) | 0.191 |
| Mechanical ventilation >48 h | 30 (3.8) | 54 (6.8) | 1.86 (1.05–3.28) | 0.032 |
| Inotropic drugs >48 h | 92 (11.5) | 134 (16.8) | 1.55 (1.17–2.06) | 0.003 |
| Mechanical ventilation time (h) | 16 (6–18) | 13 (11–17) | 1.00 (0.99–1.00) | 0.097 |
| Early (<6 h) extubation | 206 (25.8) | 66 (8.3) | 0.26 (0.20–0.33) | <0.0001 |
| ICU stay (days) | 1 (1–3) | 1 (1–3) | 1.01 (1.00–1.03 | 0.067 |
| Postoperative hospital stay (days) | 8 (7–11) | 8 (7–11) | 1.01 (1.00–1.02) | 0.244 |
Data are median (interquartile range) or number (%).
CI: confidence interval; ICU: intensive care unit; OR: odds ratio.
At the arrival in the ICU, the second-case group had a significantly higher arterial blood lactate level (1.92 ± 1.97 vs 1.64 ± 1.16 mmol/l, P = 0.001) and a larger proportion of patients with arterial blood lactates >3 mmol/l (12.6% vs 7.6%, P = 0.001), with a trend towards a lower pH (7.38 ± 0.13 vs 7.40 ± 0.06, P = 0.017).
A sensitivity analysis was conducted to better investigate the role of timing of surgery within the context of predicted mortality rate, operating surgeon and attending anaesthesiologist. For this last item, given the considerable turn-around in the 4 years period (30 different anaesthesiologists), the analysis was conducted for expertise classes, considering a class 1 (>10 years of clinical practice), class 2 (3–10 years of clinical practice) and class 3 (<3 years of clinical practice) stratification. There were no significant differences in the distribution of expertise classes between morning and afternoon case: class 1 anaesthesiologists attended 44.2% of the cases (43.7% morning cases and 44.7% afternoon cases); class 2 anaesthesiologists attended 16.3% of the cases (16.5% morning cases and 16.1% afternoon cases) and class 3 anaesthesiologists attended 39.5% of the cases (39.8% morning cases and 39.2% afternoon cases), for an overall P-value of 0.917. Table 3 reports the results of this sensitivity analysis. Overall, the total observed mortality rate was lower than the predicted value according to the EuroSCORE II. Six surgeons had a significantly lower mortality rate than expected, 3—a mortality rate equivalent to the expected and 1—a mortality rate higher than expected. A multivariable logistic regression analysis confirmed that after correction for the EuroSCORE II and the operating surgeon, the second case of the day carries a 61% higher major morbidity risk and a two-fold mortality risk with respect to the first case.
30-Day mortality sensitivity analysis
| Surgeon | Predicted mortalitya (%, 95% CI) | Observed mortality (%, 95% CI) | Observed versus predicted (significant at a P-value <0.05) | |
|---|---|---|---|---|
| A | 3.1 (2.7–3.6) | 0.8 (0–2.3) | Significantly lower | |
| B | 3.3 (2.9–3.7) | 2.6 (0–5.2) | Equivalent | |
| C | 4.3 (3.9–4.7) | 4.0 (2.2–5.8) | Equivalent | |
| D | 2.9 (2.2–3.5) | 1.7 (0–5.3) | Significantly lower | |
| E | 2.9 (2.1–3.7) | 3.8 (0–11.7) | Significantly higher | |
| F | 2.9 (2.4–3.4) | 2.1 (0–5.2) | Significantly lower | |
| G | 3.6 (2.8–4.4) | 1.2 (0–3.7) | Significantly lower | |
| H | 4.2 (3.8–4.8) | 4.8 (2.6–7.0) | Equivalent | |
| I | 3.1 (2.7–3.4) | 2.1 (0–4.5) | Significantly lower | |
| J | 2.8 (2.3–3.2) | 1.3 (0–3.9) | Significantly lower | |
| Total | 3.7 (3.6–3.9) | 3.2 (2.3–4.0) | Significantly lower | |
| Multivariable major morbidity analysis—all surgeons | ||||
| Factor | Regression coefficient | Odds ratio (95% CI) | P-Value | |
| Surgeon | −0.005 | 0.996 (0.98–1.01) | 0.553 | |
| Anaesthesiologist expertise class | −0.108 | 0.897 (0.75–1.05) | 0.240 | |
| EuroSCORE IIa | 0.118 | 1.125 (1.09–1.16) | 0.001 | |
| Second versus first case | 0.476 | 1.610 (1.16–2.23) | 0.004 | |
| Constant | −2.807 | |||
| Multivariable 30-day mortality analysis—all surgeons | ||||
| Factor | Regression coefficient | Odds ratio (95% CI) | P-Value | |
| Surgeon | 0.005 | 1.005 (0.98–1.03) | 0.695 | |
| Anaesthesiologist expertise class | −0.247 | 0.781 (0.57–1.07) | 0.130 | |
| EuroSCORE IIa | 0.126 | 1.134 (1.08–1.18) | 0.001 | |
| Second versus first case | 0.663 | 1.940 (1.07–3.52) | 0.029 | |
| Constant | −4.449 | |||
| Multivariable major morbidity analysis—surgeons operating both first and second cases | ||||
| Factor | Regression coefficient | Odds ratio (95% CI) | P-Value | |
| Surgeon | 0.001 | 1.000 (0.98–1.03) | 0.978 | |
| EuroSCORE IIa | 0.095 | 1.100 (1.06–1.14) | 0.001 | |
| Second versus first case | 0.717 | 2.048 (1.33–3.16) | 0.001 | |
| Constant | −2.816 | |||
| Multivariable 30-day mortality analysis—surgeons operating both first and second cases | ||||
| Factor | Regression coefficient | Odds ratio (95% CI) | P-Value | |
| Surgeon | 0.010 | 1.010 (0.97–1.05) | 0.611 | |
| EuroSCORE IIa | 0.112 | 1.118 (1.07–1.17) | 0.001 | |
| Second versus first case | 0.615 | 1.850 (0.91–3.75) | 0.088 | |
| Constant | −4.236 | |||
Corrected for 30-day mortality.
CI: confidence interval.
When the second case was performed by the same surgeon of the first case (this applies to the 2 surgeons with the highest level of activity, with 844 cases, 53% of the total activity), the logistic regression analysis showed that after correction for surgeon and EuroSCORE II, the major morbidity risk increased for the second case reaching an odds ratio of 2.1 (95% confidence interval 1.3–3.2, P = 0.001) whereas mortality decreased to an odds ratio of 1.85 (95% confidence interval 0.91–3.7, P = 0.088).
DISCUSSION
Our study demonstrates that, once adjusted for the potential confounders, the second cardiac surgery case of the day carries a 60% higher risk of major morbidity and twice the risk of 30-days mortality. The main determinants of this worse outcomes are LCOS and infections, leading to prolonged mechanical ventilation and ICU stay. At the arrival in the ICU, the second-case group has a larger rate of hyperlactatemia.
When the analysis was restricted to surgeons operating the first and second cases on the same day, the risk of major morbidity for the second case was double the risk for the first case.
The evidence of confounding factors
We think that a preliminary consideration should be deserved to the pre-matching differences between groups. Table 1 clearly shows an impressive number differences that certainly represent potential sources of bias when addressing the outcome data. In general, the second case carries a higher preoperative risk, that is however basically a patient-dependent risk plus a larger rate of redo and non-elective procedures. The type of operation is basically well balanced between first and second cases, whereas there is an imbalance in the operating surgeon, with the most experienced surgeons mainly operating the first case. This is probably reflected by the longer CPB and aortic cross-clamp times that however reflect even the larger rate of redo cases.
It is the policy of our Institution (and probably of others), when a senior surgeon has 2 cases scheduled on the same day, to place the most demanding case as second case. This is basically due to the need of operating without the burden of a second waiting case who, in case of prolongation of the first one, suffers the risk of being postponed to the following day.
Overall, the presence of so many patient-related and surgeon-related confounders requires adequate statistical procedures to assess comparable groups. The propensity matching provided us with 2 groups where only the timing of surgery was the independent variable, all the others being homogeneous. In addition, given the paramount importance of risk stratification (EuroSCORE II) and of the operating surgeon, we conducted a sensitivity analysis, which was confirmative of the general results. Within this analysis, when the surgeon operating the second case is the same of the first case, the major morbidity risk increases.
All these considerations are necessary when analysing the previous studies published on this topic. Although the majority of the studies addressed the problem of confounders with a propensity-matched approach [8–10, 14–16, 24], others did not [17, 18, 25, 26]. Few studies included the operating surgeon within the possible confounders [12, 15, 18], and no study investigated whether the second case was done by the first surgeon operating the first case. This last factor is of particular importance, once the possible role of fatigue is advocated as a determinant of different outcomes.
The major morbidity and mortality outcome
The majority of the studies [8–10, 12–16, 25, 26] found no differences between morning and afternoon surgery in terms of morbidity and mortality, one [24] found a better outcome for the afternoon cases and others [17, 18], in agreement with our results, for the morning cases.
Montaigne et al. [24] in a propensity-matched series of 596 cardiac surgery patients found more major adverse events in the morning case group; however, they selected a population at low predicted mortality risk (EuroSCORE II 1.8%) and restricted their analysis to aortic valve replacement due to stenosis, in patients with preserved left ventricular ejection fraction. Heller et al. [8] compared 248 morning cases to 124 night cases, founding no differences in morbidity and mortality. However, even after propensity matching, the night-time group had a lower operative risk, with significantly shorter anaesthesia and CPB time. Hijazi et al. [9] compared 2 large groups of morning and afternoon cases, adjusting for confounders with a logistic regression analysis, and found no differences in morbidity and mortality. However, in procedures at high risk (aortic valve replacement + coronary surgery + other procedure), the afternoon group had a mortality rate of 5.4% vs 1.6% for the morning group. In a large patient population (>3000 cases) propensity matched, Bianco et al. [10] found no differences in morbidity/mortality rate. Another large size (2720 cases) study, Götte et al. [12] found no differences in outcome between the morning and the afternoon cases; however, they restricted their population to isolated aortic valve replacement or aortic valve replacement + coronary surgery. A similar patient selection can be found in the study of Nemeth et al. [13] who did not find any morbidity/mortality difference between morning and afternoon cases, in patients receiving isolated coronary or aortic valve surgery. In this study, the deep sternal wound infection was however double in the afternoon cases (P = 0.054). Axtell et al. [14] excluded mitral valve surgery, combined operations, redo surgery. Of interest, in this last study, the afternoon case had again a significantly (P = 0.02) higher risk of deep sternal wound infection (odds ratio 8.3).
Kenney et al. [15] explored a Danish registry and compared about 1400 propensity matched morning versus afternoon cases. They did not found differences in mortality, although it was double in the afternoon group, nor in morbidity. However, the mechanical ventilation time was significantly longer in the afternoon group. Similar results are shown by Baik et al. [16], with a mortality rate of 2.7% in the afternoon group vs 1.5% in the morning group (P = 0.259). Coumbe et al. [17] found a higher mortality rate (6.2%) in patients operated after 4 pm than before (2.2%). However, the 2 groups were not matched (2624 vs 65 cases), with a higher rate of urgent/emergent surgery in the late case group. Finally, in a model accounting for the operating surgeon, Yount et al. [18] found a 2× higher absolute and risk-adjusted mortality in patients operated after 3 pm.
In this rather confused scenario, our study has the strengths of a 1:1 propensity matching with relatively large sample size; of the inclusion of the operating surgeons as potential confounders accounted for in the propensity matching process and adjusted for in the sensitivity analyses; the identification of afternoon cases done by the same surgeon of the first case; and finally, the exclusion of emergency cases only. In addition, we could collect data that were not considered in other studies and that may be useful for understanding the source of the worse morbidity/mortality outcome found in the second-case group in our study.
Where does the problem occur?
The analysis of data at the admission in the ICU offers useful insights to understand the nature of the problem(s) underlying the worse outcome of the second cases. Despite a similar type of surgery, and no differences in CPB time, aortic cross-clamp time, level of hypothermia on CPB, the second case reaches the ICU with a higher lactate level, and with a higher rate of hyperlactatemia. Early hyperlactatemia is associated with morbidity and mortality after cardiac surgery [27] and is generally associated with LCOS. In our series, the second-case group showed a higher rate of LCOS. Given the early pattern of hyperlactatemia, it is likely that it initiated during the late phases of surgery, after discontinuation from CPB. These phases, in the second surgical cases, occur quite late in the evening or even during night-time. Our hypothesis is that the surgical team (and namely the anaesthesiologist) could have underestimated the early signs of a LCOS, due to a combination of fatigue and willingness to reach the ICU and leave the care of the patient to the intensivist. This hypothesis was already raised by Yount et al. [18] who noticed that ‘physicians are more motivated to accomplish tasks at the end of a day or week to avoid after-hours care’. This hurriedness could be responsible even for another finding that our study shares with other previous studies [13, 14, 18], that is higher rate of infections in the second or afternoon case. One possible interpretation could be that the multiple shift changes (anaesthesia nurse and scrub nurse) occurring between the first and second cases increases the ‘traffic’ in the operating room, and therefore the risk of infection. In addition, a less cautious observation of asepsis rules in medication and patient manipulation and transfer could be a possible mechanism.
All these hypotheses related to operating room dependent factors are probably not enough to justify the worse outcome of the second case. Other factors, probably linked to the late arrival in the ICU, are probably playing a role. The first 6 postoperative hours, often referred to as the ‘golden hours’ [28], are nocturnal hours in the ICU for the second case. Overnight, the physician/patient ratio is considerably reduced at our Institution. Basically, it is 4 or 5 doctors for 26 beds during daytime, and 2 doctors only (plus other 2 on call) at night. In addition, during daytime all the staff is composed by intensivists and/or anaesthesiologists, whereas overnight there is 1 cardiac surgeon and 1 anaesthesiologist/intensivist. Under these circumstances, the overnight activities must take into account the reduced physician/patient ratio. Early extubation was only 8% overnight (25% during daytime), leading to prolonged mechanical ventilation and ICU stay. Mechanical ventilation represents per se a factor favouring respirator and manipulation-induced infections.
Overall, it is not easy to extrapolate the events or sequence of events leading to the worse outcome of the second cardiac surgery case. The chain of events certainly starts in the operating room and proceeds in the early hours after admission to the ICU, and the human factor is the main issue. Fatigue and loss of attention are the usual suspects, and their effect on the performance and the errors in the medical setting are well established [1].
Different authors hypothesized the role of nocturnal extubation as determinant of bad outcomes, with different conclusions [29, 30]. In our series, only 8% of the patients had a nocturnal extubation and they did not show morbidity or mortality differences.
Finally, other authors pointed out a possible role of circadian rhythms as determinants of different outcomes between morning and afternoon surgery. The only author showing a superiority of afternoon surgery [24] suggested that the factors usually increasing cardiac events in the early morning may favour bad outcomes in morning cardiac surgery.
Limitations
There are limitations in our study. The main is that we could not include in the analysis the possible role of the intensivist and the perfusionist as possible confounding factors.
The already mentioned strengths are the inclusion of the operating surgeon in the propensity matching, the analysis restricted to surgeons doing both the first and second cases, and the inclusion of data at the arrival in the ICU.
CONCLUSION
Our study shows that the second cardiac surgery case has a worse outcome, regardless of the patient profile and complexity of the procedure. This suggests that it is not wise to place the most demanding cases as second cases, when they are exposed to an increased morbidity and mortality due to fatigue, loss of attention and hurriedness in the operating room and decreased human resources in the ICU. These findings have been discussed internally at our institution, and efforts are presently applied to avoid treating very difficult patients as second cases.
Funding
The study had no specific funding. IRCCS Policlinico San Donato, a Clinical Research Hospital, is partially funded by the Italian Ministry of Health.
Conflict of interest: none declared.
DATA AVAILABILITY
The original dataset supporting the findings of this study will be deposited in the public repository Zenodo and accessible upon a reasonable request.
Author contributions
Marco Ranucci: Conceptualization; Data curation; Formal analysis; Writing—original draft; Writing—review & editing. Stefano Casalino: Conceptualization; Investigation; Supervision; Writing—original draft; Writing—review & editing. Alessandro Frigiola: Data curation; Supervision; Writing—review & editing. Marco Diena: Data curation; Supervision; Writing—review & editing. Alessandro Parolari: Data curation; Supervision; Writing—review & editing. Sara Boveri: Formal analysis. Lorenzo Menicanti: Data curation; Supervision; Writing—review & editing. Carlo De Vincentiis: Data curation; Supervision; Writing—review & editing.
Reviewer information
European Journal of Cardio-Thoracic Surgery thanks Frank A. Baciewicz Jr, Panagiotis Artemiou, Alberto Guido Pozzoli and the other, anonymous reviewer(s) for their contribution to the peer review process of this article.
REFERENCES
ABBREVIATIONS
- ASMD
Absolute standardized mean difference
- CPB
Cardiopulmonary bypass
- ICU
Intensive care unit
- LCOS
Low cardiac output state
