


Abstract

Low forced expiratory volume in 1 s (FEV1) and elevated N-terminal pro-B-type natriuretic peptide (NT-Pro-BNP) have been individually associated with poor outcomes after transcatheter aortic valve replacement (TAVR). We hypothesized a combination of the 2 would provide prognostic indication after TAVR.
We categorized 871 patients who received TAVR from 2008 to 2018 into 4 groups according to baseline FEV1 (<60% or ≥60% predicted) and NT-Pro-BNP (<1601 or ≥1601 pg/ml): group A (n = 312, high FEV1, low NT-Pro-BNP), group B (n = 275, high FEV1, high NT-Pro-BNP), group C (n = 123 low FEV1, low NT-Pro-BNP) and group D (n = 161, low FEV1, high NT-Pro-BNP). The primary end point was survival at 1 and 5 years.
Patients in group A had more severe aortic stenosis and achieved the best long-term survival at 1 [93% (95% CI: 90–96)] and 5 [45.3% (95% CI: 35.4–58)] years. Low FEV1 and high NT-Pro-BNP (group D) patients had more severe symptoms, higher Society of Thoracic Surgeons predicted risk of operative mortality, lower ejection fraction and aortic valve gradient at baseline. Patients in group D had the worst survival at 1 [76% (95% CI: 69–83)] and 5 years [13.1% (95% CI: 7–25)], hazard ratio compared to group A: 2.29 (95% CI: 1.6–3.2, P < 0.001) with 25.7% of patients in New York Heart Association class III–IV. Patients in groups B and C had intermediate outcomes.
The combination of FEV1 and NT-Pro-BNP stratifies patients into 4 groups with distinct risk profiles and clinical outcomes. Patients with low FEV1 and high NT-Pro-BNP have increased comorbidities, poor functional outcomes and decreased long-term survival after TAVR.
INTRODUCTION
Chronic lung disease (CLD) is common in patients treated with transcatheter aortic valve replacement (TAVR). Relieving the aortic stenosis in patients with severe CLD, however, may not provide symptomatic relief, improvement in quality of life or long-term survival benefit [1, 2]. Markers of CLD such as forced expiratory volume in 1 s (FEV1) have been used independently to predict outcomes after TAVR in patients with severe aortic valve stenosis.
N-terminal pro-B-type natriuretic peptide (NT-Pro-BNP), a cardiac hormone released in response to ventricular expansion and wall stress, is associated with severity of the aortic stenosis, degree of compensatory left ventricular hypertrophy and outcomes after TAVR [3, 4]. Since the interaction between FEV1 and NT-Pro-BNP with outcomes after TAVR has not been previously evaluated, we proposed this study to identify patients with aortic stenosis and CLD who would have limited benefit from TAVR. We hypothesized that the combination of pre-procedure FEV1 and NT-Pro-BNP would risk stratify patients with severe aortic stenosis and CLD predicting short- and long-term outcomes after TAVR.
MATERIALS AND METHODS
Study population
The Mayo Clinic Institutional Review Board approved this study (IRB 006414—31 July 2021). Patient consent requirement was waived as the study was deemed a minimal risk retrospective study.
Adult patients with severe aortic stenosis treated with TAVR at our institution from November 2008 to January 2018 who had preprocedural FEV1 and NT-Pro-BNP measurements within 3 months of the procedure were included in the study (Supplementary Material, Consort Diagram). The baseline characteristic of patients excluded from the analysis because of the absence of pre-procedure FEV1, NT-Pro-BNP or both is displayed in Supplementary Material, Table.
Patient clinical characteristics and outcome data were obtained from the institution medical records and Cardiac Surgery and Transcatheter Valve Therapy (TVT) databases. CLD was categorized based on definitions set forth in the Society of Thoracic Surgeons (STS) Adult Cardiac Surgery database (Chicago, IL, USA).
Patients were stratified into 4 groups according to baseline FEV1 (<60% or ≥60% predicted) and median baseline NT-Pro-BNP (<1601 or ≥1601 pg/ml): group A (n = 312, high FEV1, low NT-Pro-BNP), group B (n = 275, high FEV1, high NT-Pro-BNP), group C (n = 123 low FEV1, low NT-Pro-BNP) and group D (n = 161, low FEV1, high NT-Pro-BNP). We selected 60% predicted FEV1 to separate patients with low and high FEV1 to match the STS CLD categories. Patients with moderate and severe CLD are included in the low FEV1 category while patients mild or no CLD are included in the high FEV1 category. We selected the median NT-Pro-BNP (1601 pg/ml) to separate patients with low and high NT-Pro-BNP. We also performed sensitivity analysis using (i) the median for both FEV1 and NT-Pro-BNP, (ii) the optimal cut-offs by maximizing the log-rank statistic for long-term survival and (iii) only the transfemoral access patients using 60% FEV1 and median NT-Pro-BNP among the transfemoral group as cut-offs.
Outcomes
The primary end point was 1- and 5-year survival. Secondary outcomes included (i) operative mortality (death within 30 days of the procedure or before discharge form the hospital), (ii) New York Heart Association (NYHA) functional class at 30 days and 1 year, (iii) major adverse cardiac and cerebrovascular events at 30 days (any death, myocardial infarction, stroke or reinterventions) and (iv) a composite outcome of health benefit at 1 year defined as being alive and in NYHA class I or II.
Follow-up and vital status
For the primary outcome of survival, we defined the censored survival time from TAVR to the date of death or to the date of last contact alive, whichever was first. Survival status was ascertained via linkage with LexisNexis® Accurint® (New York, NY, USA). Death was verified for patients in whom a death date was returned, otherwise patients were considered alive and were censored 2 weeks prior to the Accurint search date. For patients who could not be linked, survival status was ascertained by reviewing the hospital’s electronic medical record system and the department’s survey tracking database that surveys patient at 1, 2, 5, 10, 15 and 20 years after procedures.
NYHA functional class at 30 days and 1 year was obtained during the routine clinical follow-up visit after TAVR or by contacting the referring providers and entered in the institutional TVT database.
Statistical analysis
Descriptive statistics used to summarize the cohort included frequencies and percentages for categorical variables and medians (interquartile ranges) or mean ± standard deviation for continuous variables as appropriate. Characteristics between the 4 groups were compared using analysis of variance for normally distributed data, Kruskal–Wallis test for skewed data, chi-square test for categorical data with expected counts <5 in 80% of the cells and Fisher’s exact test when the expected cell counts were <5 in 20% of the cells. Survival estimates at 1 and 5 years were based on the Kaplan–Meier method. Proportional hazards models were used to assess baseline characteristics with survival. To account for the different baseline characteristics between the groups when assessing long-term survival, we considered variables used in the risk model developed from the STS/American College of Cardiology TVT registry to predict hospital mortality after TAVR with the exception of CLD as it was used to determine our study groups [5]. These factors included age, sex, race, NYHA class IV, dialysis, preoperative creatinine, transfemoral approach, pre-procedure inotropes, elective status, mechanical assist device, cardiogenic shock and resuscitation, although the last 3 were not included in our models as there were few subjects that met these criteria. Three different multivariable models were fit, 1 with our grouping variable as a main predictor, 1 using high versus low FEV1 (i.e. group A and group B versus group C and group D) as the main predictor, and 1 with high versus low NT-Pro-BNP (i.e. group B and group D versus group A and group C) as our main predictor. Analyses were carried out in R version 3.6.2 (Vienna, Austria).
RESULTS
Baseline characteristics
There were 871 patients included in the study. CLD was present in 60% of the patients (mild in 24%, moderate in 15% and severe in 21%) and 9.7% of the patients required home oxygen. Predicted FEV1 of 60% and the median NT-Pro-BNP (1601 pg/ml) were used to stratify patients in the 4 groups. Figure 1 shows the distribution of predicted FEV1 and NT-Pro BNP for all patients while Table 1 shows the baseline characteristic of each group. Patients in group A (high FEV1, low NT-Pro-BNP) had fewer comorbidities [STS predicted risk of operative mortality (PROM): 5.4%], the highest left ventricular ejection fraction (LVEF) and the lowest rate of patients in NYHA class III-IV and home oxygen use. Most patients had no or mild CLD. Patients in group B (high FEV1, high NT-Pro-BNP) had intermediate comorbidities (STS PROM of 7.8%). They also had lower LVEF with 78.5% of patients in NYHA class III–IV. Like in group A, most patients had no or mild CLD and only 6.1% required home oxygen. Patients in group C (low FEV1, low NT-Pro-BNP) were more symptomatic (85% in NYHA class III–IV) and 17% requiring home O2 despite their LVEF of 60%. Among them, 94% had moderate or severe CLD. Group D (low FEV1, high NT-Pro-BNP) was the highest risk group with the highest STS PROM (11.6%), higher rates of NYHA class III–IV (94%) and home oxygen and lower LVEF. In this group, 93% had moderate or severe CLD.
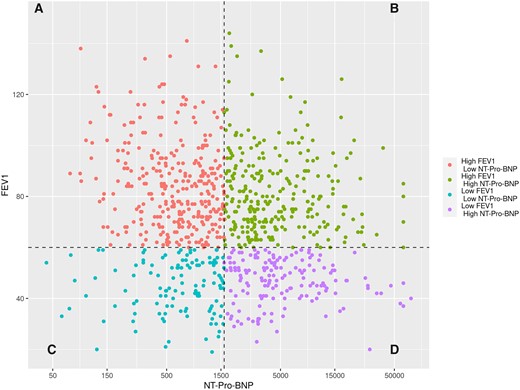
Scatterplot showing the distribution of FEV1 and NT-Pro-BNP (natural logarithmic scale) for all patients. Each patient is represented by a data point with respective FEV1 and NT-Pro-BNP. Patients were stratified into 4 groups according to baseline FEV1 (<60% or ≥60% predicted) and NT-Pro-BNP (<1601 or ≥1601 pg/ml, median): group A (high FEV1, low NT-Pro-BNP), group B (high FEV1, high NT-Pro-BNP), group C (low FEV1, low NT-Pro-BNP) and group D (low FEV1, high NT-Pro-BNP). FEV1: forced expiratory volume in 1 s; NT-Pro-BNP: N-terminal pro-B-type natriuretic peptide.
Baseline clinical characteristics and echocardiographic variables stratified by preoperative predicted forced expiratory volume in 1 s and N-terminal pro-B-type natriuretic peptide
| Overall (n = 871) | Group A | Group B | Group C | Group D | P-Value | |
|---|---|---|---|---|---|---|
| High FEV1 | High FEV1 | Low FEV1 | Low FEV1 | |||
| Low NT-Pro-BNP (n = 312) | High NT-Pro-BNP (n = 275) | Low NT-Pro-BNP (n = 123) | High NT-Pro-BNP (n = 161) | |||
| Demographics | ||||||
| Age (years), mean ± SD | 81 ± 8 | 81 ± 8 | 83 ± 7 | 78 ± 8 | 80 ± 9 | <0.001a |
| Female, n (%) | 343 (39.4) | 133 (42.6) | 110 (40) | 34 (27.6) | 66 (41) | 0.034b |
| BMI (kg/m2), mean ± SD | 29.7 ± 6.7 | 30.5 ± 6.6 | 28.6 ± 6.4 | 30.6 ± 7.4 | 29.2 ± 6.6 | 0.002a |
| FEV1 predicted (%), mean ± SD | 71 ± 22.8 | 84.6 ± 17 | 81.5 ± 16 | 44.9 ± 10.3 | 46.7 ± 8.6 | <0.001a |
| NT-Pro-BNP (pg/ml), median (IQR) | 1601 (666–3985) | 645.5 (368–1,039) | 3,585 (2,464–8,106) | 732 (441–1,238) | 4,352 (2,862–8,987) | <0.00c |
| STS PROM (%), median (IQR) | 7.4 (4.8–10.9) | 5.4 (4.0–7.9) | 7.8 (5.6–10.6) | 7.4 (4.9–10.5) | 11.7 (7.9–16.0) | <0.001c |
| NYHA functional class, n (%) | ||||||
| I | 11 (1.3) | 4 (1.3) | 5 (1.9) | 1 (0.8) | 1 (0.6) | <0.001d |
| II | 172 (19.9) | 93 (30.0) | 53 (19.6) | 17 (13.9) | 9 (5.6) | |
| III | 553 (64.1) | 194 (62.6) | 169 (62.6) | 87 (71.3) | 103 (64.0) | |
| IV | 127 (14.7) | 19 (6.1) | 43 (15.9) | 17 (13.6) | 48 (29.8) | |
| Home oxygen, n (%) | 82 (9.7) | 11 (3.6) | 16 (6.1) | 20(16.7) | 35 (22.2) | <0.001b |
| Smoker, n (%) | 102 (11.8) | 31 (9.9) | 25 (9.3) | 21 (17.4) | 25 (15.5) | 0.038b |
| DLCO (ml/min/mmHg), mean ± SD | 13.8 ± 5.5 | 15.9 ± 6.2 | 13.7 ± 4.1 | 12.2 ± 4.5 | 10.9 ± 5.1 | <0.001a |
| Chronic lung disease, n (%) | ||||||
| None | 280 (40.4) | 152 (62.6) | 117 (56.8) | 3 (2.8) | 8 (5.9) | <0.001d |
| Mild | 168 (24.2) | 80 (32.9) | 85 (41.3) | 1 (0.9) | 2 (1.5) | |
| Moderate | 102 (14.7) | 10 (4.1) | 2 (1.0) | 37 (34.3) | 53 (39.0) | |
| Severe | 143 (20.6) | 1 (0.4) | 2 (1.0) | 67 (62.0) | 73 (53.7) | |
| Cardiac risk factors | ||||||
| Diabetes mellitus, n (%) | 316 (36.4) | 123 (39.5) | 83 (30.1) | 58 (47.2) | 52 (32.3) | 0.004b |
| Hypertension, n (%) | 787 (91.1) | 279 (90.6) | 260 (94.5) | 105 (86.1) | 143 (89.9) | 0.042b |
| Haemodialysis, n (%) | 17 (2) | 1 (0.3) | 8 (2.9) | 0 (0.0) | 8 (5.0) | <0.001e |
| Cerebrovascular disease, n (%) | 222 (26.7) | 77 (25.8) | 83 (30.1) | 24 (20.5) | 38 (24.7) | 0.095b |
| Coronary artery disease, n (%) | 579 (67.2) | 199 (64.8) | 193 (71.0) | 78 (64.5) | 109 (67.7) | 0.398b |
| Previous CABG, n (%) | 273 (31.4) | 93 (29.8) | 90 (32.8) | 40 (32.5) | 50 (31.2) | 0.872b |
| Previous PCI, n (%) | 367 (43.1) | 121 (40.1) | 124 (46.1) | 52 (42.3) | 70 (44.3) | 0.523b |
| Previous myocardial infarction, n (%) | 251 (29.8) | 74 (24.4) | 93 (35.2) | 34 (28.6) | 50 (32.1) | 0.039b |
| Previous pacemaker, n (%) | 144 (16.7) | 35 (11.2) | 59 (21.7) | 18 (14.9) | 32 (20.1) | 0.004b |
| Atrial fibrillation/flutter, n (%) | 294 (35.6) | 62 (21.2) | 117 (45) | 41 (34.2) | 74 (48.4) | <0.001b |
| Peripheral vascular disease, n (%) | 483 (56.2) | 164 (53.6) | 154 (56.6) | 72 (59.5) | 93 (57.8) | 0.669b |
| Baseline echocardiography | ||||||
| LVEF (%), mean ± SD | 56.5 ± 13.4 | 61.8 ± 8.8 | 51.3 ± 15.1 | 60.2 ± 10.1 | 52.1 ± 15 | <0.001a |
| Mean aortic valve gradient (mmHg), mean ± SD | 45.3 ± 13.5 | 46.7 ± 11.9 | 44.8 ± 15.3 | 43.7 ± 12 | 44.8 ± 14.3 | 0.133a |
| Peak aortic valve velocity (m/s), mean ± SD | 4.3 ± 0.7 | 4.3 ± 0.6 | 4.2 ± 0.7 | 4.2 ± 0.6 | 4.2 ± 0.7 | 0.013a |
| Aortic valve area (cm2), mean ± SD | 0.9 ± 0.3 | 0.9 ± 0.2 | 0.8 ± 0.3 | 0.9 ± 0.2 | 0.9 ± 0.3 | 0.023a |
| Systolic PA pressure (mmHg), mean ± SD | 44.0 ± 15.0 | 37 ± 10.5 | 47.2 ± 16.3 | 41.7 ± 12.5 | 51.8 ± 15.2 | <0.001a |
| Access | ||||||
| Transfemoral access, n (%) | 622 (72.7) | 234 (77.0) | 185 (68.3) | 85 (70.2) | 118 (74.2) | 0.11b |
Linear model ANOVA.
Pearson's chi-square test.
Kruskal–Wallis rank-sum test.
Trend test for ordinal variables.
Fisher's exact test for count data.
ANOVA: analysis of variance; BMI: body mass index; CABG: coronary artery bypass graft surgery; DLCO: diffusing capacity of the lungs for carbon monoxide; FEV1: forced expiratory volume in 1 s; IQR: interquartile range; LVEF: left ventricular ejection fraction; NT-Pro-BNP: N-terminal pro-B-type natriuretic peptide; NYHA: New York Heart Association; PA: pulmonary artery; PCI: percutaneous coronary intervention; PROM: predicted risk of operative mortality; SD: standard deviation; STS: Society of Thoracic Surgeons.
Primary outcome
Survival at 1 and 5 years was best for patients in group A and worst for patients in group D (Table 2 and Fig. 2). Survival for groups B and C was between groups A and D. Importantly, only 13.1% of patients in group D (low FEV1, high NT-Pro-BNP) were alive at 5 years. The median follow-up was 2.42 years (interquartile range 1.23–4.43).
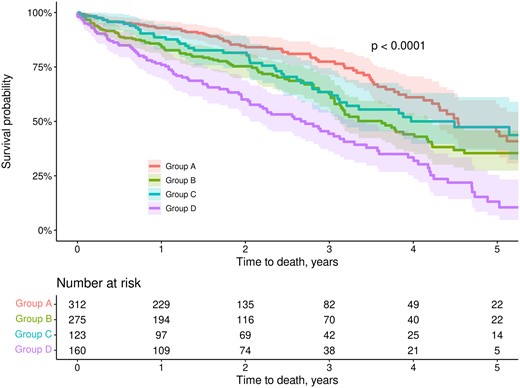
Kaplan–Meier survival curves at 5 years stratified by predicted FEV1 and NT-Pro-BNP. Shaded areas represent 95% confidence intervals. Abbreviations and groups as in Fig. 1. FEV1: forced expiratory volume in 1 s; NT-Pro-BNP: N N-terminal pro-B-type natriuretic peptide.
Operative, 1- and 5-year outcomes stratified by preoperative predicted forced expiratory volume in 1 s and N-terminal pro-B-type natriuretic peptide
| Overall (n = 871) | Group A | Group B | Group C | Group D | P-Value | |
|---|---|---|---|---|---|---|
| High FEV1 | High FEV1 | Low FEV1 | Low FEV1 | |||
| Low NT-Pro-BNP (n = 312) | High NT-Pro-BNP (n = 275) | Low NT-Pro-BNP (n = 123) | High NT-Pro-BNP (n = 161) | |||
| Operative outcomes | ||||||
| All-cause mortality, n (%) | 19 (2.4%) | 3 (1.1) | 7 (2.8) | 2 (1.8) | 7 (4.5) | 0.153a |
| NYHA functional class at 30 days, n (%) | ||||||
| I | 273 (44) | 124 (53.4) | 82 (44.3) | 30 (34.5) | 37 (31.9) | <0.001b |
| II | 247 (39.8) | 84 (36.2) | 80 (43.2) | 35 (40.2) | 48 (41.4) | |
| III | 84 (13.5) | 19 (8.2) | 21 (11.4) | 21 (24.1) | 23 (19.8 | |
| IV | 16 (2.6) | 5 (2.2) | 2 (1.1) | 1 (1.1) | 8 (6.9) | |
| Stroke, n (%) | 7 (0.8) | 3 (1) | 0 (0) | 2 (1.6) | 2 (1.3) | 0.286c |
| MACCE, n (%) | 53 (6.1) | 19 (6.1) | 15 (5.5) | 7 (5.7) | 12 (7.5) | 0.861c |
| Echocardiography at 30 days | ||||||
| LVEF (%), mean ± SD | 57.3 ± 12.8 | 62 ± 9 | 52.9 ± 13.9 | 60.7 ± 10.3 | 53.2 ± 14.6 | <0.001d |
| Mean aortic valve gradient (mmHg), mean ± SD | 12 ± 5.6 | 12.4 ± 5.6 | 11.2 ± 4.7 | 12.5 ± 6.4 | 12.2 ± 6.5 | 0.04d |
| Peak aortic valve velocity (m/s), mean ± SD | 2.3 ± 0.8 | 2.4 ± 0.8 | 2.3 ± 0.9 | 2.4 ± 0.5 | 2.3 ± 0.6 | 0.201d |
| Aortic valve area (cm2), mean ± SD | 2.2 ± 0.7 | 2.1 ± 0.6 | 2.1 ± 0.6 | 2.3 ± 0.7 | 2.2 ± 0.7 | 0.204d |
| 1-Year outcomes | ||||||
| Survival (%), estimate (95% CI) | 87 (84–89) | 92.9 (90–96) | 84.9 (80.6–89.5) | 88.6 (83–94.6) | 76 (69.4–83.1) | <0.001 |
| NYHA functional class, n (%) | ||||||
| I | 192 (49.2) | 92 (60.9) | 56 (47.1) | 21 (38.9) | 23 (34.8) | 0.011b |
| II | 140 (35.9) | 43 (28.5) | 48 (40.3) | 23 (42.6) | 26 (39.4) | |
| III | 50 (12.8) | 13 (8.6) | 14 (11.8) | 9 (16.7) | 14 (21.2) | |
| IV | 8 (2.1) | 3 (2.0) | 1 (0.8) | 1 (1.9) | 3 (4.5) | |
| Health benefit at 1 year, n (%) | 330 (66.8) | 135 (78.9) | 103 (66.0) | 44 (66.7) | 48 (47.5) | <0.001c |
| Long-term outcomes | ||||||
| Survival at 5 years (%), estimate (95% CI) | 35.6 (30.6–41.5) | 45.3 (35.4–58) | 35.4 (27.4–45.8) | 47.4 (36.7–61) | 13.1 (6.8–25.4) | <0.001 |
Health benefit: defined as being alive and in NYHA class I or II.
Fisher's exact test for count data.
Trend test for ordinal variables.
Pearson's chi-square test.
Linear model ANOVA.
ANOVA: analysis of variance; CI: confidence interval; FEV1: forced expiratory volume in 1 s; LVEF: left ventricular ejection fraction; MACCE: major adverse cardiovascular and cerebrovascular event(s); NT-Pro-BNP: N-terminal pro-B-type natriuretic peptide; NYHA: New York Heart Association; SD: standard deviation.
By univariate analysis, each FEV1-NT-Pro-BNP group increased the hazard of mortality compared to group A (Fig. 3). By multivariate analysis, only group D was different from group A. In separate models, high NT-Pro-BNP (group B and group D versus group A and group C) increased the hazard of mortality while high FEV1 (group A and group B versus group C and group D) was protective (Fig. 3).
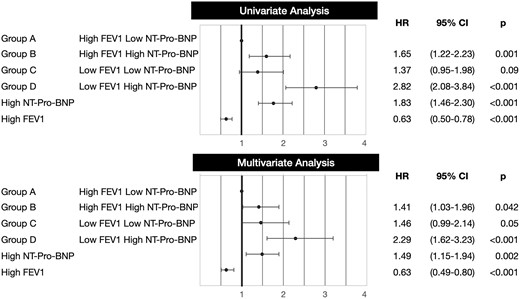
Forest plot showing hazard ratio (HR) of mortality by univariate and multivariate analyses using 3 different main predictors: (i) our grouping variable (groups A–D), (ii) NT-Pro-BNP (high, 1601 pg/ml or above versus low, 1600 pg/ml or below), (iii) FEV1 (high, 60% predicted or above versus low, 59% predicted or below). Abbreviations and groups as in Fig. 1. CI: confidence interval; FEV1: forced expiratory volume in 1 s; NT-Pro-BNP: N-terminal pro-B-type natriuretic peptide.
Sensitivity analyses by using different cut-offs for FEV1 and NT-Pro-BNP to define groups A–D and by looking exclusively at patients with transfemoral access are presented in the Supplementary Material. The long-term survival of each group (A, B, C, D) using different cut-offs was similar as of the survival of the respective group (A, B, C, D) in the main analysis.
Secondary outcomes
Operative mortality and the rate of major adverse cardiovascular and cerebrovascular events were not significantly different among the groups (Table 2). FEV1 and NT-Pro-BNP did not significantly impact operative and 30-day outcomes.
NYHA class at baseline, at 30 days and at 1 year is shown in Fig. 4 and Tables 1 and 2. Most patients improved their NYHA class at 30 days and at 1 year. At 30 days and 1 year, the proportion of patients in NYHA class III–IV had decreased to 16.1% and 25%. It was lowest in groups A and B and highest in groups C and D.
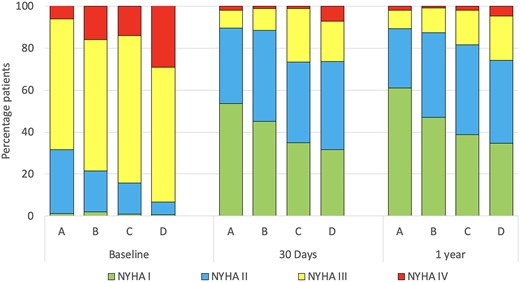
NYHA functional class at baseline, 30 days and 1 year stratified by predicted FEV1 and NT-Pro-BNP. Abbreviations and groups as in Fig. 1. FEV1: forced expiratory volume in 1 s; NT-Pro-BNP: N-terminal pro-B-type natriuretic peptide.
Health benefit at 1 year defined as being alive and in NYHA class I or II was achieved in 66.8% patients. It was higher in group A (78.9%) and lowest in group D (47.5%), while groups B and C had intermediate benefits (Table 2).
DISCUSSION
This study combined a spirometric marker of airway obstruction (FEV1) and a serum biomarker of aortic stenosis severity (NT-Pro-BNP) to stratify patients with severe aortic stenosis in 4 clinical groups. Each group had unique risk profiles, comorbidities and outcomes. Patients with low predicted FEV1 and high NT-Pro-BNP are a high-risk group with a high prevalence of comorbidities, poor functional improvement and decreased long-term survival. TAVR provides limited benefits to these patients.
In aortic stenosis, NT-Pro-BNP is released in response to increased left ventricular afterload, wall stress and ventricular dysfunction [3, 4, 6, 7]. Patients with elevated NT-Pro-BNP are more symptomatic, have more comorbidities, and have worse prognosis after treatment [3, 4, 6–8]. In the current study, patients with elevated NT-Pro-BNP (groups B and D) had increased comorbidities as reflected by higher STS PROM and more advanced myocardial disease with lower LVEF. The combination of these 2 factors results in a decreased long-term survival after TAVR [3, 9]. A NT-Pro-BNP cut-off of 1800 pg/ml has been recommended to identify heart failure in patients older than 75 years of age [10, 11]. In this study, we selected the median NT-Pro-BNP value (1601 pg/ml) to stratify patients in high and low NT-Pro-BNP which is below the recommended cut-off value. As a result, the clinical characteristics and outcomes of groups B and D (high NT-Pro-BNP) may have been better than if a higher cut-off value had been used. While sensitivity analysis demonstrated that the best cut-off to maximize the concordance between NT-Pro-BNP and survival was 1956 pg/ml, the long-term survival of the 4 groups was similar using this cut-off as the one in the main analysis (Supplementary Material).
FEV1 is an index of airway obstruction severity in pulmonary disease. Its ability to discriminate long-term outcomes in patients with COPD is improved when it is combined with other indexes of functional impairment [12]. Likewise, combining FEV1 and NT-Pro-BNP may improve the prediction accuracy for patients with aortic stenosis compared to FEV1 alone or CLD severity alone. In the current study, we selected 60% predicted FEV1 to separate patients with low and high FEV1. Therefore, patients with low predicted FEV1 (C and D) have moderate or severe STS CLD while patients with high FEV1 (A and B) have mild or no STS CLD.
We have previously shown that while most patients with moderate or severe CLD noted improvements in NYHA functional class, quality of life and health status after TAVR, the proportion of patients who remain in NYHA class III and IV was also higher than those with mild or no CLD [13]. In the current study, patients with low FEV1 (moderate or severe CLD, groups C and D) were more symptomatic at baseline and had less symptomatic improvement after TAVR highlighting the contribution of airway obstruction to the symptoms. Expanded into this concept, when we used a modified definition of health benefit at 1 year (alive and with NYHA class I or II), only 48% of patients in group D and 67% of patients in group C had health benefits at 1 year. The addition of NT-Pro-BNP contributes only marginally to discriminate symptomatic improvement between both groups. This is not surprising since previous studies have shown that baseline NT-Pro-BNP is not a good predictor of symptomatic improvement after TAVR [14]. Rather, reduction in NT-Pro-BNP levels after TAVR has been associated with functional improvement [15].
Previous studies have shown that moderate and severe CLD compromised long-term survival after TAVR compared to patients with mild or none [1, 13]. The current study confirmed those findings.
It also described that NT-Pro-BNP contributes to discriminate survival among patients with moderate and severe CLD (groups C and D): those with elevated NT-Pro-BNP have a substantially worse long-term survival (group D). In a recent meta-analysis, Takagi et al. [4] showed that high pre-TAVR NT-Pro-BNP was associated with mid- and long-term mortality.
Similar to FEV1 in COPD, studies have shown that the combination of NT-Pro-BNP with other biomarkers results in a stronger association with mortality in aortic stenosis than NT-Pro-BNP alone [6, 15]. In the current study, the combination of FEV1 (a marker of airway obstruction) and NT-Pro-BNP (a biomarker of aortic stenosis severity and myocardial dysfunction) [7] contributes to risk stratification of patients with aortic stenosis and CLD in 4 discrete groups with unique comorbidities and outcomes. Low FEV1 and high NT-Pro-BNP identify a group of patients with dismal long-term survival and limited functional improvement. The heart team should consider these prognostic implications and involve patients in a shared decision-making process before offering TAVR to these patients. While spirometry is no longer routinely used in the preprocedural evaluation of TAVR patients, this study supports its selective use in patients with the history of CLD.
Limitations
This study has several limitations. First, it is a retrospective study where the selection bias for treatment and the single-centre nature of the study makes the generalizations of its findings less applicable to the general population. Second, this study was performed over 10 years. Therefore, it includes (i) the learning curve with patient selection and with the procedure, (ii) early generation TAVR devices and (iii) access route that is no longer used. Sensitivity analysis demonstrated that the prognostic implications of the 4 groups are maintained when the analysis is limited to only transfemoral access (Supplementary Material, Fig. S2.3). While we cannot underestimate the impact of the learning curve and old TAVR devices on the outcomes, they likely impacted all the groups similarly and as such the hazard of mortality remains constant based on the TAVR procedural date (Supplementary Material, Fig. S3). Third, the functional improvement was only evaluated using NYHA functional class at 30 days and at 1 year. Unfortunately, no other indicators of functional status such as quality of life indexes were available to complement the NYHA assessment. Fourth, only FEV1 was used for the evaluation of lung disease leaving restrictive and diffusive lung diseases undetected. Fifth, the cut-offs used for FEV1 and NT-Pro-BNP were selected a priori to be based on the STS CLD definitions and the median NT-Pro-BNP of our cohort. The overall results and discriminatory power are maintained when other cut-offs are used (Supplementary Material, Sensitivity analysis). While selection of even higher NT-pro-BNP and lower percentage predicted FEV1 cut-offs may have resulted in worse outcomes for patients in group D, the use of the established STS cut-off for moderate CLD severity and the median for NT-Pro-BNP increase their clinical utility as they are parameters already in use by most clinicians.
CONCLUSIONS
Combining NT-Pro-BNP and FEV1 improves risk stratification of CLD patients with aortic stenosis considered for TAVR. High NT-Pro-BNP and low FEV1 identify high-risk aortic stenosis patients with increased comorbidities, poor functional outcomes and substantially decreased long-term survival after TAVR. Compared to the other groups, these patients achieved limited clinical benefit from TAVR.
SUPPLEMENTARY MATERIAL
Supplementary material is available at EJCTS online.
Conflict of interest: none declared.
DATA AVAILABILITY
The data underlying this article will be shared on reasonable request to the corresponding author.
Author contributions
Juan A. Crestanello: Conceptualization; Data curation; Formal analysis; Investigation; Methodology; Project administration; Supervision; Validation; Visualization; Writing—original draft; Writing—review & editing. Kevin L. Greason: Formal analysis; Validation; Writing—review & editing. Jessey Mathew: Data curation; Formal analysis; Investigation; Methodology; Software; Validation; Visualization; Writing—original draft. Mackram F. Eleid: Formal analysis; Validation; Writing—review & editing. Vuyisile T. Nkomo: Formal analysis; Validation; Writing—review & editing. Charanjit S. Rihal: Formal analysis; Validation; Writing—review & editing. Gabor Bagameri: Formal analysis; Validation; Writing—review & editing. David R. Holmes: Formal analysis; Validation; Writing—review & editing. Sorin V. Pislaru: Formal analysis; Validation; Writing—review & editing. Gurpreet S. Sandhu: Formal analysis; Validation; Writing—review & editing. Alexander T. Lee: Data curation; Formal analysis; Investigation; Methodology; Software; Validation; Visualization; Writing—original draft. Katherine S. King: Data curation; Formal analysis; Investigation; Methodology; Validation; Visualization; Writing—original draft. Mohamad Alkhouli: Formal analysis; Validation; Writing—review & editing.
Reviewer information
European Journal of Cardio-Thoracic Surgery thanks Jesus E Pino, Roman Gottardi and the other, anonymous reviewer(s) for their contribution to the peer review process of this article.
REFERENCES
ABBREVIATIONS
- CLD
Chronic lung disease
- FEV1
Forced expiratory volume in 1 s
- LVEF
Left ventricular ejection fraction
- NT-Pro-BNP
N-terminal pro-B-type natriuretic peptide
- NYHA
New York Heart Association
- PROM
Predicted risk of operative mortality
- STS
Society of Thoracic Surgeons
- TAVR
Transcatheter Aortic Valve Replacement
- TVT
Transcatheter Valve Therapy
