


Abstract

Contemporary data on the prognostic impact of pre-existing left or right bundle branch block on clinical outcomes after aortic valve (AV) replacement are limited. The aim of this study was to evaluate the impact of pre-existing bundle branch block on clinical outcomes in patients undergoing AV replacement.
Data from patients who underwent AV replacement surgery between 2004 and 2020 were obtained from our departmental database.
Of the 2704 study patients, 203 (7.5%) had pre-existing bundle branch block and 2501 (92.5%) had normal atrioventricular conduction. The mean age was 68 (13) years, 1697 (63%) were male and 683 (25%) had a unicuspid or bicuspid AV. The in-hospital mortality rate was higher in patients with pre-existing bundle branch block compared to those without on admission (5.9% vs 2.9%, P = 0.032), and more frequent in patients with left compared with right bundle branch block (11.9% vs 4.3%, P = 0.003). New pacemaker implantation was most frequent in those patients with pre-existing left bundle branch block, followed by right and no bundle branch block on admission (28.6% vs 7.5% vs 2.8% respectively, P < 0.001; odds ratio 4.96 95% confidence interval 2.96–8.08, P < 0.001). The 10-year cumulative survival rate was lower in patients with bundle branch block compared with patients with no bundle branch block (76.8% vs 82.8%, log-rank P < 0.001; hazard ratio 0.73, confidence interval 0.54–0.99, P = 0.042).
This study indicates that patients with pre-existing bundle branch block have a higher incidence of pacemaker implantation and all-cause mortality after AV replacement compared with patients without a conduction disturbance.
INTRODUCTION
Aortic valve (AV) stenosis, the most common valve disorder, is emerging as a new epidemic in the western world due to ageing populations [1]. Surgical aortic valve replacement (SAVR) and transcatheter aortic valve implantation (TAVI) are the only effective treatments for severe AV stenosis. Over the last decade, we have seen a high rate of conduction disturbances, such as left bundle branch block (LBBB), right bundle branch block (RBBB) and atrioventricular block (AVB), and the subsequent need for permanent pacemaker implantation (PPI).
Throughout the last decade, the therapeutic management strategy for patients with severe aortic stenosis has been revolutionized, particularly for inoperable and high-risk patients [2–4]. In Israel, TAVI has been used routinely in high‐risk patients since 2010. Most patients with severe aortic stenosis are at low surgical risk [5], the current guideline recommendation for these patients is surgical AVR [6].
Pre-existing RBBB or LBBB in the general population and in patients with heart disease has been associated with an increased risk of mortality [7]. However, contemporary data on the prognostic impact of pre-existing hemiblock on clinical outcomes after SAVR are limited. The aim of this study was to evaluate the impact of pre-existing RBBB or LBBB on clinical outcomes in patients undergoing SAVR.
MATERIALS AND METHODS
Ethics statement
The study was approved by the Sheba Medical Center Institutional Ethics Committee (Protocol No 4527; 28 February 2021). The requirement for informed consent was waived because of the retrospective nature of the study.
Study design and population
We performed a retrospective, observational study that included prospectively collected data from consecutive patients who had undergone AVR surgery between 2004 and 2020. We excluded from the study patients who had undergone concomitant mitral or tricuspid valve surgery, surgical ablation of atrial fibrillation, concomitant septal myectomy, concomitant replacement of the aortic root or root enlargement, a previous pacemaker implantation and endocarditis on the AV (Fig. 1). All patients with RBBB or LBBB had a complete BBB. None of the patients had left posterior, left anterior fascicular block or an incomplete RBBB. For the diagnosis of BBB, we used conventional criteria, as described elsewhere [8].
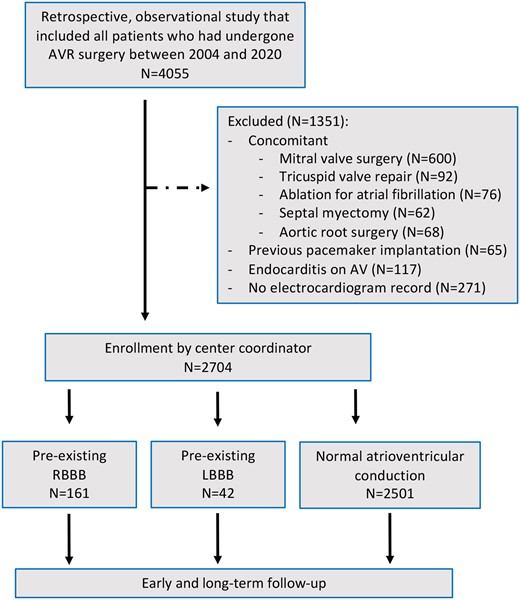
Flowchart summary from eligibility through follow-up. AVR: aortic valve replacement; RBBB: right bundle branch block; LBBB: left bundle branch block.
Surgical procedures and post-operative care
Standard cardiopulmonary bypass was established by cannulation of the ascending aorta and the right atrium or the right femoral artery and vein. Myocardial protection was achieved by using antegrade and/or retrograde cold blood cardioplegia. After resection of the aortic leaflets and decalcification if needed, the orifice area was measured with an appropriate valve sizer. The valves were implanted using separate 2–0 Ticron pledgeted polyester sutures (needle size 20 or 25 mm, Covidien, Medtronic Inc. Minneapolis, MN, USA) by the noneverting technique. The sutures were passed from the ventricular side of the annulus through the aortic side and through the prosthetic valve sewing ring.
All patients left the operating room with right ventricle temporary pacemaker wires, and additional right atrial temporary pacemaker wires in selected cases. After surgery, all patients were admitted to the intensive care unit (ICU) directly from the operating room. Electrophysiology consultation was obtained only in cases with a suspected need for PPI. In patients with acquired second-degree Mobitz type II, high-grade AVB or third-degree AVB, which does not resolve ∼6 days after surgery, permanent pacing is indicated by our institutional protocol regardless of symptoms. In cases of sinus node dysfunction, our institutional protocol recommends PPI when there is symptomatic bradycardia. After discharge from the ICU, patients were transferred either to a step-down unit or directly to the floor, from where they were discharged either to their home or to a rehabilitation facility.
Data collection and follow-up
All hospital data were ascertained by hospital chart review and clinical follow-up. Bundle branch block was diagnosed by six-lead electrocardiogram (ECG) according to the cardiac conduction disturbances definitions of The American Heart Association, American College of Cardiology Foundation and Heart Rhythm Society [9]. Mortality data were ascertained from the Israeli Ministry of Interior Population Register through August 2020 and were completed for all patients. The median follow-up duration was 80 months (38–138 months).
Statistical analysis
Data are presented as mean (standard deviation). Continuous variables were tested by the Q–Q plot test and with the Shapiro–Wilk test for normal distribution. Categorical variables are given as frequencies and percentages. A chi-square test was used for the comparison of categorical variables between patients with and without BBB; a Student’s t-test was performed for the comparison of normally distributed continuous variables, and Mann–Whitney U-test for non-normal distribution. A comparative analysis of 3 groups of atrioventricular conduction patterns was performed: RBBB, LBBB and normal conduction. An analysis of variance was performed to compare the means of the 3 groups.
Multivariable logistic regression analysis was used to identify factors associated with PPI and in-hospital mortality in the entire cohort. Candidate factors appear in Tables 1 and 2. Variables that were associated with RBBB/LBBB (P < 0.1 in Table 1 or Table 2) were included in the regression model. In addition, we included pre-specified clinically significant variables in the model. A stepwise selection process was used to select the variables in the final models. Missing data were handled by omitting those cases with missing data and the remaining data were analysed.
Patient characteristics
| Pre-existing RBBB/LBBB | Non-BBB | P-Value | |
|---|---|---|---|
| No. patients = 203 | No. patients = 2501 | ||
| RBBB, n (%) | 161 (79) | 0 (0) | – |
| LBBB, n (%) | 42 (21) | 0 (0) | – |
| Age (years), mean (SD) | 69 (13) | 67 (13) | 0.092 |
| Males, n (%) | 130 (64) | 1567 (63) | 0.751 |
| Diabetes, n (%) | 63 (31) | 814 (32) | 0.715 |
| Hypertension, n (%) | 147 (72) | 1776 (71) | 0.731 |
| Previous MI, n (%) | 27 (13) | 307 (12) | 0.752 |
| COPD, n (%) | 16 (8) | 190 (8) | 0.992 |
| Dialysis, n (%) | 2 (1) | 26 (1) | 1.000 |
| Hyperlipidaemia, n (%) | 130 (64) | 1574 (63) | 0.812 |
| Smoking, n (%) | 69 (34) | 810 (32) | 0.696 |
| PVD, n (%) | 20 (10) | 170 (7) | 0.135 |
| Prior CVA/TIA, n (%) | 20 (10) | 222 (9) | 0.733 |
| Neurological deficit, n (%) | 8 (4) | 47 (2) | 0.181 |
| Atrial fibrillation, n (%) | 14 (7) | 206 (8) | 0.590 |
| Carotid stenosis >70%, n (%) | 2 (1) | 32 (1) | 0.973 |
| BMI (kg/m²), mean (SD) | 27.7 (5.1) | 28 (4.9) | 0.364 |
| Hypothyroid, n (%) | 6 (3) | 119 (5) | 0.316 |
| NYHA FC III–IV, n (%) | 68 (36) | 813 (34) | 0.751 |
| EuroSCORE, median [IQR] | 7 [5–10] | 6 [5–8] | 0.102 |
| Surgery after 2010, n (%) | 161 (79) | 1478 (59) | <0.001 |
| Bicuspid/unicuspid AV, n (%) | 27 (25) | 656 (34) | 0.003 |
| Echocardiography | |||
| Ejection fraction (%), median [IQR] | 60 [45–60] | 60 [55–62] | 0.001 |
| Pulmonary hypertension (>60 mmHg), n (%) | 11 (5) | 116 (5) | 0.739 |
| LVEDD (cm), mean (SD) | 5.1 (0.8) | 5 (0.8) | 0.051 |
| AV pathology, n (%) | 0.411 | ||
| Stenosis | 157 (77) | 1827 (73) | |
| Regurgitation | 29 (14) | 420 (17) | |
| Both | 17 (9) | 254 (10) | |
| AV area (cm2), median [IQR] | 0.74 [0.63–0.89] | 0.77 [0.64–0.9] | 0.677 |
| AV peak gradient (mmHg), mean (SD) | 68 (23) | 72 (25) | 0.045 |
| AV mean gradient (mmHg), mean (SD) | 42 (15) | 46 (17) | 0.004 |
| Ascending aorta diameter (cm), mean (SD) | 3.6 (0.5) | 3.7 (0.8) | 0.521 |
AV: aortic valve; BMI: body mass index; CAD: coronary artery disease; COPD: chronic obstruction pulmonary disease; CVA: cerebral vascular accident; IQR: interquartile range; LBBB: left bundle branch block; LVEDD: left ventricle end-diastolic diameter; MI: myocardial dysfunction; NYHA FC: New York Heart Association functional class; PVD: peripheral vascular disease; RBBB: right bundle branch block; SD: standard deviation; TIA: transient ischaemic attack.
Surgical data
| Pre-existing RBBB/LBBB | Non-BBB | P-Value | |
|---|---|---|---|
| No. patients = 203 | No. patients = 2501 | ||
| Valve prosthesis, n (%) | 0.285 | ||
| Biological | 162 (80) | 2101 (84) | |
| Mechanical | 41 (20) | 400 (16) | |
| Supra-annular prosthetic, n (%) | 171 (84) | 2188 (87) | 0.221 |
| Valve size, median [IQR] | 23 [21–25] | 23 [21–25] | 0.895 |
| Concomitant procedure (any), n (%) | 86 (42) | 1156 (46) | 0.323 |
| Concomitant CABG, n (%) | 58 (29) | 738 (29) | 0.840 |
| Number of grafts, n (%) | 0.972 | ||
| 1 | 31 (53) | 406 (55) | |
| 2 | 18 (32) | 229 (31) | |
| 3 | 9 (15) | 103 (14) | |
| Graft to LAD artery, n (%) | 38 (66) | 512 (69) | 0.335 |
| Concomitant ascending aorta replacement, n (%) | 33 (16) | 470 (19) | 0.424 |
| Concomitant PFO closure, n (%) | 1 (0.5) | 9 (0.4) | 1.000 |
| Concomitant pericardiectomy, n (%) | 1 (0.5) | 6 (0.2) | 1.000 |
| Surgical approach, n (%) | 0.478 | ||
| Median sternotomy | 192 (94.6) | 2331 (93.2) | |
| Partial sternotomy (J-sternotomy) | 8 (3.9) | 144 (5.8) | |
| Right mini-thoracotomy | 3 (1.5) | 26 (1) | |
| Cross-clamp time (min), mean (SD) | 82 (32) | 79 (29) | 0.211 |
BBB: bundle branch block; CABG: coronary artery bypass grafting; IQR: interquartile range; LAD: left anterior descending; LBBB: left bundle branch block; PFO: patent foramen ovale; RBBB: right bundle branch block; SD: standard deviation.
Survival analysis was performed using the Kaplan–Meier method, and statistical differences between the 2 periods were tested using the log-rank test. Cox proportional hazard model was constructed to assess factor associated to long-term mortality using a stepwise selection process. Variables that were associated with one of the groups (P < 0.1 in Table 1) were included in the model, as were, pre-specified clinically significant variables. The covariates included in the final model were: age, body mass index, hypertension, diabetes, history of atrial fibrillation, New York Heart Association functional class, ejection fraction, era of surgery, AV gradients and number of AV leaflets. Missing data were handled by omitting those cases with missing data and the remaining data were analysed. Violation proportional hazards assumption was tested using Cox.zph function, which tests proportionality of the model predictors. Further analysis was performed to account for potential selection bias including propensity score regression adjustment in which a logistic regression model was applied to calculate the conditional probability for pre-existing BBB. We included the propensity score as a covariate in the Cox regression model for mortality.
In addition, subgroup analysis was based on the year of operation, since the introduction of TAVI in Israel, age, number of AV leaflets, prosthetic size, AV pathology, type of prosthesis implanted, concomitant procedures and ejection fraction.
Statistical significance was assumed when the null hypothesis could be rejected at P < 0.05. All P-values are results of two-sided tests. Statistical analyses were conducted using R (version 3.4.1).
RESULTS
Baseline characteristics
A total of 2704 patients were divided into 2 groups: those who had pre-existing RBBB (N = 161) or LBBB (N = 42) on ECG (N = 203, 7.5%) and those who had normal atrioventricular conduction (non-BBB) (N = 2501, 92.5%). The mean age was 68 (13) years and 1697 patients (63%) were male. Patients with RBBB/LBBB had a lower mean ejection fraction (60 [45–60%] vs 60 [55–62%], P = 0.001) and included more patients with tricuspid aortic valve (75% vs 66%, P = 0.003), compared with those patients with no BBB (Tables 1 and 2). RBBB/LBBB was more frequent during the later stage of the study period (>2010) compared to the period prior to 2010 (Supplementary Material, Fig. S1). The indication for surgery was aortic stenosis in most patients (stenosis in 70%, regurgitation in 19% and combined pathology in 11%) (Table 1). Of the 2704 patients, 2271 (84%) received a biological prosthesis and 433 (16%) a mechanical prosthesis, with a median prosthetic size of 23 (21–25). Surgical data were similar between the 2 groups (Table 2). Comparison between patients with RBBB to patients with LBBB is presented in Supplementary Material, Table S1.
Early outcomes
The in-hospital mortality rate was higher in patients with pre-existing RBBB or LBBB compared to patients with no BBB on admission (5.9% vs 2.9%, P = 0.032) and more frequent in patients with LBBB compared to RBBB (11.9% vs 4.3%, P = 0.003; Supplementary Material, Table S2). The cause of death was cardiac in 75%, sepsis in 18%, respiratory failure in 5% and stroke in 2% of the patients, with no different distribution between the groups. However, by using multivariable analysis, pre-existing BBB did not reach statistically significance [odds ratio 1.62 95% confidence interval (CI) 0.81–2.97, P = 0.146]. Independent predictors for in-hospital mortality included older age, peripheral vascular disease, lower left ventricle ejection fraction and bicuspid versus tricuspid AV (Supplementary Material, Fig. S2).
Conduction disturbance that required PPI was most frequent in the patients with pre-existing LBBB, followed by RBBB and no BBB on admission (28.6% vs 7.5% vs 2.8% respectively, P < 0.001). All patients with BBB who received a PPI were with complete (92%) or high degree of AVB (8%) as the rational for PPI, while the specific indications for PPI among patients without BBB were complete AVB in 71%, high-degree AVB in 13%, sick sinus syndrome in 7%, atrial fibrillation with bradycardia in 3% and other indications in 6%. Multivariable logistic regression analysis identified only pre-existing BBB as a factor significantly associated with PPI. This analysis showed that patients with pre-existing BBB were 5 times more likely to receive a PPI, compared with patients with no BBB on admission (odds ratio 4.96 95% CI 2.96–8.08, P < 0.001) (Fig. 2). In the logistic regression model of PPI according to different baseline characteristics and comorbidities, BBB compared to non-BBB was a significant factor associated to PPI among different subgroups: age (≤70 and >70), AV anatomy and lesion, prosthetic type and size, concomitant procedures and ejection fraction (≤55% and >55%) (Fig. 3).
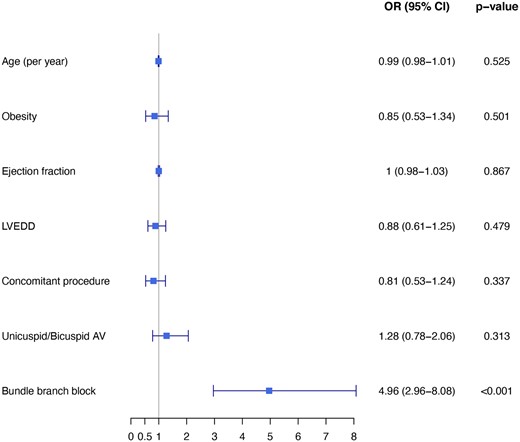
Multivariable logistic regression analysis: odds ratio for new permanent pacemaker implantation following aortic valve replacement with 95% confidence interval. AV: aortic valve; CI: confidence interval; LVEDD: left ventricular end-diastolic diameter; OR: odds ratio; PVD: peripheral vascular disease.
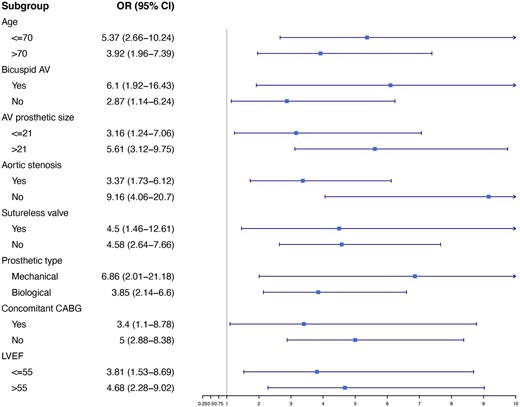
Logistic regression among different subgroups: odds ratio for new permanent pacemaker implantation with 95% confidence interval between patients with and without bundle branch block. AV: aortic valve; CABG: coronary artery bypass grafting; CI: confidence interval; LVEF: left ventricle ejection fraction; OR: odds ratio.
While patients with RBBB or LBBB had less surgical re-explorations due to bleeding or tamponade (P = 0.028), they had a longer ventilation time (P = 0.009), ICU stay (P = 0.018) and hospital stay (P = 0.012), compared to patients without BBB (Table 3).
Early outcomes: in-hospital results
| Pre-existing RBBB/LBBB | Non-BBB | P-Value | |
|---|---|---|---|
| No. patients = 203 | No. patients = 2501 | ||
| In-hospital mortality, n (%) | 12 (5.9) | 73 (2.9) | 0.032 |
| Ventilation time (days), mean (SD) | 1.2 (2.9) | 0.8 (1.9) | 0.009 |
| Intensive care unit stay (days), mean (SD) | 3.3 (5.4) | 2.5 (4) | 0.018 |
| Hospital days (days), mean (SD) | 11.9 (8.1) | 10.4 (7.9) | 0.012 |
| Total Bleeding (ml), mean (SD) | 370 (280) | 382 (343) | 0.657 |
| Stroke, n (%) | 5 (2.5) | 37 (1.5) | 0.427 |
| Surgical re-exploration, n (%) | 1 (0.5) | 92 (3.7) | 0.028 |
| Atrial fibrillation, n (%) | 52 (26) | 720 (29) | 0.378 |
| Acute kidney injury, n (%) | 20 (9.9) | 231 (9.2) | 0.869 |
| Deep venous thrombosis, n (%) | 1 (0.5) | 5 (0.2) | 0.939 |
| Post pericardiotomy syndrome, n (%) | 14 (6.9) | 122 (4.9) | 0.272 |
| Sternal infection, n (%) | 0.975 | ||
| None | 195 (96) | 2409 (96.4) | |
| Superficial | 6 (3) | 69 (2.7) | |
| Deep | 2 (1) | 22 (0.9) | |
| Discharge to, n (%) | 0.101 | ||
| Home | 50 (45.4) | 775 (41.2) | |
| Convalescence | 41 (37.3) | 897 (47.6) | |
| Rehabilitation | 12 (10.9) | 139 (7.4) | |
| Another department | 7 (6.4) | 72 (3.8) |
LBBB: left bundle branch block; RBBB: right bundle branch block; SD: standard deviation.
Follow-up mortality
The unadjusted comparison between the 2 groups revealed a significant long-term advantage regarding mortality towards patients with no atrioventricular conduction disturbance. Thus, the 10-year cumulative survival rate was lower in patients with LBBB or RBBB compared with patients with no BBB: 76.8% vs 82.8%; respectively (log-rank P < 0.001 and P = 0.012, respectively) (Fig. 4). Furthermore, the adjusted comparison between the 2 groups showed a long-term advantage towards the non-BBB group [hazard ratio (HR) 0.73, CI 0.54–0.99, P = 0.042] (Fig. 4). Multivariable Cox regression analysis demonstrated that postoperative PPI was not associated with long-term mortality (HR 1.28, CI 0.95–1.74, P = 0.108). Preoperative BBB either with or without the need of postoperative PPI was associated with 10-year mortality (HR 1.45, CI 1.07–1.95, P = 0.017 and HR 1.4, CI 1.02–1.92, P = 0.037; respectively).
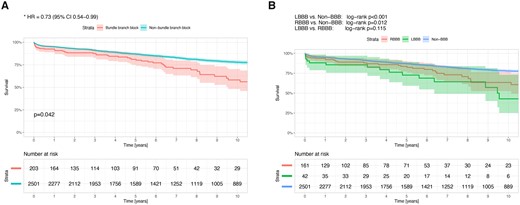
(A) Hazard plot for survival at 10 years with propensity score adjustment, according to the atrioventricular conduction disturbance, in patients who underwent aortic valve replacement. The covariates included in the model were: age, gender, body mass index, diabetes mellitus, hypertension, atrial fibrillation, New York Heart Association functional class, ejection fraction, era of surgery, left ventricle end-diastolic diameter, aortic valve gradients and number of aortic valve leaflets. (B) Ten-year survival curves in patients who underwent aortic valve replacement according to the atrioventricular conduction disturbance. The confidence limits (95%) are presented as a coloured shaded area. HR: hazard ratio; LBBB: left bundle branch block; RBBB: right bundle branch block.
Subgroup analyses
Since the introduction of TAVI in Israel, 1639 patients underwent SAVR and were included in the study (Supplementary Material, Table S3). Of them, 161 (10%) had RBBB or LBBB and 1478 (90%) had no conduction disturbances. The PPI probability was higher in patients with pre-existing RBBB/LBBB (14.3% vs 2.8%, P < 0.001). Furthermore, the in-hospital mortality rate (5.6% vs 2.3%, P = 0.026) and 10-year mortality rate (20.5% vs 16.3%, log-rank P = 0.003) were higher in those with pre-existing RBBB or LBBB. Other outcomes of the subgroup of patients who underwent AVR surgery from 2010 onwards are presented in Table 4.
Outcomes of the subgroup of patients who underwent aortic valve replacement surgery from 2010 onwards
| Pre-existing RBBB/LBBB | Non-BBB | P-Value | |
|---|---|---|---|
| No. patients = 161 | No. patients = 1478 | ||
| In-hospital mortality, n (%) | 9 (5.6) | 34 (2.3) | 0.026 |
| Ventilation time (days), mean (SD) | 1.1 (2.6) | 0.7 (1.6) | 0.046 |
| Intensive care unit stay (days), mean (SD) | 3.1 (5.4) | 2.3 (3.6) | 0.022 |
| Hospital days (days), mean (SD) | 11.7 (8.2) | 9.8 (7.7) | 0.004 |
| Total bleeding (ml), mean (SD) | 356 (284) | 374 (371) | 0.559 |
| Stroke, n (%) | 2 (1.2) | 18 (1.2) | 1.000 |
| Surgical re-exploration, n (%) | 1 (0.6) | 48 (3.2) | 0.111 |
| Atrial fibrillation, n (%) | 45 (27.6) | 466 (30.7) | 0.462 |
| Acute kidney injury, n (%) | 12 (7.4) | 137 (9) | 0.569 |
| Deep venous thrombosis, n (%) | 1 (0.6) | 5 (0.3) | 1.000 |
| Post pericardiotomy syndrome, n (%) | 12 (7.4) | 87 (5.7) | 0.509 |
| Sternal infection, n (%) | 0.683 | ||
| None | 157 (96.3) | 1455 (96) | |
| Superficial | 4 (2.5) | 49 (3.2) | |
| Deep | 2 (1.2) | 11 (0.8) | |
| Late mortality, n (%) | 33 (20.5) | 242 (16.4) | 0.003* |
The statistical method used for long-term mortality differences between the groups was the log-rank test.
LBBB: left bundle branch block; RBBB: right bundle branch block; SD: standard deviation.
Similar results were obtained also among the subgroup of 1462 patients who underwent isolated AVR surgery (Supplementary Material, Table S4 and Supplementary Material, Fig. S3).
DISCUSSION
This is a retrospective study that demonstrates the impact of a pre-existing right or left BBB on a new pacemaker implantation after AVR during a period when TAVI was being performed at an increasing rate. Our findings, obtained from a contemporary cohort of patients who underwent their first AVR surgery, show that the incidence of a new PPI was significantly increased in patients with pre-existing BBB after AVR. Increased mortality was demonstrated in patients with pre-existing BBB following AVR.
Previous publications among healthy participants and patients with heart disease have shown a different prognostic value for right or left BBB. While some have shown that RBBB, but not LBBB, on admission ECG, is associated with a significantly increased mortality risk [10], others have shown the opposite; LBBB but not RBBB is associated with a greater risk of death [11]. Furthermore, others have shown an increased mortality hazard among both RBBB and LBBB compared to patients with no-BBB [12, 13]. The exact mechanism by which BBB increases mortality has not yet been elucidated. A possible explanation could be that since BBB correlates strongly to age and is common in elderly patients, it is a marker of a slowly progressing degenerative disease that also affects the myocardium. Another proposed hypothesis is that an underlying conduction system disease could predispose patients to various arrhythmias. The association of BBB with decreased left ventricular ejection fraction may provide a clue towards the underlying mechanism [10, 14]. The various co-morbidities and underlying heart disease in patients with BBB may also explain the increased mortality.
A recent pivotal study (PARTNER 3) [15] reported similar results regarding mortality, when comparing between AVR and TAVI in low-risk patients with aortic stenosis. The PARTNER-3 researchers reported a new PPI rate of 6.6% after TAVI and 4.1% after AVR among patients with no pre-existing BBB and who were classified as low risk. In our current study, we report a PPI rate of 3.5% in a cohort of patients with additional co-morbidities that included patients who were at low-, intermediate- and high-surgical risk, during the same period. Conduction disturbances are a common complication after AV interventions due to the anatomical relationship between the aortic annulus and the conduction system [16]. Nevertheless, we believe that in centres of excellence, the PPI rate after AVR should be lower than that reported in the AVR arm of PARTNER 3 study.
Development of high-degree AV block and new PPI is a common complication seen in up to 59% of patients with pre-existing BBB after TAVI [17]. These late conduction disorders in patients with pre-existing BBB can lead to cardiac complications such as heart failure and sudden cardiac death. We report a much lower PPI rate among patients with BBB who undergo AVR (11.8%). This concern should be raised during heart-team discussion sessions when deciding between the 2 options for the treatment of AV disease.
Although there is a clear causative association between BBB and postoperative PPI, the association to death is less certain. Recently, there is increasing evidence that long-term right ventricular pacing may not be a benign condition [18, 19]. Therefore, we have examined whether BBB is only associated with mortality if it results in the need for a pacemaker implantation. A sensitivity analysis, using BBB with and without postoperative PPI, showed that BBB was associated with long-term mortality independent of the need for PPI. We speculate whether BBB is only a surrogate for sicker patients rather than a predisposition to a particular postoperative complication, which leads to death.
During the last decade, the rate of isolated AVR has declined, and in clinical practice, there is a tendency to under-perform surgical AVR in asymptomatic patients [20], despite the fact that current guidelines recommend surgery in some subgroups of asymptomatic patients [6], based on the severity of the stenosis and on left ventricle function. With the excellent early and late results of surgical AVR in current practice, as shown in our study, we believe that it should remain the procedure of choice for low-risk patients, even if they have pre-existing BBB. Nevertheless, we have shown an increased prevalence of BBB among patients who undergo AVR in the recent years (Supplementary Material, Fig. S1). We speculate whether the recent increase may be related to the referral patterns for AVR with increasing referral of the aortic stenosis population for TAVI. Indeed, the referral pattern has changed, and patient risk profiles increased among the AVR population in recent years [21].
Limitations
There are a few limitations in our study. First, while it is retrospective in design, data were collected prospectively and recorded in a well-defined database. Second, our study was conducted in a single-centre cardiac surgery department. Third, data regarding cases presenting de novo BBB following AVR were not recorded in our database and, therefore, we cannot present this information. Fourth, we had no information regarding the main cause of death, the rate of cardiac events and data regarding prosthetic valve performance during the follow-up period. Fifth, we had no information regarding the rate of PPI during follow-up and therefore did not control for this when analysing long-term mortality. Finally, we were underpowered to separate the LBBB from the RBBB patients and to demonstrate their individual effect on outcomes, since there were too few patients in these subgroups.
CONCLUSIONS
Pre-existing BBB is a common underlying conduction disturbance in patients undergoing AVR and is associated with an increased risk of PPI and mortality. Therefore, BBB should be considered to be used as part of the risk stratification tools. Future studies are needed to evaluate the optimal management of patients with pre-existing BBB undergoing AVR.
SUPPLEMENTARY MATERIAL
Supplementary material is available at EJCTS online.
ACKNOWLEDGEMENTS
The authors thank Elaine Finkelstein for skilful English-language editing.
Funding
No funding was provided for this study by any source.
Conflict of interest: The authors of this manuscript have no conflicts of interest to disclose.
Data availability statement
All relevant data are within the manuscript and its Supporting Information files.
Author contributions
Eilon Ram: Conceptualization; Investigation; Methodology; Project administration; Writing—original draft. Yael Peled: Conceptualization; Investigation; Methodology; Validation. Irena Sarantsev: Formal analysis; Investigation; Validation; Visualization. Tamer Jamal: Data curation; Investigation; Methodology; Validation; Visualization. Alexander Kogan: Conceptualization; Investigation; Methodology; Validation; Visualization. Ehud Raanani: Conceptualization; Data curation; Funding acquisition; Investigation; Methodology; Supervision; Validation; Writing—review & editing. Leonid Sternik: Conceptualization; Data curation; Investigation; Methodology; Project administration; Resources; Supervision; Writing—review & editing.
Reviewer information
European Journal of Cardio-Thoracic Surgery thanks Anders Albåge, Stefano Benussi, Richard B. Schuessler and the other, anonymous reviewer(s) for their contribution to the peer review process of this article.
REFERENCES
ABBREVIATIONS
- AV
Aortic valve
- AVB
Atrioventricular block
- CI
Confidence interval
- ECG
Electrocardiogram
- HR
Hazard ratio
- ICU
Intensive care unit
- LBBB
Left bundle branch block
- PPI
Permanent pacemaker implantation
- RBBB
Right bundle branch block
- SAVR
Surgical Aortic valve replacement
- TAVI
Transcatheter aortic valve implantation
