


Abstract

Intraoperative conversion from video-assisted thoracic surgery (VATS) to thoracotomy may occur during anatomical lung resection. The objectives of the present study were to identify risk factors for intraoperative conversion and to develop a predictive score.
We performed a multicentre retrospective analysis of French thoracic surgery departments that contributed data on anatomical lung resections to the Epithor database over a 10-year period (from January-2010 to December-2019). Using univariate and multivariate logistic regression analyses, we determined risk factors for intraoperative conversion and elaborated the Epithor conversion score (ECS). The ECS was then validated in a cohort of patients operated on between January- and June-2020.
From January-2010 to December-2019, 210,037 patients had been registered in the Epithor database. Of these, 55,030 had undergone anatomical lung resection. We excluded patients who had upfront a thoracotomy or robotic-assisted thoracoscopic surgery (n = 40,293) and those with missing data (6,794). Hence, 7943 patients with intent-to-treat VATS were assessed: 7100 with a full VATS procedure and 843 patients with intraoperative conversion to thoracotomy (conversion rate: 10.6%). Thirteen potential risk factors were identified among patients’ preoperative characteristics and planned surgical procedures and were weighted accordingly to give the ECS. The score showed acceptable discriminatory power (area under the curve: 0.62 in the development cohort and 0.64 in the validation cohort) and good calibration (P = 0.23 in the development cohort and 0.30 in the validation cohort).
Thirteen potential preoperative risk factors were identified, enabling us to develop and validate the ECS—an easy-to-use, reproducible tool for estimating the risk of intraoperative conversion during VATS.
INTRODUCTION
At present, the recommended treatment for early-stage lung cancer is still a combination of anatomical resection (usually lobar) and systematic hilar and mediastinal lymphadenectomy. Over the last few years, minimally invasive surgery [such as video-assisted thoracic surgery (VATS)] has become the preferred approach because it is associated with better outcomes than a conventional open thoracotomy [1–5]. Although minimally invasive VATS lung resection may be straightforward for experienced teams of surgeons, the occurrence of intraoperative conversion to an open procedure (thoracotomy) still constitutes a serious obstacle to routine use by non-expert teams, in case of an intraoperative complication [6] or in especially complex cases. Given that most studies feature small numbers of converted patients, there are few published data on intraoperative conversion and its preoperative or intraoperative risk factors [7–10]. The objectives of the present study were to (i) identify risk factors for intraoperative conversion during VATS anatomical lung resection for lung cancer, benign or metastatic (as documented in a large national database), and thus (ii) develop and validate a score for predicting intraoperative conversion.
PATIENTS AND METHODS
Ethical statement
Patient informed consent was obtained to gather the data that were extracted from the Epithor French national database (CNIL 809833). The study was approved by the ethics committee of the French Society of Thoracic and Cardio-Vascular Surgery (reference: CERC-SFCTCV-2020–10-22–01-18FOAL).
Patients
We performed a multicentre retrospective analysis of 128 French thoracic surgery departments who contributed data on anatomical lung resections to the Epithor national database over a 10-year period (from January 2010 to December 2019). We extracted data on all consecutive patients scheduled for VATS with either lobar anatomical lung resection (lobectomy, bilobectomy or pneumonectomy) or sublobar anatomical lung resection (segmentectomy) for benign or malignant conditions. We then excluded patients who had non-anatomical lung resections (biopsy or wedge resection), upfront thoracotomy (with or without muscle sparing), video-assisted thoracotomy procedures (combination of a thoracoscopy and a minithoracotomy using a rib spreader) or robotic-assisted thoracoscopic surgery (RATS).
For each patient in the database, the occurrence (or not) of conversion is reported. The cause of conversion is documented as emergency (vessel injury/bleeding or major intraoperative event/complication) or non-emergency (other cause). Two groups were identified: The conversion group included all patients who had intraoperative conversion (whether emergency or not), and the full VATS group included all patients who completed VATS without conversion.
Risk factor analysis
A large number of preoperative and surgery-related variables were assessed as potential risk factors for intraoperative conversion during VATS. The preoperative variables were sex, age, body mass index (BMI), World Health Organization/Eastern Cooperative Oncology Group status, American Society of Anesthesiologists status, history of smoking, smoking (pack-years), asthma, sleep apnoea, preoperative forced expiratory volume in 1 s (FEV1), induction chemotherapy, hypertension, pulmonary hypertension, coronary artery disease, cardiac arrhythmia, congestive heart failure, valvulopathy, previous cardiac surgery, peripheral arterial disease, stroke, previous thoracic surgery, thoracic trauma, chronic kidney failure, thyroid dysfunction, chronic liver failure, type II diabetes, drug addiction, alcohol addiction, malnutrition and antiplatelet therapy. The surgery-related variables were the surgery side, extent of resection (segmentectomy, lobectomy, bilobectomy or pneumonectomy), tumour histology (primary malignant lung cancer, secondary malignant lung cancer/metastasis or a benign condition), tumour status and lymph node status (according to the 8th edition of the American Joint Committee on Cancer staging manual).
Statistical analyses
Potential risk factors for intraoperative conversion during VATS were first analysed in a univariate logistic regression. Variables with a P-value ≤0.20 were fed into a multivariate logistic regression with backward selection. A history of thoracic surgery had a P-value >0.20 but was forced into the multivariate analysis because it had been mentioned in the literature as a significant risk factor for intraoperative conversion [8]. In order to build an adequate score/risk model in line with current recommendations, absence of collinearity was checked, and variables with a P-value ≤0.05 in the multivariate analysis were given a coefficient that was proportional to their odds ratio [10]. The resulting score is referred to henceforth as the Epithor conversion score (ECS). Based on the ECS, the patients were classified as having a low, intermediate (which represent a “standard risk”) or high risk of intraoperative conversion. By measuring the area under the receiver operating characteristic curve, we determined the ability of the ECS to discriminate between patients in the conversion group and those in the full VATS group. Lastly, in order to confirm the level of agreement between the predicted risk of conversion and the observed conversions, the calibration of the ECS was measured graphically and in the Hosmer-Lemeshow test. A separate cohort of patients in the Epithor database was identified: It included patients with similar inclusion and exclusion criteria from the January 2020 to June 2020 period to validate the discriminant ability and calibration of the ECS.
Continuous variables are presented as the mean ± standard deviation, and categorical variables are presented as the frequency (percentage). The threshold for statistical significance was set to P ≤ 0.05. All statistical analyses were performed using SAS software (version 9.4, SAS Institute Inc. Cary, NC, USA).
RESULTS
Patients
From January 2010 to December 2019, a total of 210,037 patients had been registered in the Epithor database. Of these, 55,030 had undergone anatomical lung resection. After the exclusion of upfront thoracotomy and RATS procedures, a total of 14,737 patients underwent intent-to-treat VATS. A total of 6794 of these patients were excluded because of missing data. Hence, the development cohort comprised 7943 patients with intent-to-treat VATS: 7100 in the full VATS group and 843 (10.6%) in the conversion group (Fig. 1). The characteristics of the groups and their differences in univariate analysis are summarized in Table 1. After we applied the same inclusion and exclusion criteria to the period from January to June 2020, the validation cohort comprised 1477 patients, including 112 (7.6%) with intraoperative conversion.
A univariate analysis of the preoperative characteristics of patients treated with anatomical lung resection with full video-assisted thoracoscopic surgery or intraoperative conversion to thoracotomy
| Variable | Full VATS group, n = 7100 | Conversion group, n = 843 | Odds ratio [95% CI] | P-value |
|---|---|---|---|---|
| Sex | <0.0001 | |||
| Female | 3032 (42.6 %) | 289 (34.2 %) | 1 | |
| Male | 4068 (57.3%) | 554 (65.8 %) | 1.42 [1.25–1.60] | |
| Age (years) | 69 ± 11.3 | 66.0 ± 9.7 | 1.012 [1.006–1.018] | 0.0002 |
| BMI (kg/m²) | 25.3 ± 4.6 | 26.2 ± 5.0 | 1.039 [1.026–1.052] | <0.0001 |
| WHO PS | 0.007 | |||
| 0 | 4366 (61.5%) | 497 (59.0%) | 1 | |
| 1 | 2385 (33.6 %) | 297 (35.5%) | 1.19 [1.05–1.35] | |
| 2 | 319 (4.5 %) | 44 (5.2%) | 1.14 [0.85–1.52] | |
| 3 | 28 (0.4%) | 4 (0.4%) | 1.93 [0.85–4.38] | |
| 4 | 0 (0%) | 1 (< 0.1%) | ||
| ASA status | <0.0001 | |||
| ASA 1-2 | 4785 (67.4%) | 520 (61.7%) | 1 | |
| ASA 3-4 | 2315 (32.6%) | 323 (38.3%) | 1.32 [1.17–1.50] | |
| History of smoking | 5495 (77.4%) | 697 (82.6%) | 1.22 [1.08–1.37] | 0.001 |
| Smoking (pack-years) | 30 ± 14.1 | 34.4 ± 25.0 | 1.005 [1.003–1.008] | <0.0001 |
| Preop. FEV1 | 90 ± 19.6 | 87.7 ± 19.3 | 0.993 [0.990–0.996] | <0.0001 |
| Induction CTx | 134 (1.9 %) | 19 (2.1%) | 0.809 | |
| Hypertension | 2201 (31 %) | 293 (34.8%) | 1.19 [1.05–1.35] | 0.007 |
| Pulmonary hypertension | 7 (< 0.1 %) | 1 (< 0.1%) | 0.275 | |
| Congestive heart failure | 28 (0.4 %) | 6 (0.7%) | 0.791 | |
| Peripheral arterial disease | 646 (9.1 %) | 110 (13.1%) | 1.37 [1.14–1.64] | 0.001 |
| Valvulopathy | 78 (1.1 %) | 14 (1.7%) | 1.74 [1.04–2.90] | 0.034 |
| Coronary artery disease | 646 (9.1 %) | 107 (12.7%) | 1.34 [1.11–1.63] | 0.003 |
| Cardiac arrhythmia | 475 (6.7 %) | 76 (9.1%) | 1.31 [1.04–1.64] | 0.022 |
| Previous cardiac surgery | 85 (1.2 %) | 18 (2.2%) | 1.75 [1.14–2.70] | 0.011 |
| Stroke | 244 (3.3 %) | 39 (4.6%) | 1.40 [1.04–1.88] | 0.025 |
| Antiplatelet therapy | 320 (4.5 %) | 53 (6.3%) | 1.45 [1.12–1.87] | 0.005 |
| Asthma | 128 (1.8 %) | 22 (2.5%) | 0.220 | |
| Sleep apnoea | 198 (2.8 %) | 26 (3.1%) | 0.674 | |
| Previous thoracic surgery | 142 (2.0 %) | 20 (2.4%) | 1.12 [0.77–1.63] | 0.541 |
| Previous thoracic trauma | 7 (< 0.1 %) | 6 (0.7%) | 3.34 [1.39–8] | 0.007 |
| Alcohol addiction | 334 (4.7 %) | 47 (5.6%) | 0.826 | |
| Chronic kidney failure | 134 (1.9%) | 33 (3.9%) | 2.32 [1.70–3.17] | <0.0001 |
| Malnutrition | 45 (0.6%) | 7 (0.9%) | 0.597 | |
| Thyroid dysfunction | 270 (3.8 %) | 34 (4.1%) | 0.295 | |
| Drug addiction | 45 (0.6 %) | 12 (1.4%) | 1.55 [0.81–2.94] | 0.186 |
| Chronic liver failure | 41 (0.6 %) | 7 (0.8%) | 0.527 | |
| Type II diabetes | 724 (10.2 %) | 130 (15.4%) | 1.42 [1.19–1.69] | <0.0001 |
| Histological analysis | <0.0001 | |||
| Primary lung | 6688 (94.2 %) | 811 (96.2%) | 1 | |
| Metastasis | 292 (4.1 %) | 24 (2.9%) | 0.63 [0.48–0.83] | |
| Benign | 120 (1.7 %) | 8 (0.9%) | 0.40 [0.23–0.69] | |
| Surgery side | ||||
| Right | 3684 (51.9%) | 423 (50.2%) | 0.257 | |
| Left | 3416 (48.1%) | 420 (49.8%) | ||
| Extent of resection | <0.0001 | |||
| Lobectomy | 5829 (82.1 %) | 722 (85.7%) | 1 | |
| Bilobectomy | 64 (0.9 %) | 16 (1.9%) | 1.88 [1.20–2.94] | |
| Pneumonectomy | 21 (0.3 %) | 16 (1.9%) | 40.70 [4.75–348.64] | |
| Segmentectomy | 1186 (16.7 %) | 89 (10.5%) | 0.61 [0.51–0.75] | |
| cT stage | 0.043 | |||
| T1 | 4956 (69.8 %) | 547 (64.8%) | ||
| T1a | 1 | |||
| T1b | 1.19 [0.99–1.43] | |||
| T1c | 1.23 [0.94–1.59] | |||
| T2 | 1661 (23.4%) | 215 (25.5%) | ||
| T2a | 1.22 [0.99–1.49] | |||
| T2b | 1.38 [0.95–1.99] | |||
| T3 | 391 (5.5 %) | 67 (8.0%) | 1.38 [1.02–1.87] | |
| T4 | 92 (1.3%) | 14 (1.7%) | 2.06 [1.16–3.65] | |
| Tis | 0.67 [0.16–2.84] | |||
| cN stage | <0.0001 | |||
| cN0 | 6638 (93.5 %) | 741 (87.9%) | 1 | |
| cN1 | 277 (3.9 %) | 69 (8.2%) | 2.04 [1.55–2.69] | |
| cN2 | 178 (2.5 %) | 31 (3.7%) | 1.27 [0.84–1.91] | |
| cN3 | 7 (0.1 %) | 2 (0.2%) | 4.42 [0.81–24.18] |
ASA: American Society of Anesthesiologists; BMI: body mass index; CTx: chemotherapy; preop. FEV1: preoperative forced expiratory volume in 1 s;. WHO PS: World Health Organization performance status.
Intraoperative conversion
As mentioned previously, the intraoperative conversion rate in the development cohort was 10.6%. Of the 843 conversions, 155 (18.4%) had an emergency cause (bleeding or a major intraoperative event/complication) and 688 (81.6%) had a non-emergency cause (severe adhesions/technical difficulties during dissection or related to the cancer itself). In the validation cohort, intraoperative conversion occurred in 112/1477 patients (7.6%), with 27/112 emergency conversions (24.1%). There was no statistical difference in the emergency/non-emergency conversion rate between the development and the validation cohorts (P = 0.15). Intergroup comparisons of preoperative variables showed that patients with a non-emergency cause had a higher BMI, a lower preoperative (FEV1 and larger tumours than patients with an emergency cause (Supplemental Table 1).
Score development
In univariate analyses, 25 variables were found to be significantly associated with conversion and were included in the multivariate analysis. As mentioned previously, previous thoracic surgery was forced into the multivariate analysis because it had been mentioned in the literature as a significant risk factor for intraoperative conversion [8]. In the multivariate analysis, 13 variables were found to be associated with intraoperative conversion: BMI, preoperative FEV1, previous thoracic surgery, a history of smoking, peripheral arterial disease, cardiac arrhythmia, antiplatelet therapy, previous thoracic trauma, chronic kidney failure, drug addiction, type II diabetes, extent of resection and cN status (Table 2).
A multivariate analysis of preoperative risk factors for intraoperative conversion in patients treated with anatomical lung resection through video-assisted thoracoscopic surgery
| Variable | Odds ratio [95% CI] | P-value |
|---|---|---|
| Sex | 0.077 | |
| Age | 0.773 | |
| BMI | 1.04 [1.02–1.05] | <0.0001 |
| WHO PS | 0.923 | |
| History of smoking | 1.19 [1.02–1.37] | 0.023 |
| Smoking (pack-years) | 0.630 | |
| Preop. FEV1 | 0.996 [0.992–1.000] | 0.035 |
| ASA physical status | 0.962 | |
| Extent of resection | <0.0001 | |
| Lobectomy | 1 | |
| Bilobectomy | 2.29 [1.32–3.96] | |
| Pneumonectomy | 33.89 [3.84–298.95] | |
| Segmentectomy | 0.61 [0.48–0.77] | |
| Hypertension | 0.902 | |
| Peripheral arterial disease | 1.28 [1.03–1.61] | 0.029 |
| Valvulopathy | 0.196 | |
| Coronary artery disease | 0.239 | |
| Cardiac arrhythmia | 1.33 [1.02–1.72] | 0.033 |
| Previous cardiac surgery | 0.407 | |
| Stroke | 0.087 | |
| Antiplatelet therapy | 1.40 [1.04–1.89] | 0.029 |
| Previous thoracic surgery | 1.55 [0.96–2.49] | 0.073 |
| Previous thoracic trauma | 4.89 [1.78–13.47] | 0.002 |
| Chronic kidney failure | 2.25 [1.55–3.28] | <0.0001 |
| Drug addiction | 2.26 [1.11–4.44] | 0.025 |
| Type II diabetes | 1.36 [1.10–1.68] | 0.005 |
| Histological analysis | 0.224 | |
| cT stage | 0.482 | |
| cN stage | <0.0001 | |
| cN0 | 1 | |
| cN1 | 1.94 [1.43–2.57] | |
| cN2 | 1.26 [0.82–1.92] | |
| cN3 | 7.81 [1.30–47.15] |
ASA: American Society of Anesthesiologists; BMI: body mass index; preop. FEV1: preoperative forced expiratory volume in 1 s; WHO PS: World Health Organization performance status
BMI: body mass index; WHO: World Health Organization performance status; preop. FEV1: preoperative forced expiratory volume in 1 s.
The equation for estimating the risk of intraoperative conversion in an individual patient was ECS = -2.9265 + BMI × 0.0358 + FEV1 × (-0.00411) + the sum of the variables’ coefficients (see Table 3), with a negative score indicating a lower risk of conversion. In the development cohort, the ECS ranged from -3.30 to 2.04. We divided the cohort into 3 risk groups: low risk (ECS < -2.44, i.e. a risk of conversion of less than 8%), intermediate risk (ECS between -2.43 and -1.99, i.e. a risk of conversion of 8 to 12%) and high risk (ECS 1.99, i.e. a risk of conversion of more than 12%).
Coefficients allocated to variables included in the Epithor conversion score equation to determine the risk for intraoperative conversion
| Variable | Coefficient | Standard error |
|---|---|---|
| BMI (for each 1 kg/m²) | 0.0358 | 0.0079 |
| Preop. FEV1 (for each 1%) | −0.00411 | 0.0020 |
| Previous thoracic surgery | 0.4348 | 0.2425 |
| History of smoking | 0.1696 | 0.0747 |
| Peripheral arterial disease | 0.2516 | 0.1149 |
| Cardiac arrhythmia | 0.2812 | 0.1320 |
| Antiplatelet therapy | 0.3358 | 0.1533 |
| Previous thoracic trauma | 1.5877 | 0.5168 |
| Chronic kidney failure | 0.8153 | 0.1914 |
| Drug addiction | 0.7952 | 0.3547 |
| Type II diabetes | 0.3040 | 0.1083 |
| Extent of resection | ||
| Lobectomy | 0 | |
| Bilobectomy | 0.8289 | 0.2792 |
| Pneumonectomy | 3.5230 | 1.1109 |
| Segmentectomy | −0.4944 | 0.1202 |
| cN status | ||
| cN0 | 0 | |
| cN1 | 0.6501 | 0.1489 |
| cN2 | 0.2279 | 0.2165 |
| cN3 | 2.0558 | 0.9171 |
BMI: body mass index; preop. FEV1: preoperative forced expiratory volume in 1 s.
Score validation
With regard to discriminant power, the ECS had acceptable levels of sensitivity and specificity: The area under the curve [95% confidence interval] was 0.62 [0.60–0.64] in the development cohort and 0.64 [0.59–0.70] in the validation cohort (Fig. 2). The score showed a good degree of calibration, with a calibration slope close to 1 (0.9998) and a non-significant Hosmer-Lemeshow test value in both the development cohort (P = 0.23) and the validation cohort (P = 0.30) (Supplemental Tables 2 and 3).
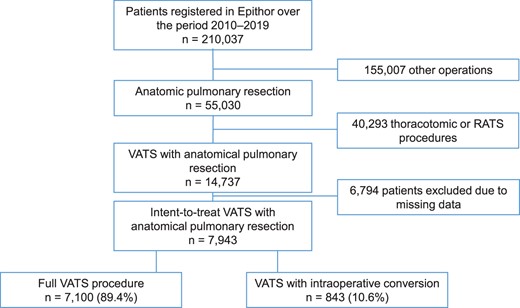
Study flow chart.
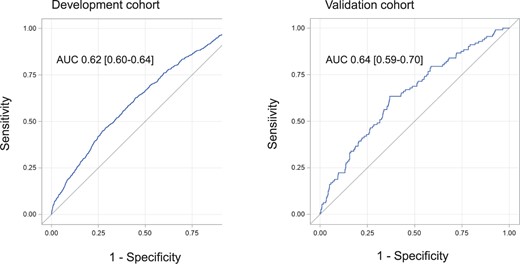
A receiver operating characteristic curve showing the discriminant power of the Epithor conversion score in the development and validation cohorts.
DISCUSSION
Using 13 routinely available preoperative patient variables, we developed and validated a score that accurately estimates the risk of intraoperative conversion during VATS anatomical lung resection. The ECS was then stratified to give low, intermediate and high levels of the risk of intraoperative conversion.
We assessed 35 preoperative variables related to the patient’s medical history, comorbidities and tumour characteristics. Our findings are in line with the data found in the literature. For example, the single-centre retrospective study by Tong et al. [8] of 20 565 surgical patients (including non-anatomical resections) also highlighted the extent of resection, lymph node involvement and previous thoracic surgery as risk factors for intraoperative conversion. A recent study by Chen et al. found that robot-assisted surgery, the absence of the chief symptom, tumour size <5 cm, BMI <25 kg/m2 and lobectomy (vs pneumonectomy) protected against intraoperative conversion [9]. Lymph node involvement had already been reported as a risk factor by other researchers; it was associated with more complicated, lengthy dissections and potentially led to intraoperative conversion (whether emergency or not) [7, 11–14]. Tong et al. also described tumour size (>1.4 cm), tumour site (central vs peripheral), lymph node calcification, pleural adhesions, induction chemotherapy and the surgeon’s level of experience as potential risk factors [8]. They also observed a reduced risk of conversion in patients treated with segmentectomy versus lobectomy [8]. In our multivariate analysis, tumour size (according to the American Joint Committee on Cancer staging manual, 8th edition) did not appear to have an impact on intraoperative conversion. One can reasonably hypothesize that the tumour site is more relevant than its size because a central site can lead to more technical problems during VATS. Regarding the extent of resection, our results are similar to those of Tong et al. because we also observed a decreased risk of conversion in segmentectomy and an increased risk in bilobectomy and pneumonectomy. Segmentectomy is probably less subject to intraoperative conversion because of an “experience” bias in surgeon performing segmentectomy and because technical difficulties encountered during VATS segmentectomy tend to be less severe than those in VATS lobectomy, allowing the easiest thoracoscopic management in case of intraoperative difficulty or complication (more proximal control during dissection or switch to a lobar resection, without conversion in a thoracotomy). Unfortunately, the tumour site, lymph node calcification and the presence or absence of pleural adhesions were not recorded in the Epithor database, which prevented us from including these variables in our analyses. In the present study, induction chemotherapy did not appear to be a risk factor for intraoperative conversion. We chose not to take the surgeon’s level of experience into account because we were seeking to develop a patient-based risk model. It is difficult to compare our present results with those of the cohort of Tong et al. The 2 studies notably differed with regard to the patient population, with a higher BMI in the Epithor cohort (25.5 vs 23.4 kg/m2 in the cohort of Tong et al.), a lower proportion of patients classified as American Society of Anaesthesiologists I-II (65% vs 90%, respectively), and a higher rate of nodal involvement in the Epithor cohort (7.1% vs 4.2%, respectively). Moreover, the study by Tong et al. included 5161 atypical (wedge) resections (25%) and had a much lower intraoperative conversion rate (1%) [8] than that reported in the literature (ranging from 6.5%–25.1%) [7, 9, 12, 15–18]. As observed in the study of Tong et al., age and sex were not risk factors for intraoperative conversion [8]. It was not possible to design a dedicated ECS score for patients with emergency conversion because of the low number of events; however, it is of interest to note that the differences we observed between the emergency and non-emergency subgroups were mainly related to the fitness of the patient, which was more likely to be impaired in the non-emergency group (older age, higher BMI, lower preoperative FEV1, lower American Society of Anaesthesiologists status and higher number of pack-years) and also more likely to be associated with a higher tumour stage in this non-emergency group. These findings corroborate the study results, highlighting the fact that some preoperative factors may cause surgical difficulties (higher BMI, impaired lung function) and may lead to “planned” or “non-emergency” conversion.
The ECS appears to be an easy-to-use, reproducible preoperative tool for estimating the risk of intraoperative conversion in a patient scheduled for VATS with anatomical lung resection. This risk estimate enables the medical team to adapt the surgical and anaesthesiology procedures so that the conversion (if it occurs) can be managed more effectively. To this end, preoperative planning regarding type of locoregional anaesthesia (epidural vs other) and pathway of perioperative care (ambulatory unit, surgical unit or ICU) may be modified based on the ECS level of risk.
The ECS may also be of value as an epidemiological tool. For example, it might enable a more accurate comparison of cohorts undergoing VATS. In fact, some centres restrict the indication for VATS to early-stage lung cancer, whereas others include more advanced cases [19–22]. Applying the ECS score to patients undergoing VATS would indicate the risk of intraoperative conversion and facilitate comparisons with other cohorts. Other indicators (such as the Thoracoscore) are already used for this purpose [23]. The ECS is available online on the website of the French Society of Thoracic and Cardiovascular Surgery: https://www.sfctcv.org/epithor-conversion-score-english/.
The present study has several limitations. First, its retrospective design (an analysis of a 10-year period) induced both selection bias and temporal bias. The data were extracted from a declarative database, and the use of VATS (and thus the surgeon’s level of experience) increased over the study period. This bias was reduced by our use of (i) a validated, nationwide, multicentre prospectively indexed database and (ii) a validation cohort from 2020. This type of a retrospective design exposes the association between variables of interest and intraoperative conversion but not direct causality. However, it would be difficult to evaluate intraoperative conversion in a prospective study because this event is often hard to anticipate. Second, the declarative recording of data led to missing data (causing the exclusion of a certain number of patients) and prevented us from assessing certain variables of interest—notably the tumour site and the presence of pleural adhesions and/or calcified lymph nodes. Third, we chose to force the “previous thoracic surgery” variable (P = 0.54 in a univariate and P = 0.07 in a multivariate analysis) into the ECS because it had already been highlighted in the literature as a strong predictor of conversion [8]. Moreover, the Epithor database did not specify whether the previous surgery was ipsilateral or contralateral; this discrepancy might explain the variable’s borderline statistical significance because complications of dissection are more likely to occur with ipsilateral surgery than with contralateral surgery.
This score may be upgraded in the coming years, with the implementation of data regarding preoperative immunotherapy and preoperative radiotherapy and of data regarding expected technical difficulties (existence of adhesions, of fissure completeness and of calcified lymph nodes). Also, this study was focused on VATS procedures only, without subgroup analysis regarding port placement or approach, and excluding RATS procedures. Therefore, this score may be specifically adapted in further study for robotic-assisted thoracoscopic procedures and subgroups of video-assisted thoracoscopic procedures (uniportal, subxyphoid, subcostal).
The study’s main strength was its use of a validated national database that included data on a large number of preoperative variables in the largest series of patients undergoing VATS with anatomical lung resection and (in some cases) intraoperative conversion described to date.
In conclusion, we used a national database to identify 13 preoperative variables that were predictive of intraoperative conversion in a cohort of 8366 patients who had VATS with anatomical lung resection. The respective odds ratios of the variables enabled us to develop and validate an easy-to-use, reproducible score for estimating the risk of intraoperative conversion. Further research might confirm and improve the score’s qualities and thus enhance patient management in VATS.
Meeting presentation: the abstract of this manuscript was submitted to the 30th ESTS meeting.
The study was approved by the ethics committee of the French Society of Thoracic and Cardio-Vascular Surgery (reference: CERC-SFCTCV-2020-10-22-01-18FOAL) 22 October 2020.
Patient informed consent was obtained to gather the data that were extracted from the Epithor French national database (CNIL 809833).
ACKNOWLEDGEMENTS
The authors thank Jonathan Meynier for his assistance with the statistical analysis and David Fraser for the English revision.
Funding
No funding was received for this project.
Conflict of interest: None of the authors has any conflict of interest to declare related to this study.
Data Availability Statement
All relevant data are within the manuscript and its Supporting Information files.
REFERENCES
Abbreviations
- BMI
Body mass index
- ECS
Epithor conversion score
- FEV1
Forced expiratory volume in 1 s
- RATS
Robotic-assisted thoracoscopic surgery
- VATS
Video-assisted thoracoscopic surgery
