


Abstract

Indications of limited resection, such as segmentectomy, have recently been reported for patients with solid-predominant lung cancers ≤2 cm. This study aims to identify unfavourable prognostic factors using three-dimensional imaging analysis with artificial intelligence (AI) technology.
A total of 157 patients who had clinical N0 non-small cell lung cancer with a radiological size ≤2 cm, and a consolidation tumour ratio > 0.5, who underwent anatomical lung resection between 2011 and 2017 were enrolled. To evaluate the three-dimensional structure, the ground-glass nodule/Solid Automatic Identification AI software Beta Version (AI software; Fujifilm Corporation, Japan) was used.
Maximum standardized uptake value (SUVmax) and solid-part volume measured by AI software (AI-SV) showed significant differences between the 139 patients with adenocarcinoma and the 18 patients with non-adenocarcinoma. Among the adenocarcinoma patients, 42 patients (30.2%) were found to be pathological upstaging. Multivariable analysis demonstrated that high SUVmax, high carcinoembryonic antigen level and high AI-SV were significant prognostic factors for recurrence-free survival (RFS; P < 0.05). The 5-year RFS was compared between patients with tumours showing high SUVmax and those showing low SUVmax (67.7% vs 95.4%, respectively, P < 0.001). The 5-year RFS was 91.0% in patients with small AI-SV and 68.1% in those with high AI-SV (P = 0.001).
High AI-SV, high SUVmax and abnormal carcinoembryonic antigen level were unfavourable prognostic factors of patients with solid-predominant lung adenocarcinoma with a radiological size ≤2 cm. Our results suggest that lobectomy should be preferred to segmentectomy for patients with these prognostic factors.
INTRODUCTION
Recent developments in imaging modalities and the widespread use of low-dose helical computed tomography (CT) for the detection of lung cancer have contributed to the increase in the detection rate of small pulmonary lesions [1]. Ground-glass nodules (GGNs) are associated with a favourable prognosis and have been reported to indicate adenocarcinoma with a less invasive component [2]. In the TNM classification (8th edition), the size of GGNs is no longer considered to be a T factor [3]. In Japan, clinical trials using the consolidation tumour ratio (CTR) have been conducted, and the Japan Clinical Oncology Group (JCOG) 0201 study showed that a CTR of ≤0.25 in small-sized adenocarcinomas ≤2 cm could be used as a radiological criterion for a non-invasive pathology [4]. In addition, the JCOG0804 study, which was a nonrandomized confirmatory study of the effectiveness of limited surgical resection for patients with peripheral early lung cancer, validated the efficacy of partial resection for this population [5]. Furthermore, the results of the JCOG and the West Japan Oncology Group (WJOG) (JCOG0802/WJOG4607L) study demonstrated that a higher survival benefit of segmentectomy was evident for patients with radiologically solid-predominant tumours, which were 2 cm or less in diameter with a CTR of 0.5–1, compared with lobectomy [6]. However, lesions containing GGNs are sometimes difficult to measure precisely, such as GGNs showing a mosaic pattern with solid lesions or weak/high-density GGNs, because it is difficult to distinguish GGNs from the normal tissue. The measured values might hence be variable owing to the subjective nature of the measurement process.
In addition, positron emission tomography (PET) is essential for evaluating unfavourable prognostic factors as well as the lymph node status of patients with small-sized lung cancers [7]. The maximum standardized uptake value (SUVmax) is reported to be one such prognostic factor. A recently developed deep learning method using artificial intelligence (AI) technology enables the accurate determination of lymph node status in early-stage lung cancer patients using CT images [8]. Deep learning is one of the domains of machine learning, which in surgical practice provides promising opportunities to improve surgical performance and patient outcomes [9]. Moreover, the combination of findings on PET/CT and high-resolution CT (HRCT) has been shown to be more predictive of the malignancy of small-sized lung cancers, including lymph node metastasis than PET/CT or HRCT alone, and has even been shown to be useful for determining surgical procedures. Although the use of this combination has recently been recommended, it was not included in the evaluation factors of the JCOG0802/WJOG4607L trial. Furthermore, there are issues regarding the standardization of SUVs among different institutions and PET systems, as the results vary depending on the PET system used and the reconstruction method.
In this study, we aimed to analyse the unfavourable prognostic factors of patients with solid-predominant tumours ≤2 cm. In recent years, AI technology has made substantial progress, and hence, we decided to utilize GGN/Solid Automatic Identification AI software Beta Version (AI software; Fujifilm Corporation, Tokyo, Japan), which works on the Synapse Vincent System (Fujifilm Corporation) [10]. The software enables the analysis of data in three-dimensional (3D), and the automatic measurement of the percentage and volume of GGNs and solid tumours, without any variation among different measurement processes.
MATERIALS AND METHODS
Ethical statement
The Institutional Review Board of our hospital approved the protocol for data collection and analyses, and the need to obtain written informed consent from each patient was waived (study approval no: SH3951).
Patient cohort
A retrospective analysis was performed on patients chosen using the following inclusion criteria: (i) patients who underwent curative anatomical lung resection (lobectomy or segmentectomy) for non-small-cell lung cancer (NSCLC) at Tokyo Medical University Hospital between 2011 and 2017, (ii) patients who had clinical N0 NSCLCs ≤2 cm radiologically, with a CTR of 0.5–1, and (iii) patients who underwent 18F-fluorodeoxyglucose (FDG) PET/CT at the same institution for both evaluation of the primary tumour and for the evaluation of any metastatic lesions. The exclusion criteria were patients who received preoperative chemotherapy and/or radiotherapy. The preoperative stage was determined by HRCT, 18F-FDG PET/CT or endobronchial ultrasound-guided transbronchial needle aspiration followed by histological analysis. Clinical staging was performed based on the TNM classification (8th edition) [3, 11].
Detailed lymph node evaluation or patient follow-up is shown in the Supplementary Material.
Radiological evaluation
HRCT images of the whole lung were acquired using the settings previously described [12]. Briefly, HRCT images with a 1.25-mm thickness were obtained of the entire lung. The whole tumour size and solid tumour size were preoperatively measured on the HRCT images by highly experienced radiologists (Jinho Park and Takafumi Yamada). The solid tumour size was defined as the maximum dimension of the solid component of the lung window, excluding GGNs. The CTR (%) was defined as the maximum dimension of consolidation in the lung window setting divided by the maximum dimension of the tumour in the lung window setting.
Detailed radiological evaluation is shown in the Supplementary Material.
AI imaging analysis
After the results of conventional enhanced CT were transmitted to the Synapse Vincent system as digital imaging and communication in medicine data [13], AI software in the system automatically detected lung nodules in the bilateral lungs and AI software reconstructed the 3D images of the lungs and nodules (Fig. 1). AI software was subsequently able to distinguish between GGNs and radiologically solid lesions in the 3D images, once the target lung nodules were selected. The software determined the volumes of the GGNs, radiologically solid lesions and whole tumour lesions, as well as the ratios of GGNs or the radiologically solid lesions. Information about the maximum sizes of the radiologically solid lesions within the nodules was also obtained.
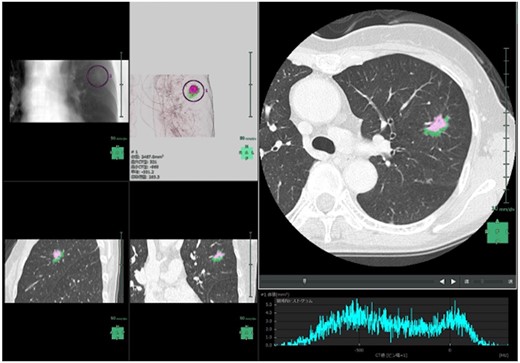
Screenshot of ground-glass nodule/Solid Automatic Identification AI Software Beta Version in the Synapse Vincent system. Pink: solid component; green: ground-glass nodule component.
Protocols of the GGN/Solid Automatic Identification AI Software Beta Version (AI software) in the Synapse Vincent system
The GGN/Solid Automatic Identification AI Software Beta Version is a developing software that works in the Synapse Vincent system. The software was not approved for clinical use at the time the study was conducted. The software uses 2 steps to analyse lung nodules using AI. First, the lung nodule detection algorithm is applied to the entire lung field within the imaging range, and a 3D bounding box of the nodule is detected. Next, the local volume image in each detected bounding box is automatically segmented into 3 parts, i.e. the surrounding anatomical structures (background) and the solid-part and the GGN part of the nodule. Then, the solid-part volume, the whole tumour volume, the ratio of the solid-part volume and the ratio of the GGN part volume are automatically calculated. This segmentation algorithm is based on 3D-Convolutional Neural Network using modified U-Net architecture. The network consists of 17 convolutional layers.
The training dataset for the GGN/solid-part segmentation algorithm was the total number of 357 patients with 1 lung nodule or more. Ground truth labels were prepared under the supervision of expert radiologists. In the training phase, 80% of the data was randomly chosen and used for actual training of the network. The rest of the data was used for validation. Segmentation performance was quantitatively evaluated by the metrics of recall and precision, using the data of 18 patients that were not used for the training. The recall was defined as the number of correctly predicted voxels by AI divided by the number of target ground truth voxels. Precision was defined as the number of correctly predicted voxels by AI divided by the sum of the number of target ground truth voxels and falsely predicted voxels by AI. The mean recall values were 0.698 for the GGO part and 0.904 for the solid part. The mean precision values were 0.676 for the GGO part and 0.888 for the solid part.
Detailed protocol is shown in the Supplementary Material.
Pathological analyses
Surgical specimens were reviewed by 2 experienced pathologists (Jun Matsubayashi and Toshitaka Nagao). TNM classification was performed according to the Union for International Cancer Control and the American Joint Committee on Cancer staging system (8th edition) [14]. Histopathological analyses were performed according to the World Health Organization criteria (4th edition) [15]. Detailed pathological evaluation is shown in the Supplementary Material.
Statistical analysis
The primary end point in this study was to identify radiological parameters associated with survival using the AI software. One of the secondary end points was to evaluate the radiological parameters of tumours categorized by histological characteristics, and the other was to assess whether conventional preoperative factors were associated with survival in this cohort. Overall survival (OS) and recurrence-free survival (RFS) were estimated using the Kaplan–Meier method, and differences in survival rates were determined by log-rank analysis. OS was defined as the time elapsed from the date of pulmonary resection to the date of death. RFS was defined as the time elapsed from the date of pulmonary resection to the date of the first recurrence or the last follow-up showing no recurrence. The last follow-up observation was censored if the patient was alive or lost to follow-up. As for recurrence patterns, detailed definition is shown in the Supplementary Material.
Receiver operating characteristic curve analysis was performed to assess the discrimination of the pathological staging performed using radiological parameters computed by PET/CT imaging and the AI software. The optimal cut-off points were defined using the curves closest to the upper left-hand corner, to separate the 2 categories using continuous variables for each parameter.
Continuous variables between 2 categories were analysed using the Mann–Whitney U-test when normality tests did not normally distribute variables. Univariable analysis for survival was performed among the different groups. In the multivariable analysis, the backward stepwise procedure was performed for preoperative variables such as radiological factors or carcinoembryonic antigen (CEA), using the Cox proportional hazards model to control for bias due to confounding. An adjusted significance level of 0.05 was used to exclude a variable from the model. The likelihood ratio test was performed to analyse interactions in terms of variables selected in the final model. All variables, including radiological parameters, CEA and pathological parameters, were available, although missing data were basically excluded from analysis.
Subgroup analysis was performed because histological differences might affect radiological profiles. Bonferroni P-value adjustment was used to control for multiple comparisons. A P-value of <0.025 was considered to indicate a statistically significant difference between groups in each analysis. Furthermore, the analysis was exploratory, and there was no prior planning to adjust for multiple comparisons; the P-values are interpreted as descriptive rather than confirmatory. All statistical calculations were performed using SPSS statistical software (version 27.0; SPSS, Inc., Chicago, IL, USA). Graphs were generated using GraphPad Prism (version 9.1.0.; GraphPad Software, San Diego, CA, USA) and SPSS statistical software.
RESULTS
Different clinical profiles between patients with adenocarcinoma and those with non-adenocarcinoma
We analysed 157 patients with resected NSCLCs, which were radiologically demonstrated to be solid-predominant nodules ≤2 cm. All nodules had CTR of 0.5–1.0. The characteristics of the patients are shown in Table 1. The number of patients with adenocarcinomas and non-adenocarcinomas was 139 and 18, respectively.
Patient characteristics and radiological factors (n = 157)
| Variable | Category | Number (%) | |
|---|---|---|---|
| Adenocarcinoma (n = 139) | Non-adenocarcinoma (n = 18) | ||
| Sex | Men | 65 (46.8) | 15 (83.3) |
| Women | 74 (53.2) | 3 (16.7) | |
| Median age, years (range) | 67.0 (38–86) | 74.5 (63–86) | |
| Smoking habit | Ever smoker/unknown | 78 (57.1) | 18 (100) |
| Never smoker | 61 (43.9) | 0 (0) | |
| CEA | ≤5.0 ng/ml | 121 (87.1) | 14 (77.8) |
| >5 ng/ml | 18 (12.9) | 4 (22.2) | |
| Tumour location | Right lung | 86 (61.9) | 9 (50.0) |
| Left lung | 53 (38.1) | 9 (50.0) | |
| Radiological whole tumour size, cm | Median (range) | 1.5 (0.7–2.0) | 1.55 (1.1–2.0) |
| Radiological solid-part size, cm | Median (range) | 1.3 (0.4–2.0) | 1.55 (1.1–2.0) |
| CTR | Median (range) | 1.0 (0.5–1.0) | 1.0 (1.0–1.0) |
| SUVmax | Median (range) | 2.9 (0.6–65.1) | 12.2 (3.3–25.1) |
| Radiological whole tumour volume, mm3 (AI software) | Median (range) | 1,214 (253–6,575) | 1,425 (515–5,188) |
| Radiological solid-part volume, mm3 (AI software) | Median (range) | 724 (0–4,523) | 1,242 (375–4,858) |
| Radiological solid-part volume ratio (AI software) | Median (range) | 67.2 (0–99.7) | 88.2 (72.9–98.6) |
| Radiological solid-part size, cm (AI software) | Median (range) | 1.3 (0–2.3) | 1.5 (1.0–2.1) |
| Surgical procedure | Lobectomy | 131 (94.2) | 18 (100) |
| Segmentectomy | 8 (5.8) | 0 (0) | |
| Adjuvant chemotherapy | Yes | 12 (8.6) | 1 (5.6) |
CEA: carcinoembryonic antigen; CTR: consolidation tumour ratio; SUVmax: maximum standardized uptake value.
Figure 2A illustrates that the median SUVmax was 2.9 [interquartile range (IQR): 1.5–7.0] in adenocarcinoma and 12.2 (IQR: 7.4–15.4) in non-adenocarcinoma with a statistically significant difference (P < 0.001). Figure 2B shows that the median solid-part volume measured by AI software (AI-SV) was 724 mm3 (IQR: 355–1301) in adenocarcinoma and 1242 mm3 (IQR: 802–1962) in non-adenocarcinoma, indicating a statistically significant difference (P = 0.022). Figure 2C demonstrates that the median ratio of AI-SV was 67.2% (IQR: 43.1–86.7) in adenocarcinoma and 88.2% (IQR: 79.8–91.8) in non-adenocarcinoma with a statistically significant difference (P < 0.001). In addition, the association between CTR and the ratio of AI-SV is shown in Fig. 2D, which indicated that the proportion of AI-SV were distributed from each CTR to various values. Supplementary Material, Fig. S1A and B illustrates 2 examples of part-solid GGNs with the same CTR of 1.0, to more clearly demonstrate the usefulness of AI software.

Distribution of maximum standardized uptake value (A), solid-part volume calculated by AI software (B) and ratio of solid-part volume calculated by AI software (C) in the Vincent system of patients with adenocarcinoma and non-adenocarcinoma. (D) Correspondence between ratio of solid-part volume calculated by AI software and consolidation tumour ratio.
These results indicated the radiologically different profiles of tumours on PET/CT and 3D-CT upon analysis using AI software. Therefore, we separately investigated the association between the pathological findings and radiological findings according to the histological type of the tumour (adenocarcinoma and non-adenocarcinoma).
Differences in pathological findings between adenocarcinoma and non-adenocarcinoma
Next, we reviewed the pathological features of adenocarcinoma and non-adenocarcinoma, as shown in Table 2. Non-adenocarcinoma included 16 patients with squamous cell carcinoma, and 4 patients (22.2%) had lymph node metastasis.
Pathological characteristics of the tumours (n = 157)
| Variable | Category | Number (%) | |
|---|---|---|---|
| Adenocarcinoma (n = 139) | Non-adenocarcinoma (n = 18) | ||
| Pathological whole tumour size, cm | Median (range) | 1.5 (0.7–5.0) | 1.8 (1.2–3.2) |
| Pathological invasive tumour size, cm | Median (range) | 1.0 (0.0–3.0) | 1.8 (1.2–3.2) |
| Histology | Sq | − | 16 (88.9) |
| Combined LCNEC | − | 1 (5.6) | |
| Adsq | − | 1 (5.6) | |
| Blood vessel invasion | Present | 42 (30.2) | 6 (33.3) |
| Lymphatic permeation | Present | 47 (33.8) | 7 (38.9) |
| Visceral pleural invasion | Present | 29 (20.9) | 3 (16.7) |
| Pulmonary metastasis (pm1) | Present | 4 (2.9) | 0 (0) |
| N status | N0 | 124 (89.2) | 14 (77.8) |
| N1 | 6 (4.3) | 3 (16.7) | |
| N2 | 9 (6.5) | 1 (5.6) | |
| Pathological stage | IA1–IA2 | 95 (69.3) | 11 (61.1) |
| IA3 | 4 (2.9) | 0 (0) | |
| IB | 22 (15.8) | 3 (16.7) | |
| IIA/IIB/IIIA | 16 (11.5) | 4 (22.2) | |
| EGFR mutation status | Mutant | 63 (45.3) | 0 (0) |
| Wild type | 55 (39.6) | 10 (55.6) | |
| Unknown | 21 (15.1) | 8 (44.4) | |
| ALK fusion gene | Positive | 2 (1.4) | 0 (0) |
Adsq: adenosquamous cell carcinoma; ALK: anaplastic lymphoma kinase; EGFR: epidermal growth factor receptor; LCNEC: large cell neuroendocrine carcinoma; Sq: squamous cell carcinoma.
In the 139 patients with adenocarcinoma, the median pathological whole tumour size and the median pathological invasive component size were 1.5 and 1.0 cm, respectively. Pulmonary metastasis was found in 4 patients (2.9%), and lymph node metastasis was found in 15 patients (10.8%). Pathological stage IA3, IB and II–IIII were observed in 4 patients (2.9%), 22 patients (15.8%) and 16 patients (11.5%), respectively. These results demonstrated that adenocarcinomas that were radiologically measured to be ≤2 cm are pathologically upstaged by 30.2%. We then investigated the preoperative prognostic factors, including 3D-CT findings upon AI software, in patients with adenocarcinoma.
Identifying factors associated with high malignancy potential in lung adenocarcinoma
Receiver operating characteristic curve analysis was performed to assess the accuracy of the pathological staging using the radiological parameters computed by PET/CT imaging and by AI software. The results of the calculations of the area under the curve (AUC) for tumours of pathological stages IA3 or higher showed that the optimal cut-off value of the SUVmax was 3.45 (AUC: 0.795; 95% CI: 0.722–0.868; P < 0.001; Supplementary Material, Fig. S2A); that of AI-SV was 1074 mm3 (AUC: 0.785; 95% CI: 0.710–0.860; P < 0.001; Supplementary Material, Fig. S2B); that of the AI-SV ratio was 74.5% (AUC: 0.842; 95% CI: 0.774–0.904; P < 0.001; Supplementary Material, Fig. S2C); that of whole tumour volume calculated by AI software (AI-WV) was 1436 mm3 (AUC: 0.673; 95% CI: 0.578–0.768; P < 0.001; Supplementary Material, Fig. S2D); and that of solid-part size of the tumour calculated by AI software was 14.0 mm (AUC: 0.731; 95% CI: 0.650–0.812; P < 0.001; Supplementary Material, Fig. S2E). We classified the patients with adenocarcinoma using these parameters to investigate prognostic factors.
Survival analysis of patients with adenocarcinoma and non-adenocarcinoma
The median follow-up period was 51.2 months (range: 8.1–93.2). The OS and RFS curves between adenocarcinoma and non-adenocarcinoma are shown in Supplementary Material, Fig. S3A and B. The 5-year OS was 92.2% in adenocarcinoma patients and 89.0% in patients with non-adenocarcinoma. The 5-year RFS was 82.9% in adenocarcinoma patients and 83.3% in patients with non-adenocarcinoma.
In patients with adenocarcinoma, univariable analysis showed that SUVmax, CEA, AI-WV, AI-SV and solid-part size of the tumour calculated by AI software were statistically significant factors associated with RFS, whereas CTR was not a statistically significant factor (Supplementary Material, Table S1). Multivariable analysis in model A showed that a high SUVmax and a high CEA were independent significant factors associated with RFS (P = 0.001 and P = 0.007, respectively; Table 3). The variables in model A consisted of preoperative factors analysed by univariable analysis, including SUVmax. Although SUV has been widely used as a semi-quantitative metric of uptake in FDG PET/CT, it is substantially affected by various factors, including PET/CT scanner specifications and reconstruction parameters [16]. Therefore, SUVmax is not an appropriate variable to utilize as a measurable standardized value among various institutions. To control for interinstitutional variability, we also performed multivariable analysis in model B using the radiological parameters excluding SUVmax. The results demonstrated that a high AI-SV and a high CEA were significant independent factors associated with RFS (P = 0.023 and P = 0.019, respectively; Table 4).
Multivariable analysis of model A for recurrence-free survival in lung adenocarcinoma patients (n = 139)
| Variable | Multivariable analysis | |||
|---|---|---|---|---|
| Hazard ratio | 95% CI | P-value | ||
| CEA | >5.0 | 3.44 | 1.39–8.47 | 0.007 |
| SUVmax | >3.45 | 8.56 | 2.53–28.9 | 0.001 |
| Variable | Multivariable analysis | |||
|---|---|---|---|---|
| Hazard ratio | 95% CI | P-value | ||
| CEA | >5.0 | 3.44 | 1.39–8.47 | 0.007 |
| SUVmax | >3.45 | 8.56 | 2.53–28.9 | 0.001 |
CEA, carcinoembryonic antigen; CI: confidence interval; SUVmax, maximum standardized uptake value.
Multivariable analysis of model B for recurrence-free survival in lung adenocarcinoma patients (n = 139)
| Variable | Multivariable analysis | |||
|---|---|---|---|---|
| Hazard ratio | 95% CI | P-value | ||
| CEA | >5.0 | 3.05 | 1.20–7.76 | 0.019 |
| AI-SV | >1074 mm3 | 2.81 | 1.15–6.87 | 0.023 |
| Variable | Multivariable analysis | |||
|---|---|---|---|---|
| Hazard ratio | 95% CI | P-value | ||
| CEA | >5.0 | 3.05 | 1.20–7.76 | 0.019 |
| AI-SV | >1074 mm3 | 2.81 | 1.15–6.87 | 0.023 |
AI-SV: solid-part volume analysed by AI software; CEA: carcinoembryonic antigen; CI: confidence interval.
Next, survival analysis of patients with lung adenocarcinoma was performed using each preoperative prognostic factor in Fig. 3. The 5-year RFS was 91.0% in the group with AI-SV ≤1074 mm3 and 68.1% in the group with AI-SV >1074 mm3 (Fig. 3A). The 5-year RFS was 86.7% in the group with normal CEA level and 54.6% in that with high level (Fig. 3B). The 5-year RFS was 95.4% in the group with SUVmax ≤3.45 and 67.7% in the group with SUVmax >3.45 (Fig. 3C). There were statistically significant differences in the RFS among the groups (P = 0.001, P = 0.001 and P < 0.001, respectively, Fig. 3A–C). The association between the pattern of initial recurrence and each radiological prognostic factor is shown in Supplementary Material, Table S2. The ratios of local recurrence, including both distant and local recurrence, were 19%, 14% and 10% in patients with high SUVmax, high AI-SV and high CEA, respectively.
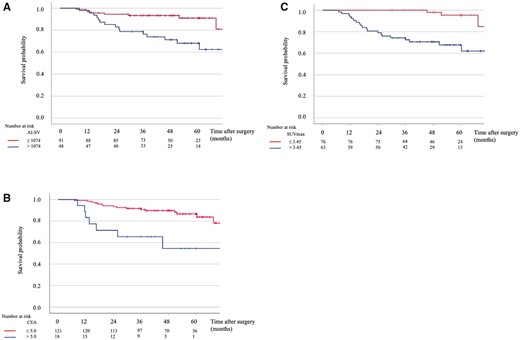
Recurrence-free survival curves based on solid-part volume calculated by AI software (A), carcinoembryonic antigen (B) and maximum standardized uptake value (C).
Finally, the result of competing risk analysis with mortality is illustrated in Fig. 4. The cumulative incidence of mortality at 5 years was 5.6% for lung cancer-specific deaths and 3.4% for non-lung cancer-specific deaths in the cohort of lung adenocarcinoma.
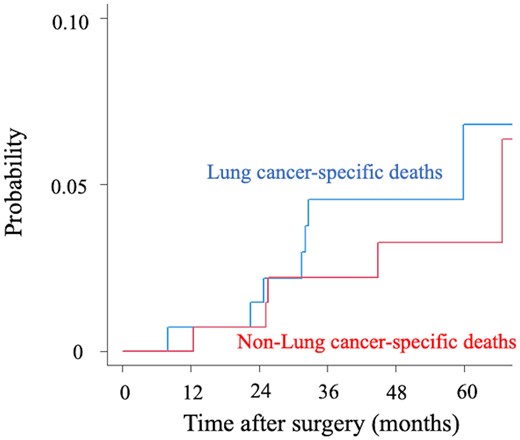
The cumulative incidence of mortality between lung cancer-specific deaths and non-lung cancer-specific deaths in the cohort of lung adenocarcinoma.
DISCUSSION
In this study, we analysed the preoperative prognostic factors for solid-predominant lung cancers ≤2 cm using AI software as well as by conventional methods. Our results demonstrated that (i) the objective parameter that was calculated by AI software, i.e. solid tumour volume, was able to predict an unfavourable prognosis, (ii) high SUVmax and abnormal CEA level were also unfavourable prognostic factors, and (iii) SUVmax values were high in almost all non-adenocarcinomas, and ∼20% of the patients had lymph node metastasis.
Recently, the JCOG0802/WJOG4607L study demonstrated that segmentectomy resulted in more favourable survival rates compared with lobectomy in patients with peripheral solid-predominant lung cancers ≤2 cm [5-year OS: 94.3% (segmentectomy) vs 91.1% (lobectomy), P = 0.0082] [6]. Segmentectomy is generally reported to be more favourable than lobectomy owing to the preservation of lung function [17]. However, the trial showed only a difference of 3.5% in postoperative 1-year pulmonary function between patients who underwent segmentectomy and those who underwent lobectomy, indicating that one of the secondary end points was unmet [6].
AI software can objectively evaluate GGN lesions and solid lesions in 3D images. Peripheral solid-predominant lung cancers ≤2 cm in the JCOG0802/WJOG4607L study had the crucial inclusion criteria of ‘0.5 < CTR ≤ 1’. As the CTR is calculated from the maximum tumour diameter and the diameter of the solid component in 2D images, the CTR has limitations as a measurement for 3D tumours. Furthermore, lesions containing GGNs, such as GGNs showing a mosaic pattern with solid lesions or weak/high-density GGNs, are sometimes difficult to measure precisely because of the difficulty in distinguishing GGNs from normal tissue. The measured values might hence be variable owing to the subjective nature of the measurement process. Many clinicians have generally experienced that GGN lesions are challenging to measure accurately, and subjective factors of the physicians may affect the measurement of lesions containing GGNs.
Recent studies demonstrated that radiologically pure-solid tumours in small lung cancers are an unfavourable prognostic factor [18]. None of the patients showed an AI-SV ratio of 100% in our cohort, because AI software calculated the AI-SV ratio of radiologically pure-solid tumours as ∼95–99%. However, multivariable analysis did not identify AI-SV ratio as a statistically significant prognostic factor. In contrast, AI-SV was a poor prognostic factor based on our multivariable analysis. We assume that the volume of the solid component more directly reflects malignant potential associated with prognoses, such as the predominant subtype of adenocarcinoma and lymphovascular invasion, than the ratio of solid volume to whole tumour volume. In TNM classification (8th edition), ‘size of solid-part’ in part-solid GGNs represents a pathological variable for differential diagnoses, such as adenocarcinoma in situ, minimally invasive adenocarcinoma and lepidic adenocarcinoma, whereas the ratio of the solid-part size to whole tumour size is not mentioned [3]. Furthermore, to understand the difference between solid-part volume and ratio of solid-part volume, 2 different-sized spherical tumours can be imagined, in which one has an overall diameter of 2 cm with a solid-part of 1 cm in diameter and the other has an overall diameter of 1 cm and a solid-part of 0.5 cm in diameter. The ratio of solid-part volume to whole tumour volume is the same for both tumours. However, the solid-part volume of the former tumour is 8 times larger than that of the latter. Some reports demonstrated that the solid-part volume of the tumour is a prognostic factor of small-sized lung adenocarcinoma [19]. As our study has shown, AI software can minimize human errors in measurement and provide objective data associated with survival, including AI-SV, which will lead to decisions of surgical procedures, such as segmentectomy or lobectomy.
The essential points of segmentectomy were resection of both the affected and adjacent segments together to obtain an adequate surgical margin, and intraoperative analysis of the segmental, hilar and mediastinal lymph nodes to confirm N0 disease [20]. Tsutani et al. [21] defined N0 criteria as having a solid tumour size <0.8 cm and SUVmax <1.5, and they suggested that patients who did not meet the N0 criteria should undergo segmentectomy or lobectomy with systematic hilar and mediastinal lymph node dissection rather than wedge resection, because of the possibility of lymph node metastasis. Analysis of frozen sections of intraoperative dissected lymph nodes is recommended when segmentectomy is performed on patients who do not meet the N0 criteria. If lymph node metastasis is intraoperatively identified, the procedure should be converted to lobectomy. In practice, however, it might be difficult to examine all intralobar or lobar lymph nodes when performing segmentectomy, incredibly complex segmentectomy. Therefore, an accurate preoperative diagnosis is crucial in determining the indication for segmentectomy.
Limitations
There are some limitations to this study. First, this was a retrospective review of patients from a single institute. The small patient groups, particularly for patients with non-adenocarcinoma, might have introduced bias. Furthermore, interobserver variability in calculating the radiological parameters cannot be ignored. The border of the GGN can be very obscure, and hence, estimation of tumour size can vary considerably. In Table 3, multivariable analysis ‘model A’ showed that the 95% CI of SUVmax was very large. The collinearity was not strong, as the variance inflation factor of SUVmax was 1.23. The small sample size might induce a large CI. Moreover, the cut-off point for AI-WV should be interpreted very cautiously as the AUC of the AI-WV was pretty poor (0.67, 95% CI: 0.58–0.77). Finally, most patients underwent lobectomy, and segmentectomy was performed in only 8 patients, who were postoperatively confirmed to have no metastatic lymph nodes. Therefore, it is not possible to discuss whether our results can be applied to patients undergoing segmentectomy. Even though our study identified unfavourable prognostic factors for RFS in patients who underwent lobectomy, we believe that lobectomy was the correct choice, or segmentectomy might have achieved comparable results for patients with a high AI-SV, high SUVmax or abnormal CEA level.
CONCLUSION
In conclusion, AI software can provide surgeons with radiologically quantified values in 3D of small-sized lung nodules. High AI-SV, high SUVmax and abnormal CEA level were found to be unfavourable prognostic factors in patients with adenocarcinomas showing radiologically solid-predominant lung cancers ≤2 cm. Indications for segmentectomy should be reappraised in patients with these factors. Prospective multi-institutional studies are warranted to validate the association between these radiological features and outcomes. In the future, more precise preoperative assessment of malignancy is expected to become possible by integrating AI software analysis with PET/CT.
SUPPLEMENTARY MATERIAL
Supplementary material is available at EJCTS online.
ACKNOWLEDGEMENTS
The authors are indebted to the medical editors of the Department of International Medical Communications for editing and reviewing the English manuscript.
Funding
Norihiko Ikeda reports research grant to the Department of Surgery, Tokyo Medical University from FUJIFILM Corporation.
Conflict of interest: Susumu Takeuchi reports receiving personal lecture fees from AstraZeneca, Taiho, Ono, Nippon Kayaku, Kyowa Kirin, Eli Lilly and Company Japan, Bristol Myers Squibb, Novartis Japan, MSD K.K. and Chugai Pharmaceutical Company Limited. The other authors declare no competing interests.
Data Availability Statement
The analysed data in this article will be shared on reasonable request to the corresponding author, except for the training and validation dataset for the GGN/solid-part segmentation algorithm by AI software.
Author contributions
Yujin Kudo: Conceptualization; Data curation; Formal analysis; Investigation; Writing—original draft; Writing—review & editing. Yoshihisa Shimada: Conceptualization; Writing—review & editing. Jun Matsubayashi: Data curation; Investigation. Yoshiro Kitamura: Software; Writing—review & editing. Yojiro Makino: Data curation. Sachio Maehara: Data curation. Masaru Hagiwara: Data curation. Jinho Park: Data curation; Investigation; Supervision. Takafumi Yamada: Data curation; Investigation. Susumu Takeuchi: Data curation. Masatoshi Kakihana: Data curation. Toshitaka Nagao: Data curation; Investigation; Supervision. Tatsuo Ohira: Supervision. Jun Masumoto: Software; Supervision; Writing—review & editing. Norihiko Ikeda: Conceptualization; Supervision; Writing—review & editing.
Reviewer information
European Journal of Cardio-Thoracic Surgery thanks J Matthew Reinersman and the other, anonymous reviewer(s) for their contribution to the peer review process of this article.
REFERENCES
Travis WD, Brambilla E, Burke A, Marx A, Nicholson AG,
ABBREVIATIONS
- 3D
3-Dimensional
- AI
Artificial intelligence
- AI-SV
Solid-part volume calculated by AI software
- AI-WV
Whole tumour volume calculated by AI software
- AUC
Area under the curve
- CEA
Carcinoembryonic antigen
- CT
Computed tomography
- CTR
Consolidation tumour ratio
- FDG
Fluorodeoxyglucose
- GGNs
Ground-glass nodules
- HRCT
High-resolution computed tomography
- JCOG
Japan Clinical Oncology Group
- NSCLC
Non-small-cell lung cancer
- OS
Overall survival
- PET
Positron emission tomography
- RFS
Recurrence-free survival
- SUVmax
Maximum standardized uptake value
- WJOG
West Japan Oncology Group
