


Abstract

The effect of aortic haemodynamics on arterial wall properties in ascending thoracic aortic aneurysms (ATAAs) is not well understood. We aim to delineate the relationship between shear forces along the aortic wall and loco-regional biomechanical properties associated with the risk of aortic dissection.
Five patients with ATAA underwent preoperative magnetic resonance angiogram and four-dimensional magnetic resonance imaging. From these scans, haemodynamic models were constructed to estimate maximum wall shear stress (WSS), maximum time-averaged WSS, average oscillating shear index and average relative residence time. Fourteen resected aortic samples from these patients underwent bi-axial tensile testing to determine energy loss ) and elastic modulus () in the longitudinal (, and circumferential (,directions and the anisotropic index (for each parameter. Nine resected aortic samples underwent peel testing to determine the delamination strength (. Haemodynamic indices were then correlated to the biomechanical properties.
A positive correlation was found between maximum WSS and and (. Increasing maximum time-averaged WSS was found to be associated with increasing ( and (Average oscillating shear index positively correlated with (. No significant relationship was found between any haemodynamic index and , or between relative residence time and any biomechanical property.
Shear forces at the wall of ATAAs are associated with local degradation of arterial wall viscoelastic hysteresis ( and delamination strength, a surrogate for aortic dissection. Haemodynamic indices may provide insights into aortic wall integrity, ultimately leading to novel metrics for assessing risks associated with ATAAs.
INTRODUCTION
Ascending thoracic aortic aneurysms (ATAAs) affect 10/100 000 persons per year and are associated with an increased risk of aortic dissection or rupture [1]. Improving the estimation of this risk for the individual patient beyond measurements of maximal diameter is crucial for optimizing the timing of elective surgery [2, 3]. Multifactorial considerations include hereditary aortic disorders, family history of dissection and aortic growth rate. Our previous work on the material properties of ATAAs demonstrated that increasing age, larger aneurysm size, hypertension and having a tricuspid aortic valve were associated with unfavourable aortic wall biomechanics [4]. We further identified the biomechanical property energy loss ), a quantification of efficiency in performing the Windkessel function, to be a marker of the aortic wall’s propensity for dissection [4, 5].
It has been hypothesized that the haemodynamics within ATAAs may contribute to the composition of the arterial wall, thereby altering aortic biomechanics. Flow-induced shear stresses impact the endothelial cells of the arterial wall through mechanotransduction [6, 7]. Patients with ATAA are known to have unique flow characteristics with helical flow, jet impingement and increased wall shear stress (WSS) [8–10]. Previous studies have suggested a relationship between haemodynamic indices, namely WSS and computationally calculated aortic stiffness [11]. Guzzardi et al. [12] found that regions of increased WSS corresponded to extracellular matrix dysregulation, including increased matrix metalloproteinases. Multiple groups have investigated the association of aortic valve phenotypes and their different ensuing flow fields with changes in matrix metalloproteinase expression and elastic fibre thinning [13–16]. However, evidence that the above associations of WSS directly translate into altered aortic wall biomechanics is lacking. Furthermore, which biomechanical properties are affected by haemodynamics and how they are affected are poorly understood.
This study aims to elucidate the relationship between the haemodynamics and solid mechanics of ATAAs through patient-specific computational fluid dynamics (CFD) modelling and mechanical testing of aortic tissue. In the process, we aim to identify haemodynamics-based metrics for evaluating the risk of rupture and dissection in patients with ATAA.
PATIENTS AND METHODS
Ethical statement
This study was approved by the University Health Network Research Ethics Board. The approval number assigned by this board was 16-6285. Consent was obtained from all participating patients.
Study population
Five patients undergoing elective ascending aortic aneurysm repair (March 2017–December 2020), underwent preoperative magnetic resonance imaging (MRI). Subsequently, aortic specimens were obtained during their surgery. Medical charts were reviewed prospectively to collect relevant patient information.
MRI
All MRI scans were performed on a 3-T scanner (Magnetom Prisma; Siemens Healthcare, Erlangen, Germany). An electrocardiogram gated magnetic resonance angiogram sequence was performed to delineate patients' aortic geometry. A four-dimensional MRI (4DMRI) sequence was employed to measure flow within the aorta. The acquisition protocol for the 4DMRI consisted of a spatial resolution of 2.4 × 2.4 × 2.5 mm3, field of view = 380 mm and velocity encoding = 150 cm/s. All 4DMRI data were corrected for phase offset errors and extracted using GTFlow (GyroTools, LLC, Zurich, Switzerland).
Patient-specific computational modelling
Figure 1A–C illustrates the computational methodology. Patient-specific CFD models of the ATAAs were constructed. Thoracic aortic geometries were segmented from preoperative magnetic resonance angiogram images using the open-source software ITK-Snap [17]. The smoothed post-processed patient-specific models were discretized into computational meshes with SimVascular [18]. Mesh independence studies were carried out on each patient and the resulting mesh densities ranged from 9.2 to 12 million elements.
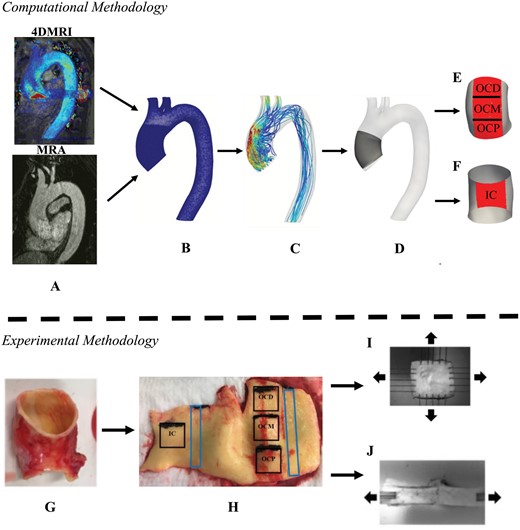
(A) Preoperative magnetic resonance angiogram and four-dimensional magnetic resonance imaging image sequences of the thoracic aorta utilized for computational modelling. (B) Computational mesh derived from magnetic resonance angiogram/four-dimensional magnetic resonance imaging images. (C) Flow field calculated from computational fluid dynamics. The ascending thoracic aortic aneurysm (D) was divided into areas of interests: (E) outer curvature proximal, outer curvature middle and outer curvature distal, and (F) inner curvature. (G) Complete ring of resected aorta. (H) Squares were sampled for (I) bi-axial tensile testing and rectangles were sampled for (J) delamination testing.
Flow was simulated by solving the Navier–Stokes equations using the SimVascular's finite element solver. Blood was assumed to be an incompressible, Newtonian fluid with a kinematic viscosity of 0.004 kg/ms and the density of 1060 kg/m3. Patient-specific velocity profiles were extracted from the patients' preoperative 4DMRI scans and imposed at the inlet boundary, which allowed for the characteristically helical flow of the ATAAs to be resolved. At the outlet boundaries, three-element Windkessel models were employed to mimic the resistance of the downstream vasculature [19]. Transient laminar simulations were conducted for 6 cardiac cycles with a timestep size of <1 ms. Six cardiac cycles were simulated to ensure a periodic solution was reached; but only results from the sixth cycle were used for analysis. To quantify the effect of haemodynamics on the arterial wall multiple indices were computed, namely, WSS, time-averaged (), oscillating shear index () and relative residence time (). WSS is the defined as the tangential force per unit area exerted at the arterial wall by blood flow. is the average WSS throughout 1 cardiac cycle. is the degree of shear reversal in a pulsatile flow [20]. is a measure of disturbed flow that quantifies residence time of solutes of the blood [21]. All relevant formulae of the computed haemodynamic indices are provided in Supplementary Material, Appendix S1.
Mechanical testing
Mechanical testing was conducted on resected ATAA tissue samples to determine patient-specific loco-regional biomechanical measurements. During each patient's operation, a complete ring of the ascending aorta was resected, placed into Ringer’s lactate solution and transported to the laboratory. All specimens were kept on ice or refrigerated until testing; testing was completed within 24 h of the patient's operation.
Square samples (14 mm × 14 mm) were removed from the specimen's outer curvature (OC) and inner curvature (IC). Depending on the specimen's size, up to 3 samples were extracted longitudinally from the OC and 1 sample was extracted from the IC (Fig. 1H). Bi-axial tensile testing was completed on the square samples, each sample was subjected to 10 preconditioning stretch cycles followed by 3 analysed cycles under 25% equibiaxial strain using a BioTester (CellScale, Waterloo, Canada) (Fig. 1I). The tangent modulus of elasticity at 10% strain () and energy loss () was calculated in the longitudinal (, and circumferential directions (, from the generated stress–strain curve. is the ability for the aortic wall to resist elastic deformation and is the relative amount of energy lost during the loading and unloading of the aortic wall [5]. The anisotropy index () was calculated for both and . is a representation of the variation of the magnitude of a property in the longitudinal and circumferential directions.
Delamination testing was performed on rectangular samples (6 mm × 30 mm) extracted from the OC and IC to derive delamination strength (), a metric of the propensity for aortic dissection [4]. These samples were mounted on the BioTester and delaminated by peeling apart the medial layer proximally to distally along the aorta (Fig. 1J). All formulae for computed biomechanical properties provided in Supplementary Material, Appendix S1.
Comparison of haemodynamic indices with arterial wall biomechanical properties
The area of interest (AOI) in each computational model's ascending aorta was localized to represent each aortic sample from each aortic specimen (Fig. 1D–F). The AOI was selected to be larger than the aortic specimen to account for shrinkage due to the aortic specimen not being pressurized. Manual verification against photographs taken at the time of tissue sampling for the biomechanical tests was performed as a final check. The AOIs were finalized prior to initiation of any comparative statistical analysis.
Statistical analysis
All variables were checked for normality using the Shapiro–Wilk test, values with a normal distribution were summarized using mean ± SD and skewed distributions were summarized using median and range. The 90% percentile of and was defined as the maximum () and maximum (, respectively. The 90th percentile was selected to ensure robustness against outliers. The correlation between haemodynamic indices (, , ) with biomechanical properties (, , ) was assessed by Spearman’s rank correlation coefficient. Correlations were considered statistically significant when the -value was <0.05. All statistical analyses were performed using JASP (JASP Team (2020), Version 0.14.1). All relevant data are within the manuscript and its Supplementary Material files.
RESULTS
Patient demographics
The mean age of the 5 patients was 61 ± 11 years and 4 were male (Table 1). Two patients had a bicuspid aortic valve. The maximal aortic diameter in the ascending aorta (Dmax) ranged from 36 to 63 mm with a mean of 47 ± 10 mm.
Patient demographics
| Patient | Age | Sex | Valve phenotype | Valve function (≥ moderate) | Maximal diameter of ascending aorta (mm) | |
|---|---|---|---|---|---|---|
| AS | AR | |||||
| 1 | 46 | M | BAV | − | − | 42a |
| 2 | 59 | M | TAV | − | + | 47 |
| 3 | 58 | M | BAV | − | − | 49 |
| 4 | 79 | F | TAV | − | + | 63 |
| 5 | 64 | M | TAV | − | + | 36a |
AR: aortic valve regurgitation; AS: aortic valve stenosis; BAV: bicuspid aortic valve; F: female; M: male; TAV: tricuspid aortic valve.
Indication for surgery was aortic root aneurysm.
Haemodynamic indices
Haemodynamic indices were calculated at the AOI for each patient (Table 2). The ranged from 47.82 to 220.21 dyne/cm2 with a mean of 125.46 ± 54.43 dyne/cm2. The contour was generated for each patient (Fig. 2A), and the ranged from 9.90 to 33.32 dyne/cm2, with a mean of 20.93 ± 6.21 dyne/cm2. There did not appear to be a consistent pattern in or based on spatial location along the ATAA alone. WSS on the IC could either be lower or similar to the WSS on the OC, and WSS could either be higher or lower proximally compared with distally along the OC. Dmax strongly correlated with both (Fig. 3F) and (Fig. 4F).
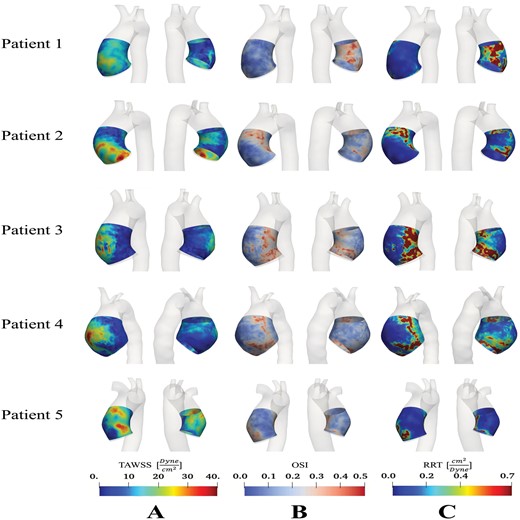
Distribution of (A) time-averaged wall shear stress; (B) oscillating shear index; and (C) relative residence time in the ascending thoracic aortic anerusym patient cohort.
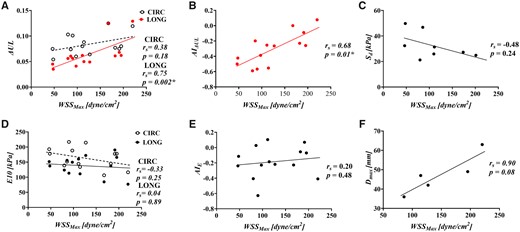
Correlation of maximum wall shear stress with (A) energy loss (), (B) the anistropic index for, (C) delamination strength, (D) tangent modulus of eleasticity (), (E) the anistropic index for and (F) maximal ascending aortic diameter.
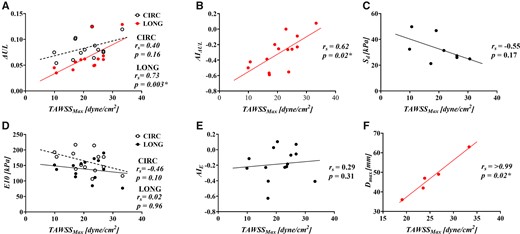
Correlation of maximum time-averaged wall shear stress with (A) energy loss (), (B) the anistropic index for, (C) delamination strength, (D) tangent modulus of eleasticity (), (E) the anistropic index for and .
Haemodynamic indices along patients’ ascending aortas
| Patient | Location | ||||
|---|---|---|---|---|---|
| 1 | OCD | 97.45 | 16.37 | 0.14 | 0.13 |
| OCM | 127.11 | 23.55 | 0.08 | 0.07 | |
| OCP | 111.14 | 20.39 | 0.14 | 0.13 | |
| IC | 47.82 | 10.63 | 0.28 | 2.08 | |
| 2 | OCD | 89.97 | 17.12 | 0.19 | 0.18 |
| OCP | 114.44 | 23.86 | 0.08 | 0.07 | |
| IC | 79.81 | 17.22 | 0.19 | 0.22 | |
| 3 | OCD | 182.28 | 26.83 | 0.06 | 0.06 |
| OCM | 191.16 | 26.82 | 0.16 | 0.14 | |
| OCP | 195.35 | 25.02 | 0.15 | 0.18 | |
| IC | 46.45 | 9.90 | 0.23 | 1.06 | |
| 4 | OCD | 220.21 | 33.32 | 0.08 | 0.06 |
| OCP | 167.46 | 22.93 | 0.18 | 0.29 | |
| 5 | OCM | 85.75 | 19.06 | 0.22 | 0.34 |
IC: inner curvature; OCD: outer curvature distal; OCM: outer curvature middle; OCP: outer curvature proximal; OSI: oscillating shear index; RRT: relative residence time; TAWSS: time-averaged wall shear stress; WSS: wall shear stress.
The average ranged from 0.06 to 0.28 with a mean of 0.16 ± 0.06, and contours are displayed in Fig. 2B. No pattern was observed between and the spatial location along the ATAA or with the maximal aortic diameter
showed very similar trends to , with elevated values of corresponding to the same regions of elevated (Fig. 2C). Notably, patients 1 and 3, who exhibit a bicuspid aortic valve phenotype, experienced particularly elevated levels of on their ICs. These were also the 2 patients who did not have aortic regurgitation in our cohort. Average ranged from 0.06 to 2.08 cm2/dyne with a median of 0.16 cm2/dyne.
Biomechanical properties
Table 3 outlines the biomechanical properties obtained from bi-axial tensile testing for the patient cohort. ranged from 0.035 to 0.129, with a mean of 0.064 ± 0.027 and a median of 0.058. and showed no pattern when comparing the OC to the IC or proximal samples to distal samples. ranged from −0.59 to 0.077 with a mean of −0.303 ± 0.20. A negative indicates that is greater than . All patients exhibited a negative , except patient 4 which had similar levels of and IC samples tended to have more negative than OC samples.
Biomechanical properties of ascending aortic wall measured from bi-axial tensile testing
| Patient | Location | |||||||
|---|---|---|---|---|---|---|---|---|
| 1 | OCD | 0.06 | 0.041 | −0.388 | 188.25 | 149.60 | −0.229 | 31.40 |
| OCM | 0.064 | 0.049 | −0.265 | 214.43 | 172.06 | −0.219 | ||
| OCP | 0.08 | 0.062 | −0.255 | 144.42 | 160.22 | 0.104 | ||
| IC | 0.054 | 0.035 | −0.423 | 177.77 | 137.21 | −0.115 | 49.80 | |
| 2 | OCD | 0.1 | 0.056 | −0.568 | 216.86 | 113.33 | −0.627 | 25.95 |
| OCP | 0.088 | 0.0498 | −0.554 | 134.01 | 111.28 | −0.185 | ||
| IC | 0.103 | 0.056 | −0.590 | 138.74 | 123.73 | −0.406 | 21.24 | |
| 3 | OCD | 0.077 | 0.061 | −0.228 | 145.31 | 137.49 | −0.055 | 27.31 |
| OCM | 0.075 | 0.068 | −0.094 | 177.43 | 190.25 | 0.070 | ||
| OCP | 0.08 | 0.062 | −0.261 | 177.87 | 165.80 | −0.070 | ||
| IC | 0.075 | 0.045 | −0.496 | 192.73 | 151.59 | −0.239 | 32.37 | |
| 4 | OCM | 0.112 | 0.129 | 0.077 | 116.39 | 76.85 | −0.409 | 24.89 |
| OCP | 0.125 | 0.125 | 0.000 | 106.46 | 84.68 | −0.228 | ||
| 5 | OCM | 0.074 | 0.061 | −0.199 | 151.65 | 155.79 | 0.027 | 46.79 |
IC: inner curvature; OCD: outer curvature distal; OCM: outer curvature middle; OCP: outer curvature proximal.
The ranged from 76.85 to 216.86 kPa, with a mean of 163.02 ± 31.51 kPa for and a mean of 137.85 ± 31.51 kPa for . ranged from −0.627 to 0.104 with a mean of −0.184 ± 0.195. No clear pattern between OC and IC or between proximal and distal samples was seen for , or
Table 3 summarizes the for each patient; ranged from 21.24 to 49.80 mN/mm with a mean of 32.47 ± 9.74 mN/mm. No clear relationship was observed between maximal aortic diameter and .
Comparing haemodynamic indices and biomechanical properties
The haemodynamic indices of Table 2 were correlated with the biomechanical properties of Table 3. W significantly correlated with ( and ( (Fig. 3A and B). No statistically significant correlations were found between and , or (Fig. 3). significantly correlated with ( and ( (Fig. 4A and B). No statistically significant correlations were found between and or (Fig. 4). Average and average did not significantly correlate with (Fig. 5).
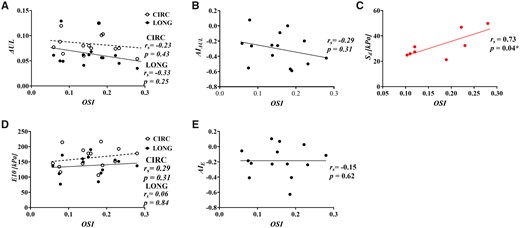
Correlation of average oscilliating shear index with (A) energy loss (), (B) the anistropic index for, (C) delamination strength, (D) tangent modulus of eleasticity () and (E) the anistropic index for
No significant correlation was found between and with (Fig. 3C/Fig. 4C). Average OSI positively correlated with ( (Fig. 5C). Average RRT did not significantly correlate with . All correlations can be found in Supplementary Material, Appendix S2.
DISCUSSION
Comparisons of CFD-derived haemodynamic indices of ATAAs and experimentally derived aortic wall biomechanical properties revealed important findings. We demonstrated significant correlations between average and , a surrogate marker of resistance to aortic dissection and, between WSS and energy loss (), a measure of viscoelastic hysteresis. These associations directly link haemodynamic shear forces with the structural integrity of the aortic wall. This sheds light on the significance of WSS in the ascending aorta, which has significant implications for exploratory research protocols that use this parameter. Also, within the limitations of a small sample size, this study supports potential future clinical use of haemodynamic indices for dissection risk prediction. Furthermore, our observation that haemodynamic indices co-locate with aortic wall biomechanical properties in severity lends evidence to there being at least a partial effect of haemodynamic forces on aortic wall vulnerability.
describes the aortic wall’s ability to perform the Windkessel function and increasing was previously found to be associated with decreased elastin content in the arterial wall. The greater the , the more energy is lost per cardiac cycle due to deleterious microstructural changes, and the more susceptible the tissue is to delamination, a mechanical test for propensity for dissection [4]. We identified regions of elevated WSS to be associated with regions of elevated . This is in line with our observations that directly correlated with maximal ascending aortic diameters. These results also align nicely with the literature that has found that regions of elevated WSS are associated with elastic fibre thinning and separation [12, 16]. On the other hand, our results are in contrast to the findings of Condemi et al. [22], the only other study we are aware of that directly compares haemodynamic indices with aortic wall biomechanics. They suggest that low and have negative effects on aneurysm strength, as measured by bulge inflation testing and elastic modulus [22]. The discrepancy may arise due to the mode of failure being investigated. Bulge inflation testing measures rupture strength, which one may hypothesize to be more related to collagen content and, therefore, aortic stiffness/elastic modulus. However, the mode of failure in the ascending aorta is rarely sudden rupture of all layers of the aortic wall, but rather partial thickness injury and delamination plane propagation. Therefore, , which we previously validated against controls of normal aortas and aortas that have had acute dissection, is in our estimation, the more appropriate failure test [4]. We also previously found elastic modulus to be a poor marker of delamination strength [4].
Our study also found a relationship between and with . is a measure of the directionality of a measurement; an < 0 indicates that the tissue has a larger in the circumferential direction than in the longitudinal direction. These results indicate that as WSS increases, the magnitude of in the circumferential and longitudinal direction approach each other and AI approaches zero. Our previous work showed that as approached zero there is greater medial degeneration and less [4, 23]. This again supports the concept of elevated WSS as having a negative effect on aortic wall biomechanics.
Correlation of haemodynamic indices with delamination strength was limited because delamination testing samples span a larger area and loco-regional effects are harder to parse out (beyond IC and OC). Interestingly, increasing average correlated with increasing delamination strength. Low indicates continuous impinging or channelling flow that would potentially correspond to regions which experience continuously high levels of shear, leading to a degradation of the arterial wall. This result is in contrast to the findings of Hohri et al. [24], who found that pre-onset elevated values of was closely associated with the future site of aortic dissection. However, their modelling does not incorporate information on patient-specific velocity profiles, which are known to heavily influence the flow field and therefore haemodynamic indices within the ascending aorta [25]. We did not identify a significant correlation between WSS and directly. We do see a trend of decreasing delamination strength with increasing WSS, in alignment with expectations. It is possible that, with more patients, the correlation would emerge to be significant.
Limitations
The small patient population is the major limitation of this study, reflecting the computationally intensive nature of this research. While some correlations were identified, more subtle correlations may have been missed from being underpowered. Our future work includes gathering a larger cohort and streamlining the CFD workflow. This will allow us to expand the external validity of these findings and better investigate the interaction of covariates such as valve type and function. Although the population was small, this study demonstrated a co-localization of haemodynamic indices and biomechanical properties across samples spanning multiple locations on individual patients and across the heterogeneous patient cohort. Other limitations include those to our computational model, which used several assumptions about the aortic geometry: (i) The walls were assumed to be rigid. While assuming rigid walls is known to impact instantaneous WSS values, the impact of wall movement on TAWSS has been found to be low [26]. (ii) The aortic valve geometries were ignored; however, we accounted for this by extracting patient-specific flow velocity profiles distal to the sinotubular junction.
The above limitations notwithstanding, our findings are significant in that they support the clinical relevance of and . A novel haemodynamics-based method of inferring wall biomechanics might potentially lead to more accurate assessment of dissection risk and facilitate better timing of elective surgeries. Furthermore, these results open the door to investigations of whether altering haemodynamics (be it through aneurysm or valve disease progression or, intriguingly, through surgery) changes the course of aortic disease.
CONCLUSION
Our comparison of haemodynamic indices with biomechanical properties of ATAAs provides, for the first time, direct evidence that elevations in WSS translate into the deterioration of loco-regional aortic wall biomechanics. While replicative work in larger cohorts is needed, these results point to the possible clinical utility of incorporating haemodynamic information as a novel aortic dissection risk criterion.
SUPPLEMENTARY MATERIAL
Supplementary material is available at EJCTS online.
Funding
This work was supported by the American Association for Thoracic Surgery Surgical Investigator Award, the Natural Sciences and Engineering Research Council of Canada Discovery Grant and Canadian Graduate Scholarship—Master’s, the Thoracic Surgery Foundation—Braunwald Research Grant and the Peter Munk Cardiac Centre Innovation Fund.
Conflict of interest: none declared.
Author contributions
Davis McClarty: Formal analysis; Investigation; Writing—original draft. Maral Ouzounian: Resources; Writing—review & editing. Mingyi Tang: Formal analysis; Investigation. Daniella Eliathamby: Data curation. David Romero: Supervision; Writing—review & editing. Elsie Nguyen: Resources. Craig A. Simmons: Resources; Writing—review & editing. Cristina Amon: Conceptualization; Resources; Supervision; Writing—review & editing. Jennifer Chia-Ying Chung: Conceptualization; Resources; Supervision; Writing—review & editing.
Reviewer information
European Journal of Cardio-Thoracic Surgery thanks Alessandro Della Corte, Tomas Holubec, Sven Martens and the other, anonymous reviewer(s) for their contribution to the peer review process of this article.
REFERENCES
ABBREVIATIONS
- 4DMRI
Four-dimensional magnetic resonance imaging
- AOI
Area of interest
- ATAA
Ascending thoracic aortic aneurysm
- CFD
Computational fluid dynamics
- IC
Inner curvature
- MRI
Magnetic resonance imaging
- OC
Outer curvature
- OSI
Oscillating shear index
- RRT
Relative residence time
- TAWSS
Time-averaged wall shear stress
- WSS
Wall shear stress
