


Abstract

There have been limited data available regarding aortic arch replacement in dialysis patients. The purpose of this study was to examine real-world data and to determine the impact of preoperative dialysis status and other risks on surgical aortic arch replacement using the Japan Cardiovascular Surgery Database.
A total of 5044 patients who underwent elective, isolated aortic arch replacement using antegrade cerebral perfusion during 2014–2017 were eligible for the study. Of these, 89 patients received haemodialysis preoperatively. The patients were divided into 6 groups according to their preoperative estimated glomerular filtration rate and dialysis status for comparison. Preoperative and postoperative data were examined using a multivariable regression model.
The overall surgical mortality rates of non-Chronic Kidney Disease (CKD) (estimated glomerular filtration rate >60 ml/min/1.73 m2), stage 3A, stage 3B, stage 4, stage 5 CKD and dialysis patients were 2.6%, 3.1%, 6.8%, 11.6%, 16.7% and 13.5%, respectively. After risk adjustment, dialysis was shown to be strongly associated with surgical mortality (odds ratio 4.39 and 95% confidence interval 2.22–8.72) and have a trend to be associated with postoperative stroke (odds ratio 2.02, 95% confidence interval 1.00–4.10, P = 0.051) when compared to the non-CKD group. As predictors of mortality, male sex, peripheral arterial disease, preoperative liver dysfunction and impaired left ventricular function were identified.
The Japanese nationwide database revealed the outcomes of aortic arch replacement in dialysis patients. Appropriate counselling and an alternative strategy should be considered for such patients with multiple risks for mortality.
INTRODUCTION
Over 2 million people worldwide currently receive treatment with dialysis or a kidney transplant, and this population has been increasing at an annual rate of 4.5% [1]. Patients on dialysis are known to have a high risk for cardiovascular-related morbidity and mortality that is 10 to 20 times greater than that of the general population [1–4]. The pathophysiological mechanisms are complex and not completely understood. Several factors, including activation of the renin-angiotensin-aldosterone system and sympathetic nervous system, abnormality of calcium-phosphate metabolism and oxidative stress, as well as accumulation of uraemic toxins are thought to drive the development of cardiovascular disease [3]. Thoracic aortic aneurysms are relatively rare in dialysis patients, although referral for surgery has been increasing in proportion to the increasing prevalence of end-stage renal failure.
The outcome of surgical aortic arch repair has been improving due to the technical advances in cerebral protection and accumulated knowledge regarding systemic perfusion and anastomosis techniques to prevent atherothromboembolism [5–7]. The reported long-term outcome is acceptable, with a low reintervention rate [8–10]. The emergence of thoracic endovascular aortic repair (TEVAR) has shown its clinical value in the treatment of aortic arch aneurysms [11–13], although it has remained controversial in terms of difficulties in cervical vessel reconstruction, unknown long-term outcomes and a high incidence of latent stroke [14].
In previous studies, surgical outcomes of aortic arch surgery in dialysis patients were not clear because of the small sample size, and independent predictors of outcome have not been identified. It is beneficial for dialysis patients with aortic arch aneurysms to select the optimal treatment by predicting surgical outcomes based on the preoperative comorbidities. To determine the precise impact of dialysis status and other comorbidities on surgical outcomes of aortic arch replacement, patient demographic data and surgical outcomes of aortic arch replacement were examined using the Japan Cardiovascular Surgery Database.
METHODS
Data collection
Since 2002, the Japan Cardiovascular Surgery Database has collected data on more than 670 000 adult cardiovascular surgical cases from ∼600 hospitals (99% of Japanese hospitals performing cardiovascular surgery as of 2017) throughout Japan. The data collection form has a total of >250 variables (definitions available online at http://www.jacvsd.umin.jp), which are similar to those in the Society of Thoracic Surgeons (STS) National Database (definitions available online at http://sts.org). Variables are refined every few years according to the annual conferences of database managers and administrative office managers in light of the latest clinical needs. The methods used for data collection for the Japan Cardiovascular Surgery Database have been described previously [15]. Data collection has achieved a high completion level, with missing data representing <2% of all assembled data. The accuracy of submitted data was maintained by a data audit involving random, monthly visits by administrative office members to a participating hospital to check data against clinical records. The use of data for the present study was approved by the Data Utilization Committee of the Japan Cardiovascular Surgery Database Organization, and the study design was approved by the ethics committee of Hirosaki University Graduate School of Medicine.
Patients
A total of 5044 patients who underwent elective, isolated aortic arch replacement using antegrade cerebral perfusion for aortic pathology between 1 January 2014 and 31 December 2017 were identified for the analysis. Of these, 89 patients underwent renal replacement therapy (RRT) preoperatively. The surgical approach was limited to median sternotomy. Urgent, emergent, salvage and re-do operations were excluded from the study. As for aortic pathology, both acute and chronic aortic dissection cases were excluded. Patients with special risk factors and coexisting disease, including connective tissue disorders, aortitis, Kawasaki disease, Behçet’s disease, other autoimmune collagen diseases, malignancy, porcelain aorta, infected aneurysm and inflammatory aneurysm were also excluded. Aortic arch replacement in this study was defined as aortic arch surgery in which at least one of the cervical branch vessels was replaced concomitant with the ascending aorta and arch of the aorta, involving zones 1–3. Total arch replacement in this study is defined as an aortic arch replacement involving zones 0–3 with all cervical vessel reconstructions. Patients receiving replacement including zone 4 and open-stent grafting were excluded, as were those receiving only ascending aortic replacement and hemi-arch replacement. Arch replacements with all concomitant procedures (e.g. root surgery, coronary artery bypass surgery, valve surgery) were also excluded from this study.
The patients were divided into 6 groups according to the preoperative dialysis status and the preoperative estimated glomerular filtration rate for descriptive statistics and risk-adjusted analysis. The grouping was as follows: G1 + 2 (N = 2350), >60 ml/min/1.73 m2; G3A (N = 1588), 45–60 ml/min/1.73 m2; G3B (N = 766), 30–44 ml/min/1.73 m2; G4 (N = 215), 15–29 ml/min/1.73 m2; G5 (N = 36), <15 ml/min/1.73 m2; and RRT (N = 89), dialysis-dependent. This grouping follows the Kidney Disease: Improving Global Outcomes (KDIGO) 2012 Clinical Practice Guideline for the Evaluation and Management of Chronic Kidney Disease. Inclusion and exclusion criteria of this study are summarized in Fig. 1.
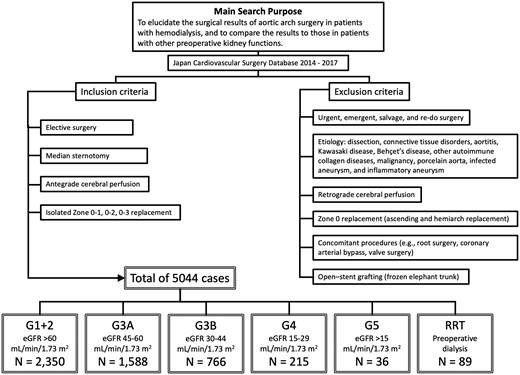
Summary of inclusion and exclusion criteria of this study. eGFR: estimated glomerular filtration rate.

Forest plot for overall mortality calculated by hierarchical logistic regression models. (A) Risk-adjusted odds ratio with 95% confidence interval for hospital mortality. (B) Risk-adjusted odds ratio with 95% confidence interval for permanent stroke. eGFR: estimated glomerular filtration rate.
End points
The primary outcome measures of this study were operative mortality and postoperative stroke. To understand the risk for postoperative induction of dialysis in each estimated glomerular filtration rate status, the incidence of postoperative renal failure necessitating dialysis was also examined. Operative mortality was defined as all deaths occurring during the hospitalization in which the operation was performed or all deaths occurring before the end of postoperative day 30. Permanent stroke was defined as a postoperative neurological deficit that was newly diagnosed and persistent for more than 72 h. Postoperative renal failure necessitating dialysis was defined as that newly initiated postoperatively and included haemodialysis, peritoneal dialysis and continuous haemodiafiltration.
Statistical analyses
Analyses were performed using the STATA 15 software program (STATA Corp., College Station, TX, USA). For risk-adjusted comparisons, a multivariable logistic regression analysis fitted with a generalized estimation equation was used. The variables (all variables used for risk adjustment are shown in Supplementary Material, Table S1) included in this analysis were chosen from our previous study and other previous studies in which risk factors for operative death and postoperative permanent neurological deficit in aortic surgery were identified [8, 9, 15, 16]. The trend for each endpoint in each group is expressed as the odds ratio, OR [plus 95% confidence interval (95% CI)] relative to G1 + 2 (≥60 ml/min/1.73 m2). No adjustment for multiple testing was performed and 2-sided P-values <0.05 are considered statistically significant.
RESULTS
Demographics
The median age of the RRT group was 73 (IQR 67–78) years. Seventy patients (78.7%) were male; 18.0% had a history of preoperative stroke, and 16.9% had a history of undergoing coronary intervention. Twenty-five patients (28.1%) had left ventricular ejection fraction between 30% and 59%, and 3 patients (3.4%) had left ventricular ejection fraction <30%. This prevalence was the highest compared to the other groups. A summary of the patient demographics is shown in Table 1.
Patient characteristics
| G1 + 2 | G3a | G3b | G4 | G5 | RRT | |
|---|---|---|---|---|---|---|
| eGFR ≥60 ml/min/1.73 m2 | eGFR 45–59 ml/min/1.73 m2 | eGFR 30–44 ml/min/1.73 m2 | eGFR 15–29 ml/min/1.73 m2 | eGFR ≤14 ml/min/1.73 m2 | Dialysis | |
| N = 2350 | N = 1588 | N = 766 | N = 215 | N = 36 | N = 89 | |
| Age (y), median (IQR) | 72 (67–77) | 75 (70–79) | 76 (71–81) | 76 (73–79) | 76 (69.5–79) | 73 (67–78) |
| Age category (y), n (%) | ||||||
| ≤59 | 149 (6.3) | 29 (1.8) | 7 (0.9) | 3 (1.4) | 1 (2.8) | 5 (5.6) |
| 60–64 | 216 (9.2) | 79 (5.0) | 26 (3.4) | 6 (2.8) | 3 (8.3) | 7 (7.9) |
| 65–69 | 503 (21.4) | 236 (14.9) | 108 (14.1) | 22 (10.2) | 5 (13.9) | 20 (22.5) |
| 70–74 | 602 (25.6) | 425 (26.8) | 163 (21.3) | 58 (27.0) | 6 (16.7) | 21 (23.6) |
| 75–79 | 522 (22.2) | 460 (29.0) | 223 (29.1) | 82 (38.1) | 14 (38.9) | 18 (20.2) |
| ≥80 | 358 (15.2) | 359 (22.6) | 239 (31.2) | 44 (20.5) | 7 (19.4) | 18 (20.2) |
| Male, n (%) | 1812 (77.1) | 1238 (78.0) | 600 (78.3) | 170 (79.1) | 32 (88.9) | 70 (78.7) |
| Estimated glomerular filtration rate (ml/min/1.73 m2), median (IQR) | 71.4 (64.7–80.4) | 53.2 (49.65–56.6) | 39.6 (35.7–42.5) | 25.3 (21–27.7) | 10.7 (9.4–13) | 7.5 (5–12.4) |
| Body mass index (kg/m2), median (IQR) | 23.5 (21.4–25.5) | 23.9 (21.8–25.9) | 23.7 (21.6–26.1) | 23.2 (21.2–25.2) | 22.6 (20.95–25.4) | 22.2 (20.2–24.3) |
| Body mass index >30 kg/m2, n (%) | 94 (4.0) | 70 (4.4) | 39 (5.1) | 9 (4.2) | 1 (2.8) | 3 (3.4) |
| Preoperative neurological impairment, n (%) | 258 (11.0) | 229 (14.4) | 128 (16.7) | 58 (27.0) | 5 (13.9) | 16 (18.0) |
| History of coronary intervention, n (%) | 185 (7.9) | 160 (10.1) | 96 (12.5) | 28 (13.0) | 1 (2.8) | 15 (16.9) |
| Diabetes, n (%) | 383 (16.3) | 289 (18.2) | 163 (21.3) | 37 (17.2) | 8 (22.2) | 25 (28.1) |
| Chronic lung disease, n (%) | 643 (27.4) | 485 (30.5) | 232 (30.3) | 68 (31.6) | 13 (36.1) | 27 (30.3) |
| Current smoker, n (%) | 408 (17.4) | 213 (13.4) | 83 (10.8) | 21 (9.8) | 7 (19.4) | 20 (22.5) |
| Peripheral vascular disease, n (%) | 342 (14.6) | 277 (17.4) | 156 (20.4) | 50 (23.3) | 11 (30.6) | 20 (22.5) |
| NYHA class 3 or 4, n (%) | 15 (0.6) | 11 (0.7) | 7 (0.9) | 4 (1.9) | 1 (2.8) | 2 (2.2) |
| LVEF 30–59%, n (%) | 312 (13.3) | 252 (15.9) | 147 (19.2) | 39 (18.1) | 9 (25.0) | 25 (28.1) |
| LVEF <30%, n (%) | 5 (0.2) | 8 (0.5) | 2 (0.3) | 2 (0.9) | 0 (0.0) | 3 (3.4) |
| Preoperative atrial fibrillation, n (%) | 103 (4.4) | 98 (6.2) | 55 (7.2) | 13 (6.0) | 3 (8.3) | 7 (7.9) |
| Preoperative liver dysfunction, n (%) | 24 (1.0) | 18 (1.1) | 10 (1.3) | 1 (0.5) | 0 (0.0) | 1 (1.1) |
| True aneurysm, n (%) | 2281 (97.1) | 1550 (97.6) | 751 (98.0) | 212 (98.6) | 33 (91.7) | 82 (92.1) |
eGFR: estimated glomerular filtration rate; IQR: interquartile range; LVEF: left ventricular ejection fraction; NYHA: New York Heart Association functional class; RRT: renal replacement therapy.
Operative outcomes
Total arch replacement was performed in 82% of the RRT group, which was the lowest rate of all study groups (Table 2). There were 12 deaths (13.5%) in the RRT group. Median operative time and cardiopulmonary bypass time (with IQR) were 395 (335–516) min and 212 (190–252) min, respectively. As for postoperative complications, pulmonary complications (acute respiratory distress syndrome, pulmonary oedema or pneumonia) with prolonged ventilation for more than 24 h were observed in 25.8%, and deep sternal wound infections were observed in 5.6%, which was also the highest incidence rate compared to the other groups. Postoperative stroke was observed in 11.2% of the RRT group.
Operative data and outcomes
| G1 + 2 | G3a | G3b | G4 | G5 | RRT | |
|---|---|---|---|---|---|---|
| eGFR ≥60 ml/min/1.73 m2 | eGFR 45–59 ml/min/1.73 m2 | eGFR 30–44 ml/min/1.73 m2 | eGFR 15–29 ml/min/1.73 m2 | eGFR ≤14 ml/min/1.73 m2 | Dialysis | |
| N = 2350 | N = 1588 | N = 766 | N = 215 | N = 36 | N = 89 | |
| Total arch replacement, n (%) | 1998 (85.0) | 1361 (85.7) | 648 (84.6) | 190 (88.4) | 30 (83.3) | 73 (82.0) |
| Operative time (min), median (IQR) | 375 (314–449) | 385 (323–459.5) | 398 (330–475) | 412 (326–488) | 396 (351.5–512) | 395 (335–516) |
| CPB time (min), median (IQR) | 204 (170–246) | 211 (176–249.5) | 218 (182–259) | 209 (173–254) | 217.5 (177.5–243.5) | 212 (190–252) |
| Prolonged ventilation, n (%) | 159 (6.8) | 136 (8.6) | 79 (10.3) | 32 (14.9) | 6 (16.7) | 23 (25.8) |
| Deep sternal wound infection, n (%) | 23 (1.0) | 28 (1.8) | 19 (2.5) | 3 (1.4) | 1 (2.8) | 5 (5.6) |
| Surgical mortality, n (%) | 61 (2.6) | 49 (3.1) | 52 (6.8) | 25 (11.6) | 6 (16.7) | 12 (13.5) |
| Postoperative stroke, n (%) | 109 (4.6) | 101 (6.4) | 71 (9.3) | 25 (11.6) | 1 (2.8) | 10 (11.2) |
| Postoperative renal failure requiring dialysis, n (%) | 30 (1.3) | 28 (1.8) | 38 (5.0) | 31 (14.4) | 18 (50.0) |
eGFR: estimated glomerular filtration rate; IQR: interquartile range; RRT: renal replacement therapy.
Risk-adjusted analyses
For risk adjustment, logistic regression analyses were performed for each of operative mortality and postoperative stroke.
The results of multivariable analysis for surgical mortality are shown in Table 3. (Full results are shown in Supplementary Material, Table S1.) Male sex, peripheral arterial disease and preoperative liver dysfunction were found to be independent risk factors for operative mortality. Left ventricular ejection fraction between 30% and 59% and left ventricular ejection fraction <30% were also strongly associated with surgical mortality with ORs (and 95% CIs) of 1.50 (1.06–2.12) and 4.36 (1.31–14.52), respectively. Preoperative dialysis was shown to be strongly associated with mortality, with an OR of 4.39 (95% CI 2.22–8.72). When age ≤64 was used as a reference category for sensitivity analysis, age ≥80 was shown to be associated with surgical mortality (OR 3.23, 95% CI 1.65–6.33) (Supplementary Material, Table S2).
Multivariable logistic regression analysis for operative mortality and permanent stroke
| Odds ratio (95% CI) | P-value | |
|---|---|---|
| Variable | ||
| In-hospital death | ||
| Male sex | 1.74 (1.16–2.63) | 0.008 |
| Peripheral vascular disease | 1.70 (1.23–2.36) | <0.001 |
| LVEF 30–59% | 1.50 (1.06–2.12) | 0.022 |
| LVEF <30% | 4.36 (1.31–14.52) | 0.016 |
| Preoperative liver dysfunction | 2.80 (1.07–7.31) | 0.036 |
| eGFR 30–44 | 2.04 (1.38–3.02) | <0.001 |
| eGFR 15–29 | 3.89 (2.34–6.47) | <0.001 |
| eGFR <14 | 5.92 (2.32–15.09) | <0.001 |
| Dialysis | 4.39 (2.22–8.72) | <0.001 |
| Permanent stroke | ||
| History of stroke | 2.38 (1.82–3.10) | <0.001 |
| History of coronary intervention | 1.63 (1.18–2.27) | 0.004 |
| Diabetes | 1.86 (1.43–2.41) | <0.001 |
| eGFR 30–44 | 1.74 (1.26–2.41) | <0.001 |
| eGFR 15–29 | 2.03 (1.26–2.41) | 0.004 |
| Dialysis | 2.02 (1.00–4.10) | 0.051 |
Age ≤ 59, LVEF ≥ 60% and eGFR ≥ 60 ml/min/1.73 m2 as reference categories.
95% CI: 95% confidence interval; eGFR: estimated glomerular filtration rate; LVEF: left ventricular ejection fraction; NYHA: New York Heart Association functional class; OR: odds ratio.
Table 3 also summarizes the results of multivariable analysis for risk factors for postoperative stroke. A preoperative history of stroke was the strongest risk factor for postoperative stroke, with an OR of 2.38 (95% CI 1.82–3.10, P < 0.001). In addition to a history of stroke, a history of coronary stenting (OR 1.63, 95% CI 1.18–2.27, P = 0.004) and diabetes mellitus (OR 1.86, 95% CI 1.43–2.41, P < 0.001) were independent risk factors for postoperative stroke. Preoperative dialysis was associated with postoperative stroke, though it was not significant (OR 2.02, 95% CI 1.00–4.10, P = 0.051).
The results for risk factors for postoperative renal failure necessitating dialysis are shown in Supplementary Material, Table S1. A history of coronary intervention (OR 1.96, 95% CI 1.21–3.17, P = 0.006), diabetes mellitus (OR 1.56, 95% CI 1.04–2.35, P = 0.033) and chronic lung disease (OR 1.50, 95% CI 1.05–2.17, P = 0.028) were significantly associated with postoperative renal failure that required dialysis. The G5 group (estimated glomerular filtration rate <15 ml/min/1.73 m2) had a substantial risk for postoperative dialysis, with an OR of 79.49 (95% CI 36.40–173.57) compared to the G1 + 2 group.
DISCUSSION
Open heart surgery in patients on dialysis carries a substantial risk increment compared to that in patients not on dialysis. Crude operative mortality ranges widely from 5.4% to 42.2%, depending on the complexity of the cardiac procedure [15–22]. Aljohani et al. [23] reported the largest chronic haemodialysis series of 2264 cases that underwent aortic valve replacement from a national database with mortality and stroke rates of 11.8% and 5.9%, respectively. Studies focusing on thoracic aortic surgery in haemodialysis patients have been limited, with only several previous studies reported in the literature. Hibino et al. [24] reported 21 cases of thoracic aortic surgery in patients with preoperative haemodialysis. Of these, aortic arch replacement was performed in 7 patients, root to ascending aortic replacement in 8 and descending to thoraco-abdominal aortic replacement in 6. The overall surgical mortality rate was 14.3% and the stroke rate was 14.3%. The haemodialysis group showed longer intensive care unit stay, longer hospital stay and a higher incidence of postoperative pneumonia compared to the non-dialysis group in their propensity score-matched cohort. Akiyoshi et al. [25] reported 19 cases of acute type A aortic dissection in haemodialysis patients. Ascending or hemi-arch replacement was performed in 63%, and total or partial aortic arch replacement was performed in 37%. The in-hospital mortality rate was 21% and the stroke rate was 11%. Due to the low prevalence of thoracic aortic disease concomitant with dialysis, the incidence of mortality was low in these previous studies. In addition, many covariables, e.g. pathology of diseased aorta, surgical approach, area of aortic replacement, cerebral protection methods, surgical timing and concomitant procedures were all combined. Therefore, predictors of surgical mortality and postoperative stroke could not be identified.
In the present study, only elective, isolated aortic arch replacement using antegrade cerebral perfusion in a recent 3-year period was included. Surgical approach, aortic pathology and operative technique were limited to maximize model stability. As predictors of mortality, male sex, peripheral arterial disease, preoperative liver dysfunction, preoperative left ventricular ejection fraction 30–59% and preoperative left ventricular ejection fraction <30% were identified. Considering the fact that isolated preoperative dialysis carried a substantial risk for mortality, with an odds ratio of 4.39 (95% CI 2.22–8.72), preoperative dialysis patients with multiple risk factors, especially including preoperative left ventricular ejection fraction <30% (with an OR of 4.36 with a 95% CI of 1.31–14.52) may not be good candidates for open surgical repair.
When we consider the treatment strategy in these high-risk patients, ‘Is endovascular repair safer than open repair?’ is one of the most important clinical questions. The best evidence to date has been provided by Liang et al. [26] who reported early- and mid-term results of the largest cohort of open surgery (n = 136) and TEVAR (n = 216) cases in haemodialysis patients with thoracic aortic aneurysm using United States Renal Data System datasets from 2005 to 2008. Location of aortic pathology was limited only to descending and thoraco-abdominal aorta. The crude overall surgical mortality was 30.1% in open surgery and 15.7% in TEVAR. Even in the elective surgery cases, the mortality rate was significantly higher in open repair than in TEVAR (29.3% vs 14.3%, P = 0.005). The TEVAR group had a significantly lower rate of postoperative pulmonary complications including pneumonia, but a higher rate of stroke (2.9% vs 9.7%, P = 0.018). Despite the better mortality rate of TEVAR than of open surgery, this survival benefit disappeared at 1 year, and there was a trend that the survival curves crossed, and the curve of TEVAR was overtaken by that of open repair a year later (the estimated survival rate at 1 year after surgery was 51% in open surgery and 54% in TEVAR). According to this result, open surgery may be beneficial in this group of patients if the patient life expectancy is longer than 1 year and only if the rupture risk of aneurysm is considered to be quite high. However, these results should be interpreted with caution, since the procedural and anatomical details were not available in this study due to the lack of surgical information in the database, and the time background was different from the recent clinical practices.
Tsubota et al. [27] reported a total of 36 patients on haemodialysis undergoing open surgery for thoracic aortic repair (n = 21) or TEVAR (n = 16). Overall surgical mortality was 5% in open surgery and 13% in TEVAR, whereas postoperative stroke occurred in 10% in open surgery and 7% in TEVAR. In this study, open surgery was performed predominantly for root to aortic arch aneurysms, whereas TEVAR was performed mostly for descending thoracic aortic aneurysms in which the proximal landing was at zone 3 to zone 4 in 87%; thus, it is impossible to simply compare the mortality rates and stroke rates between the 2 groups. However, we should keep in mind that, even in the less invasive endovascular surgery, patients on dialysis have substantial risk for mortality and stroke when undergoing thoracic aortic repair. Moreover, application of TEVAR to aortic arch remains challenging due to device and anatomical limitations. In our view, repair of thoracic aortic aneurysms in haemodialysis patients should be undertaken only after careful consideration of perioperative mortality, rupture risks and long-term life expectancy by both patient and surgeon. Further study will be needed to determine whether to choose open surgery or TEVAR, although we suggest that, if the patients on dialysis have many of the above-mentioned predictors for mortality or stroke, open surgery may not be the best option, and endovascular or conservative therapies should be considered first.
One of the other unique findings of the present study is that the study successfully collected 36 stage 5 CKD patients, accounting for only 0.7% of the whole study population. In stage 5 CKD, the observed surgical mortality rate was 16.7%, with a risk-adjusted OR of 5.92, and the incidence of postoperative renal failure necessitating dialysis was 50.0%, with a risk-adjusted OR of 79.49. Even compared to the HD group, stage 5 CKD showed worse risk-adjusted surgical mortality (ORs of stage 5 CKD and HD were 5.92 and 4.39, respectively) (Fig. 2). This result may suggest that surgeons should not be fixated on dialysis-free preoperative management in these stage 5 CKD patients who require open aortic arch repair, and they should consider starting dialysis prior to surgery.
Limitations
This was a retrospective, nationwide database study, and thus some of the details, such as lower body circulatory arrest time, myocardial protection methods, operative technique (arch-first or distal anastomosis first) and prostheses used (4-branched graft, trifurcated graft or tube graft with island technique), were not available. The surgical strategy may vary across institutions with respect to lower body temperature, organ protection during lower body circulatory arrest (with or without perfusion using balloon occlusion), antegrade cerebral perfusion detail (unilateral/bilateral, balloon tip catheter or perfusion from anastomosed graft) and arterial cannulation sites (ascending aorta or peripheral arteries). Surgeon experience, case-per-year volume and hospital volume were not taken into consideration in this study. Long-term outcomes were also not available.
Since the increased atherosclerotic change in the dialysis group and worse CKD groups can affect the technical aspects of aortic arch repair, operation time-based information, such as total operation time, extracorporeal circulation time and aortic cross-clamp time, was excluded from the logistic regression model to avoid underestimating the effect of CKD. For example, the more sclerotic the arterial wall is, the more time surgeons may need to dissect and anastomose aortic and cervical vessels. Haemostasis can be more difficult to achieve in sclerotic arterial walls than in less sclerotic arterial walls. This assumption may reflect the longer operative time in CKD patients compared to non-CKD patients in the 2-group comparison in the present study.
CONCLUSION
The Japanese nationwide database revealed the real-world outcomes of aortic arch replacement in dialysis patients. For those with multiple preoperative risk factors that were associated with mortality, endovascular therapy or conservative therapy should be primarily considered. Due to the lack of past high-volume experience, the present result can be a landmark when considering treatment for aortic arch disease in patients on dialysis.
SUPPLEMENTARY MATERIAL
Supplementary material is available at EJCTS online.
Conflict of interest: Hiroaki Miyata and Hiroyuki Yamamoto are affiliated with the Department of Healthcare Quality Assessment at the University of Tokyo. The department is a social collaboration department supported by grants from the National Clinical Database, Johnson & Johnson K.K. and Nipro Co.
Author contributions
Yoshiaki Saito: Conceptualization; Writing—original draft; Writing—review & editing. Hiroyuki Yamamoto: Data curation; Formal analysis; Software. Ikuo Fukuda: Supervision; Validation. Hiroaki Miyata: Data curation; Formal analysis; Funding acquisition. Masahito Minakawa: Supervision; Validation. Noboru Motomura: Data curation; Resources; Software; Supervision.
Reviewer information
European Journal of Cardio-Thoracic Surgery thanks Tim Berger and the other anonymous reviewers for their contribution to the peer review process of this article.
Presented at the 34th Annual Meeting of the European Association for Cardio-Thoracic Surgery, Barcelona, Spain, 8–10 October 2020.
REFERENCES
ABBREVIATIONS
- CI
Confidence interval
- OR
Odds ratio
- RRT
Renal replacement therapy
- TEVAR
Thoracic endovascular aortic repair
