


Abstract

The EuroSCORE II is widely used to predict 30-day mortality in patients undergoing open and transcatheter cardiac surgery. The aim of this study is to evaluate the discriminatory ability of the EuroSCORE II in predicting 30-day mortality in a large cohort of patients undergoing surgical mitral valve repair in a high-volume centre.
A retrospective review of our institutional database was carried on to find all patients who underwent mitral valve repair in our department from January 2012 to December 2019. Discrimination of the EuroSCORE II was assessed using receiver operating characteristic curves. The maximum Youden’s Index was employed to define the optimal cut-point. Calibration was assessed by generating calibration plot that visually compares the predicted mortality with the observed mortality. Calibration was also tested with the Hosmer–Lemeshow goodness-of-fit test. Finally, the accuracy of the models was tested calculating the Brier score.
A total of 2645 patients were identified, and the median EuroSCORE II was 1.3% (0.6–2.0%). In patients with degenerative mitral regurgitation (MR), the EuroSCORE II showed low discrimination (area under the curve 0.68), low accuracy (Brier score 0.27) and low calibration with overestimation of the 30-day mortality. In patients with secondary MR, the EuroSCORE II showed a good overall performance estimating the 30-day mortality with good discrimination (area under the curve 0.88), good accuracy (Brier score 0.003) and good calibration.
In patients with degenerative MR operated on in a high-volume centre with a high level of expertise in mitral valve repair, the EuroSCORE II significantly overestimates the 30-day mortality.
INTRODUCTION
Since its publication in 2012, the EuroSCORE II has been widely used to predict 30-day mortality in patients undergoing open cardiac surgery and transcatheter procedures. This score was developed by analysing a cohort of 23 000 patients who underwent open cardiac surgery in >150 hospitals in 43 countries over a 12-week period (May–July 2010) [1]. Several studies confirmed the good performance of the EuroSCORE II in predicting 30-day mortality in patients who had undergone major cardiac surgery [2–7], isolated coronary bypass graft [8], aortic valve replacement [9–11] and miscellaneous valve operations [12]. However, although 2 studies validated the EuorSCORE II in patients undergoing mitral valve surgery [13, 14], to date, no study has evaluated the predictive value of the EuroSCORE II in estimating 30-day mortality in patients undergoing exclusively surgical mitral valve repair. The aim of this study is to evaluate the performance of the EuroSCORE II in predicting 30-day mortality in patients who underwent mitral valve repair for degenerative and secondary mitral regurgitation (MR) in our institution since its introduction in January 2012.
MATERIALS AND METHODS
Patients
A retrospective review of our institutional database was carried on to find all patients who underwent mitral valve repair in our department from January 2012 to December 2019. Patients were then divided in 2 groups: degenerative and secondary MR. Indeed, to minimize the confounding effect of other less common aetiologies of MR, we excluded from the study population the relatively small number of patients with rheumatic disease and post-endocarditis MR. Charts were then analysed to find preoperative characteristics, EuroSCORE II value, intraoperative variables and postoperative results. Survival after hospital discharge was assessed by outpatients visit, usually done 2 months after the index procedure. Short-term outcomes are reported according to the AATS/STS/EACTS guidelines [15]. The Ethical Committee approved the study and waived the individual informed consent for this retrospective analysis.
Statistical analysis
Patient data were summarized as mean ± standard deviation, or median and interquartile range for asymmetrically distributed continuous variables. Categorical variables were expressed as percentages or prevalence, as appropriate. The Kolmogorov–Smirnov test was used to check for the normality of data. Univariate analysis was done with Pearson’s chi-square test or Fisher’s exact test for categorical variables. For continuous variables, Student’s t-test or Wilcoxon signed-rank tests were used as appropriate.
Discrimination of a test indicates the extent to which the model distinguishes between patients who will die or survive in the perioperative period. Discrimination was assessed with receiver operating characteristic (ROC) curves. ROC area under the curve (AUC) values vary between 0.5 and 1, where 0.5 denotes a bad diagnostic test and 1 denotes an excellent diagnostic test [16]. Another index used to evaluate the discrimination was the Somers’ Dxy rank correlation between predicted probabilities and observed responses. When Dxy = 0, the model is making random prediction, and when Dxy = 1, the prediction is perfect [17]. The maximum Youden’s Index (J = sensitivity + specificity − 1) was employed to define the optimal cut-point, which is the point on the curve at which the predictive value of the score is maximized.
Calibration refers to the agreement between observed outcomes and predictions. For example, 5 in-hospital deaths should be observed in a 100 patients’ group with a predicted mortality of 5%. Calibration was assessed by generating calibration plot that visually compares the predicted mortality with the observed mortality [18]. A curve below or above the diagonal reflects, respectively, overestimation and underestimation. The closest the line to the predicted mortality, the better the calibration of the score. Moreover, calibration was tested with the Hosmer–Lemeshow goodness-of-fit test, which compares observed to predicted values by decile of predicted probability. A significant P-value of this test indicates a bad performance of the score.
Finally, the accuracy of the models was tested calculating the Brier score (quadratic difference between predicted probability and observed outcome for each patient); when the prediction of the model is perfect, the Brier score is 0.
All the analysis was carried out separately for patients with degenerative MR and secondary MR. All the analyses were performed using Stata software (StataCorp LLC, College Station, TX, USA; Version 15).
RESULTS
A total of 2645 patients were identified. Preoperative characteristics of the 2 groups are listed in Table 1. As expected, patients with secondary MR were significantly older and with higher median EuroSCORE II (2.4% vs 1%, P < 0.001). The surgical techniques and other intraoperative variables are summarized in Table 2. The 30-day mortality was significantly higher in patients with secondary MR (2.6% vs 0.39%, P < 0.001). Similarly, low cardiac output syndrome was significantly more common in patients with secondary MR (8.6% vs 1.3%, P < 0.001). Postoperative complications are listed in Table 3. Death was due to low cardiac output syndrome in 4 patients (2 in the secondary MR group and 2 in the degenerative MR); septic shock in 4 patients (all in the degenerative MR group) and other causes in the remaining 5 cases. All hospital survivors had their first outpatient visit about 2 months after surgery.
Preoperative characteristics of the patients in the 2 groups
| Degenerative (N = 2530) | Secondary (N = 115) | P-value | |
|---|---|---|---|
| Age, median (IQR) | 57 (47–66) | 68 (63–72) | <0.001 |
| Female sex, n (%) | 837 (33) | 45 (39) | 0.178 |
| NYHA class I, n (%) | 594 (23) | 0 (0) | 0.999 |
| NYHA class II, n (%) | 1475 (59) | 25 (21) | <0.001 |
| NYHA class III, n (%) | 390 (15) | 55 (48) | <0.001 |
| NYHA class IV, n (%) | 71 (3) | 35 (31) | <0.001 |
| REDO, n (%) | 69 (2.7) | 2 (1.7) | 0.521 |
| Creatinine clearance 85–50 ml/min, n (%) | 91 (3.6) | 7 (6) | 0.166 |
| Creatinine clearance <50 ml/min, n (%) | 35 (1.4) | 5 (4.3) | 0.010 |
| Dialysis regardless of the creatinine clearance, n (%) | 19 (0.75) | 2 (1.7) | 0.242 |
| Insulin dependent diabetes mellitus, n (%) | 110 (4.3) | 37 (32) | <0.001 |
| Extracardiac arteriopathy, n (%) | 27 (1) | 7 (6) | <0.001 |
| COPD, n (%) | 40 (1.6) | 4 (3.5) | 0.119 |
| Ejection fraction, median (IQR) | 61 (58–66) | 35 (30–42) | <0.001 |
| Moderate pulmonary hypertension (SPAP 30–55 mmHg), n (%) | 832 (32.8) | 66 (57) | <0.001 |
| Severe pulmonary hypertension (SPAP >55 mmHg), n (%) | 220 (8) | 28 (24) | <0.001 |
| Isolated mitral valve repair, n (%) | 1779 (71) | 52 (45) | <0.001 |
| Mitral valve repair + 1 procedure, n (%) | 571 (22) | 60 (53) | <0.001 |
| Mitral valve repair + 2 or more procedure, n (%) | 180 (7) | 3 (2) | 0.062 |
| EuroSCORE II, median (IQR) | 1 (0.6–1.5) | 2.4 (1.5–4.1) | <0.001 |
IQR: interquartile range.
Operative variables
| Degenerative (N = 2530) | Secondary (N = 115) | P-value | |
|---|---|---|---|
| CPB time, median (IQR) | 88 (70–112) | 94 (70–130) | 0.654 |
| Cross clamp time, median (IQR) | 63 (49–82) | 69 (50–90) | 0.521 |
| Type of repair, n (%) | |||
| Isolated ring | 88 (4) | 70 (61) | <0.001 |
| Ring + resection of the posterior leaflet | 1038 (41) | 0 | 0.999 |
| Ring + edge-to-edge | 901 (35) | 45 (39) | 0.441 |
| Ring + chordae | 300 (12) | 0 | 0.999 |
| Ring + resection+ chordae | 100 (4) | 0 | 0.999 |
| Othersa | 103 (4) | 0 | 0.999 |
| Ring characteristics | |||
| Complete ring, n (%) | 1220 (48) | 115 (100) | 0.999 |
| Band, n (%) | 1310 (52) | 0 | 0.999 |
| Ring diameter, median (IQR) | 36 (34–38) | 28 (26–30) | <0.001 |
Including combination not listed in the table, other technique such as cleft closure or chordal transposition and patients who did not receive annuloplasty.
IQR: interquartile range.
Postoperative complications
| Degenerative (N = 2530) | Secondary (N = 115) | P-value | |
|---|---|---|---|
| Low cardiac output syndrome, n (%) | 34 (1.3) | 10 (8.6) | <0.001 |
| Prolonged ventilatory support (>48 h, n (%) | 48 (1.9) | 12 (10.4) | <0.001 |
| Re-exploration for bleeding, n (%) | 38 (1.5) | 1 (0.8) | 0.321 |
| Acute kidney injury requiring dialysis, n (%) | 44 (1.7) | 4 (3.5) | 0.171 |
| Stroke, n (%) | 23 (0.9) | 1 (0.8) | 0.653 |
| Transitory ischaemic attack, n (%) | 31 (1.2) | 1 (0.8) | 0.765 |
| 30-Day mortality, n (%) | 10 (0.39) | 3 (2.6) | <0.001 |
For patients with degenerative MR, the area under the ROC curve was 0.68 (Fig. 1) with an optimal cut-point of 1.61. The Somers’ Dxy index was 0.032. These 2 values indicate a relatively low discrimination. The calibration plot, shown in Fig. 2, indicates an overprediction of the 30-day mortality also in patients with low surgical risk. The P-value for the Hosmer–Lemeshow test was <0.001 indicating low calibration. Finally, the Brier score was 0.27 indicating a medium–low overall performance of the score.
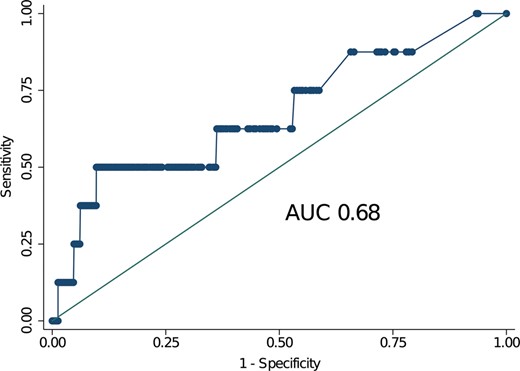
Receiver operating characteristic curves for patients with degenerative mitral regurgitation. The value of the area under the curve was 0.68 indicating a relatively low discrimination of the EuroSCORE II in this cohort of patients at low surgical risk (median EuroSCORE II 1%). AUC: area under the curve.
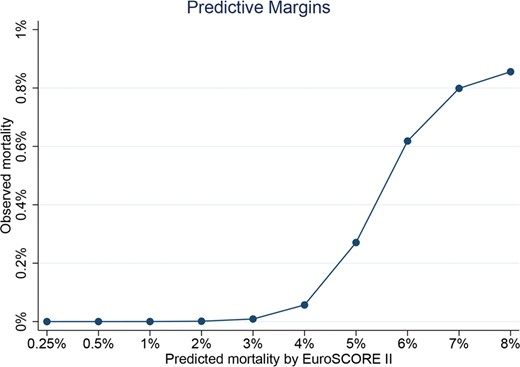
Spline for the EuroSCORE II in patients with degenerative mitral regurgitation. This figure highlights in a non-linear manner the overprediction of the 30-day mortality in patients at low surgical risk.
For patients with secondary MR, the area under the ROC curve was 0.87 with an optimal cut-point of 4.53 (Fig. 3). The Somers’ Dxy index was 0.773. These 2 values indicate good discrimination. The calibration plot, shown in Fig. 4, indicates a very good calibration for low-risk patients and a tendency to overestimate the 30-day mortality in medium- to high-risk patients. The P-value for the Hosmer–Lemeshow test was 0.996 indicating high calibration of the score. Finally, the Brier score was 0.003 indicating a very good overall performance of the score.
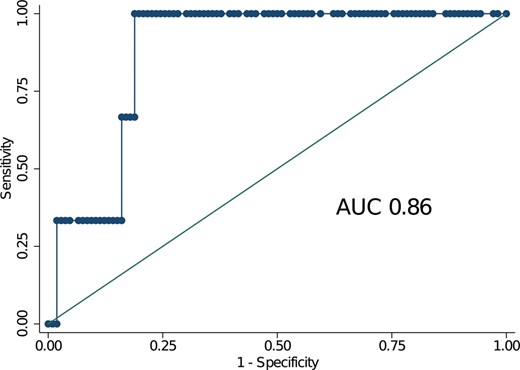
Receiver operating characteristic curves for patients with secondary mitral regurgitation. The value of the area under the curve was 0.86 indicating a good discrimination of the EuroSCORE II in this cohort of patients at increased surgical risk (median EuroSCORE II 2.4%). AUC: area under the curve.
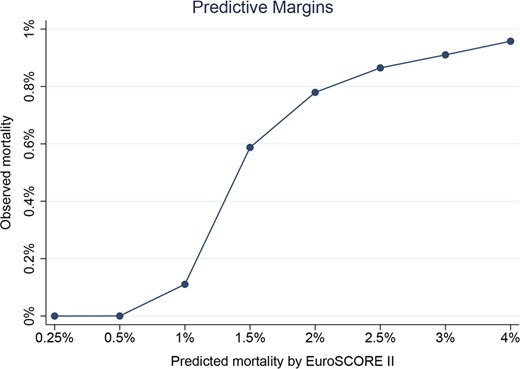
Spline for the EuroSCORE II in patients with secondary mitral regurgitation. This figure highlights in a non-linear manner the good calibration of the score in patients at low surgical risk, while a tendency to overestimate the mortality is evident with EuroSCORE II >5%.
The details of the performance of the EuroSCORE II in the 2 groups of patients are listed in Table 4.
Performance of the EuroSCORE II in the 2 groups
| Degenerative MR | Secondary MR | |
|---|---|---|
| Overall performance | ||
| Brier score | 0.27 | 0.003 |
| Discrimination | ||
| Area under the curve | 0.68 | 0.86 |
| Somers’ Dxy | 0.032 | 0.773 |
| Youden’s Index | 1.61 | 4.53 |
| Calibration | ||
| Slope | 0.12 | 0.42 |
| Intercept | 0.02 | 0 |
| Hosmer–Lemeshow P-value | <0.001 | 0.996 |
Best performance for the different tests: Brier score = 0; the closest to 1, the worse the global accuracy. Performance for the AUC: 1 excellent diagnostic test and 0.5 bad diagnostic test. Best performance for Somers’ Dxy = 1; the closest to 1, the better the discrimination. Youden’s Index defines the optimal cut-point, which is the point at which the score performances are maximized. Slope: the closet to 1, the better the calibration. Intercept: the closest to 0, the better the calibration. Hosmer–Lemeshow goodness of fit: a non-significant P-value indicates a good test.
AUC: area under the curve; MR: mitral regurgitation.
DISCUSSION
Prediction models play an important role in current cardiac surgical practice, and the EuroSCORE II is 1 of the most used tool to assess the risk of perioperative mortality.
Although the study population used for its original development included >1900 patients who underwent mitral valve repair [1], the EuroSCORE II has never been validated in a large contemporary cohort of mitral repair patients, treated in a high-volume referral centre. In addition, its performance has never been tested separately for patients with degenerative and secondary MR, which do have very different clinical characteristics, pathology and outcomes.
The main findings of our study are the following:
In patients with degenerative MR, the EuroSCORE II shows low discrimination (AUC 0.68), low accuracy (Brier score 0.27) and low calibration due to overprediction of the 30-day mortality.
In patients with secondary MR, the EuroSCORE II shows a good overall performance estimating the 30-day mortality with good discrimination (AUC 0.88), good accuracy (Brier score 0.003) and good calibration.
In patients with degenerative MR and low surgical risk, operated in a high-volume centre with high level of expertise for mitral valve repair, the EuroSCORE II significantly overestimates the 30-day mortality.
The EuroSCORE II was originally developed to improve calibration of the older model, the EuroSCORE. Studies on performance of the EuroSCORE II have demonstrated a good discriminatory ability of EuroSCORE II, better than its original version, with an area under the ROC curve greater than 0.80 in many series [6, 7, 19–21]. However, its performance varies depending on the type of operation and decreases in high-risk patients [6]. So far, our finding of a significant overprediction of the mortality in patients undergoing mitral valve repair for degenerative MR has never been reported in the literature. This overestimation of the 30-day mortality is probably linked to the very low mortality observed in our series (0.39%; 10/2530), which reflects the high level of expertise of our institution in mitral repair surgery. Indeed, the strict correlation between volume load and outcomes after mitral repair has been clearly demonstrated [22, 23]. Our results are somehow in contrast with those reported by Osnabrugge et al. [7]. In their sub-group analysis including about 1000 patients who underwent mitral valve repair in several centres across the USA (not divided by MR aetiology), the EuroSCORE II showed a better performance compared to our study, with an AUC of 0.82 and a better calibration. This discrepancy in the score performance can probably be explained by the significant difference in the 30-day mortality between their series (1.32%) and ours (0.39%), despite similar median EuroSCORE II values at baseline. This typically occurs when a comparison is made between the results of a single centre with high expertise in a specific field and those coming from a large number of centres with different levels of skill in that topic.
While the performance of the EuroSCORE II was not good in our cohort of degenerative MR, on the other hand, in patients with secondary MR, the EuroSCORE II showed good discrimination, good calibration and good accuracy. It is well known that degenerative and secondary MR are 2 completely different diseases, with different patients’ profile, natural history and outcomes after interventions [24]. Not surprisingly, in our study population, there was a significant difference between secondary and degenerative MR patients in terms of risk profile (median EuroSCORE II 2.4% vs 1%) and 30-day mortality (2.6% vs 0.39%). This led to a better discrimination, calibration and accuracy of the EuroSCORE II in patients with secondary MR as compared to those with degenerative MR.
Limitations
The main limitation of our study is the missing long-term follow-up. However, our aim was to validate the EuroSCORE II, which simply predicts the 30-day mortality and not the long-term survival. Another relative limitation is the small sample size of the patients with secondary MR compared to the cohort of patients with degenerative MR. Finally, the findings of this study should not be applied to patients undergoing mitral repair for rheumatic or endocarditis aetiologies. Indeed, both of them were excluded on purpose due to a limited sample size, which, therefore, would have increased the risk of bias.
CONCLUSION
In patients with degenerative MR undergoing mitral repair, the EuroSCORE II demonstrated an overall poor performance with low discrimination, accuracy and calibration due to an overestimation of the 30-day mortality. On the other hand, in patients with secondary MR, the EuroSCORE II showed better overall performance. In high-volume centres with a high level of expertise for mitral valve repair, the EuroSCORE II significantly overpredicts the 30-day mortality in patients with degenerative MR.
ACKNOWLEDGEMENTS
The Alfieri Heart Foundation provided support for data collection and analysis of this research. We thank Davide Schiavi, clinical trial coordinator of the Alfieri Heart Foundation for the assistance with the Ethical Committee.
Conflict of interest: none declared.
Author contributions
Davide Carino: Conceptualization; Data curation; Formal analysis; Investigation; Methodology; Project administration; Resources; Validation; Visualization; Writing—original draft; Writing—review and editing. Paolo Denti: Conceptualization; Methodology; Supervision; Validation. Guido Ascione: Data curation; Formal analysis; Investigation; Software. Benedetto Del Forno: Formal analysis; Investigation; Methodology; Validation. Elisabetta Lapenna: Conceptualization; Investigation; Methodology; Supervision; Validation. Stefania Ruggeri: Formal analysis; Methodology; Software; Visualization. Eustachio Agricola: Investigation; Methodology; Resources; Validation. Nicola Buzzatti: Investigation; Methodology; Validation. Alessandro Verzini: Resources; Supervision; Validation. Roberta Meneghin: Data curation. Anna Mara Scandroglio: Investigation; Methodology; Resources; Validation. Fabrizio Monaco: Investigation; Methodology; Resources; Validation. Alessandro Castiglioni: Funding acquisition; Resources; Supervision; Validation. Ottavio Alfieri: Funding acquisition; Project administration; Supervision; Validation; Visualization. Michele De Bonis: Conceptualization; Funding acquisition; Investigation; Methodology; Project administration; Resources; Supervision; Validation; Writing—review and editing.
Reviewer information
European Journal of Cardio-Thoracic Surgery thanks the anonymous reviewer(s) for their contribution to the peer review process of this article.
Presented at the 34th Annual Meeting of the European Association for Cardio-Thoracic Surgery, Barcelona, Spain, 8-10 October 2020.
