


Abstract

With improvements in the outcome of treatment for non-small-cell lung cancer (NSCLC), other diseases may account for a high death rate after surgery in patients with stage I NSCLC. In the present study, we analysed the associations between the clinical factors and non-cancer death after surgery in these patients.
The records of 514 patients with stage I NSCLC who underwent surgery were retrospectively reviewed; a proportional hazards model for the subdistribution of a competing risk was conducted to define the risk factors for non-cancer death.
The mean patient age was 67 years. A total of 367 patients (71%) underwent bilobectomy or lobectomy while 147 (29%) underwent sublobar resection. The pathological stage was IA in 386 (75%) and IB in 128 (25%) patients. Three patients (0.6%) died within 90 days after surgery, and 108 (21%) experienced postoperative complications. Until the time of writing this report, 83 patients had died during the follow-up. The cause of death was primary lung cancer in 38 (46%) patients and other diseases in 45 (54%) patients, including non-cancer causes in 29 patients, such as pneumonia, cardiac death and cerebral stroke. According to a multivariable competing risk analysis for non-cancer death age (≥70 years), sex (male), body mass index (BMI <18.5), postoperative complications and % forced expiratory volume in 1 s (<80) were identified as risk factors for postoperative non-cancer death.
Advanced age (≥70 years), male sex, low BMI (<18.5), postoperative complications and low preoperative % forced expiratory volume in 1 s (<80) were found to be the risk factors for postoperative non-cancer death after surgery in patients with stage I NSCLC.
INTRODUCTION
Lung cancer is the leading cause of cancer-related deaths worldwide [1]. In general, the first choice of treatment for patients with stage I–II non-small-cell lung cancer (NSCLC) who can tolerate an operation is surgery with or without adjuvant chemotherapy [2]. The 5-year overall survival rate following surgery for NSCLC has improved over time not only because of the increased ratio of stage I NSCLC cases but also because of improved treatment outcomes for these patients [3]. As a result, the number of patients who survive after lung cancer surgery is increasing.
There have been many reports describing the relationship between clinical factors, such as comorbidities, occurrence of postoperative complications and parameters of respiratory function tests, and the long-term outcomes after surgery for NSCLC [4–8]. However, the end point of these studies was usually the overall survival, which accounts for all causes of death, and little information is available regarding the risk factors for non-cancer death after surgery for NSCLC [9]. With improvement in the outcome of treatment, other diseases may account for an increasing percentage of deaths after surgery for patients with stage I NSCLC, indicating that care for the general condition of those who have undergone lung cancer surgery is an important issue [10, 11].
When focused on the pulmonary function, previous studies have found a significant relationship between the preoperative pulmonary function and the prognosis in patients who undergo lung cancer surgery, with a lower preoperative lung function and predicted postoperative (ppo) lung function reported to be significant predictors of a worse survival [7, 8]. However, details regarding the causes of death were not described in those reports, and the association between pulmonary function and death from other diseases after surgery in patients with NSCLC is unknown.
In the present study, we analysed the clinical factors including pulmonary function and cause-specific long-term outcomes after surgery in patients with stage I NSCLC to identify risk factors for non-cancer death following lung cancer surgery.
PATIENTS AND METHODS
Patients
Between 2007 and 2014, 694 patients underwent surgery for NSCLC with curative intent at the Osaka University Hospital, of whom 531 were diagnosed with pathological stage I disease. After excluding 17 (9 with a history of pulmonary resection, 4 who underwent induction therapy and 4 without pulmonary function data), 514 consecutive patients were enrolled in this retrospective study. Staging was assessed according to the International Association for the Study of Lung Cancer Staging Manual in Thoracic Oncology, seventh edition [12].
Perioperative management and patient follow-up
Wide-wedge resection was counted as one-segment loss in the present study. The type of resection and the omission of mediastinal lymph node dissection were determined for each case according to the characteristics of the tumour and the patient’s respiratory function and general condition. Generally, sublobar resection was selected with curative intent in patients indicated to have ground-glass opacity lesions or solid dominant lesions smaller than 1.5 cm in size. Our treatment algorithm for limited resection of small-sized lung cancer during the study period has already been described [16]. Sublobar resection due to comorbidities was selected in cases of poor respiratory function or other comorbidities, such as cerebral infarction sequelae, dementia, advanced age or multiple lung cancer.
Patient follow-up was performed as previously described [17]. Chest roentgenogram examinations and measurements of carcinoembryonic antigens in serum were performed every 3–6 months after surgery, while contrast-enhanced chest computed tomography (CT), contrast-enhanced brain CT, magnetic resonance imaging and bone scintigraphy were routinely performed annually during the follow-up period as surveillance for lung cancer recurrence. Patient follow-up was continued for at least 5 years after surgery. Whether follow-up was continued beyond 5 years after surgery was determined for each case considering the patients’ general condition and desire. The time interval between surgery and the latest follow-up in the present study ranged from 1 to 131 months (median, 55 months).
Methods
This study was a retrospective, single-institution study. The study protocol was approved by the Ethical Review Board for Clinical Studies at the Osaka University (control number 18237). A thorough review of the patient charts was conducted, and the medical history (pulmonary, cardiovascular and cerebrovascular diseases, diabetes mellitus and kidney disease) was collected. The criteria used to determine chronic obstructive pulmonary disease (COPD) were based on the third edition of the Guidelines for the Diagnosis and Treatment of COPD, presented by the Japanese Respiratory Society [18]. Chronic kidney disease was defined according to the Clinical Practice Guideline for the Diagnosis and Treatment of Chronic Kidney Disease, 2012, published by the Japanese Society of Nephrology [19]. The duration of the operation, intraoperative bleeding and postoperative complications were also reviewed. Postoperative complications were graded according to the Clavien–Dindo classification of surgical complications [20].
Determination of the cause of death
In principle, the determination of the cause of death was conducted based on documents, that is, charts or certificates of death. In the event of patient death at the Osaka University Hospital, the information on the cause of death was obtained from the charts. If death occurs in other hospitals, the information on the cause of death is obtained from the doctors in charge of these hospitals. In Japan, when a patient dies outside the hospital, the cause of death is judged by a doctor who sees the patient in general. A death certificate, including the cause of death, is issued by the doctor as long as the cause of death is related to the diseases documented at the time of death. In these cases, the information on the cause of death is obtained from the doctor in charge. When the patient dies outside the hospital and the cause of death is not associated with the diseases documented at the time of death, the cause of death is determined by the medical examiner. In these cases, the information on the cause of death is obtained from the patient’s family. In 5 patients, the cause of death was not determined even after the data collection described above, although no cases of recurrence of primary lung cancer or another type of cancer were documented. The cause of death in these patents was defined as ‘non-cancer, not otherwise specified’, in the present study.
Statistical analysis
Values were expressed as mean ± standard deviation. Because cancer death was regarded as a competing risk to non-cancer death, a proportional hazards model for the subdistribution of competing risks was conducted to define risk factors for non-cancer death [21]. In the present study, cancer death included death not only due to lung cancer but also due to other cancers. The predictive and complexity characteristics of the model were considered during modelling. The evaluation criteria for variable selection, the goodness of fit and the significance of model measures for a proportional hazards model for the subdistribution of a competing risk were used based on the Akaike criteria. A P-value of <0.05 was considered statistically significant. A univariable competing risk analysis was performed using candidate clinical factors, including respiratory function parameters for non-cancer death. Then, a multivariable competing risk analysis for non-cancer death was performed using factors with P-values ≤0.1. All statistical analyses were performed using the JMP Pro 13 and SAS 9.4 software programme (SAS Institute, Berkley, CA, USA).
RESULTS
Patient characteristics are shown in Table 1. The mean age of the patients was 67 years. Ninety-nine patients (19%) had a low %FEV1 (cut-off 80%), and 177 (34%) had a low DLco (cut-off 80%). As for comorbid diseases, a marked proportion of patients (29%) had a history of other cancers or various cardiovascular diseases. Operative procedure-related factors are summarized in Table 2. Three hundred sixty-seven (71%) patients underwent bilobectomy or lobectomy, while 147 (29%) underwent sublobar resection. The pathological stage was IA in 386 (75%) and IB in 128 (25%) patients. Three (0.6%) patients died within 90 days after surgery, and 108 (21%) experienced postoperative complications. Of these, 33 (6%) suffered from grade ≥3 complications. The details of the postoperative complications are shown in Supplementary Material, Table S1.
Patient characteristics
| Factor | n = 514 |
|---|---|
| Age (years) | |
| Mean ± SD | 67 ± 10 |
| Range | 17–86 |
| Sex, n (%) | |
| Male | 278 (54) |
| Female | 236 (46) |
| BMI, n (%) | |
| <18.5 | 53 (10) |
| 18.5 ≤ BMI < 25 | 377 (73) |
| 25 ≤ BMI < 30 | 80 (16) |
| ≥30 | 4 (1) |
| Smoking status, n (%) | |
| Never | 239 (46) |
| Smoker | 275 (54) |
| %FEV1, n (%) | |
| <80% | 99 (19) |
| ≥80% | 415 (81) |
| %DLco, n (%) | |
| <80% | 177 (34) |
| ≥80% | 337 (66) |
| ppo%FEV1, n (%) | |
| <60% | 69 (13) |
| ≥60% | 445 (87) |
| ppo%DLco, n (%) | |
| <60% | 121 (24) |
| ≥60% | 393 (76) |
| Aortic valve disease, n (%) | 15 (3) |
| Mitral valve disease, n (%) | 12 (2) |
| Congestive heart failure, n (%) | 16 (3) |
| Coronary artery disease, n (%) | 40 (8) |
| Hypertension, n (%) | 164 (32) |
| Diabetes mellitus, n (%) | 80 (16) |
| Cerebrovascular disease, n (%) | 32 (6) |
| Atrial fibrillation, n (%) | 22 (4) |
| Atherosclerotic disease, n (%) | 50 (10) |
| Chronic kidney disease, n (%) | 46 (9) |
| COPD, n (%) | 103 (20) |
| Interstitial lung disease, n (%) | 25 (5) |
| Liver disease, n (%) | 27 (5) |
| History of other cancers, n (%) | 151 (29) |
BMI: body mass index; COPD: chronic obstructive pulmonary disease; DLco: carbon monoxide lung diffusion capacity; %FEV1: % forced expiratory volume in 1 s; ppo: predicted postoperative; SD: standard deviation.
Operative procedure-related factors
| Factor | n = 514 |
|---|---|
| Tumour size (cm) | |
| Mean ± SD | 2.3 ± 1.1 |
| Range | 0.2–5.5 |
| Surgical approach, n (%) | |
| VATS | 323 (63) |
| Thoracotomy | 191 (37) |
| Sleeve resection | 7 (1) |
| Type of resection, n (%) | |
| Bilobectomy | 6 (1) |
| Lobectomy | 361 (70) |
| Segmentectomy | 96 (19) |
| Wide-wedge resection | 51 (10) |
| Histology, n (%) | |
| Adenocarcinoma | 425 (83) |
| Squamous cell carcinoma | 71 (14) |
| Other histologic types | 18 (3) |
| Pathological stage, n (%) | |
| IA | 386 (75) |
| IB | 128 (25) |
SD: standard deviation; VATS: video-assisted thoracic surgery.
At the time of writing this report, 420 (82%) patients had complete follow-up data, that is, records of recent visits or observations of the 5 years after surgery, while 94 patients (18%) were lost to follow-up during the 5 years after surgery. Data of patients lost to follow-up were regarded as censored at the time of the latest visit with the status at that time. Eighty-three patients died, with the causes of death shown in Table 3. Of the 83 patients who died, 38 (46%) had primary lung cancer and 45 (54%) had other diseases. Among patients who died from other diseases, 29 died of non-cancer causes, such as pneumonia, cardiac death or cerebral stroke. Three perioperative mortalities were included in this group.
Cause of death
| Causes of death | |
|---|---|
| Total number of deaths | 83 |
| Primary disease, n (%) | 38 (46) |
| Another disease, n (%) | 45 (54) |
| Another cancer | 16 (19) |
| Non-cancer | 29 (35) |
| Pneumonia | 6 (7) |
| Non-cancer death, not otherwise specified | 5 (6) |
| Cardiac death | 4 (5) |
| Multiple organ failure | 4 (5) |
| Cerebral stroke | 4 (5) |
| Perioperative mortality | 3 (4) |
| Bleeding disorder | 2 (2) |
| Suicide | 1 (1) |
We performed a univariable competing risk analysis to examine the association between clinical factors, including respiratory function parameters and cause-specific death (Table 4). Age (≥70 years), sex (male), body mass index (BMI) (<18.5), smoking status (smoker), heart disease, cerebrovascular disease, surgical approach (thoracotomy), postoperative complications, %FEV1 (<80), ppo%FEV1 (<60) and ppoDLco (<60) were significantly associated with non-cancer death. We then performed a multivariable competing risk analysis for non-cancer death using factors with P-values <0.1. Because the %FEV1 and ppo%FEV1 were highly correlated, the parameter with the higher hazard ratio, i.e. %FEV1, was used in the subsequent multivariable analysis. As a result, age (≥70 years), sex (male), BMI (<18.5), postoperative complication and %FEV1 (<80) were identified as risk factors for postoperative non-cancer deaths (Table 5). The cancer and non-cancer death rate curves according to these factors are shown in Fig. 1. The age of non-cancer death cases is shown in Fig. 2. Most of the patients in the present cohort who died were older than 75 years.
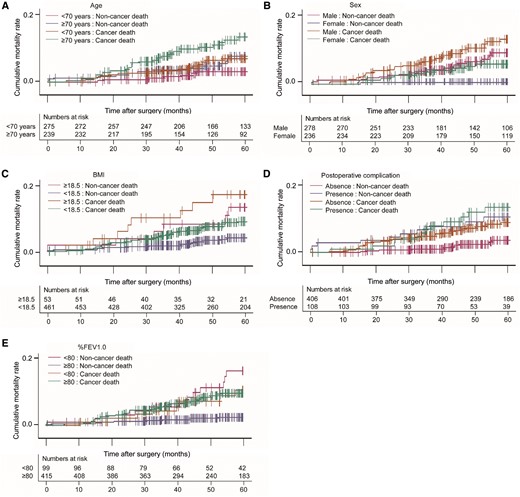
The cancer and non-cancer death rate curves according to risk factors for non-cancer death. (A) Cancer and non-cancer deaths after surgery according to age. Magenta; ≤70 years: non-cancer death, blue; ≥70 years: non-cancer death, orange; ≤70 years: cancer death, green; ≥70 years: cancer death. (B) Cancer death and non-cancer death after surgery according to sex. Magenta; male: non-cancer death, blue; female: non-cancer death, orange; male: cancer death green; female: cancer death. (C) Cancer and non-cancer deaths after surgery according to BMI. Magenta; ≥18.5: non-cancer death, blue; ≤18.5: non-cancer death, orange; male: cancer death, green; female: cancer death. (D) Cancer and non-cancer deaths after surgery according to postoperative complications. Magenta; absence: non-cancer death; blue: presence: non-cancer death; orange: absence: cancer death; green: presence: cancer death. (E) Cancer and non-cancer deaths after surgery according to %FEV1.0. Magenta; ≤80: non-cancer death, blue; ≥80: non-cancer death, orange; ≤80: cancer death, green; ≥80: cancer death. Vertical lines indicate censored cases. BMI: body mass index; %FEV1.0: percent forced expiratory volume in 1 s.
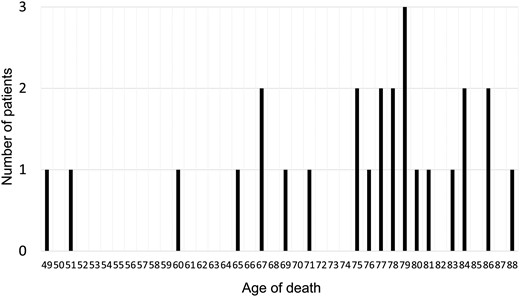
Distribution of age in non-cancer death cases.
Results of a univariable competing risk analysis for cause-specific death
| Factor | Cause of death | Hazard ratio | 95% CI | P-value |
|---|---|---|---|---|
| Age (≥70 vs <70 years) | Non-cancer death | 3.303 | 1.484–7.348 | 0.0034 |
| Cancer death | 2.210 | 1.271–3.843 | 0.005 | |
| Sex (male vs female) | Non-cancer death | 8.737 | 2.642–28.894 | 0.0004 |
| Cancer death | 2.605 | 1.435–4.731 | 0.0017 | |
| BMI (<18.5 vs ≥18.5) | Non-cancer death | 4.016 | 1.756–9.197 | 0.001 |
| Cancer death | 2.008 | 0.979–4.121 | 0.057 | |
| Smoking status (smoker vs non-smoker) | Non-cancer death | 4.955 | 1.889–12.998 | 0.0011 |
| Cancer death | 2.212 | 1.245–3.932 | 0.0068 | |
| Heart diseases | Non-cancer death | 4.754 | 2.244–10.074 | <0.0001 |
| Cancer death | 1.649 | 0.847–3.207 | 0.1409 | |
| Hypertension | Non-cancer death | 1.843 | 0.865–3.924 | 0.1129 |
| Cancer death | 1.574 | 0.905–2.738 | 0.1082 | |
| Diabetes mellitus | Non-cancer death | 2.233 | 0.986–5.054 | 0.054 |
| Cancer death | 2.047 | 1.112–3.767 | 0.0214 | |
| Atherosclerotic disease | Non-cancer death | 2.241 | 0.851–5.905 | 0.1026 |
| Cancer death | 2.625 | 1.351–5.097 | 0.0044 | |
| Cerebrovascular diseases | Non-cancer death | 3.427 | 1.296–9.062 | 0.013 |
| Cancer death | 0.972 | 0.303–3.121 | 0.962 | |
| Chronic kidney disease | Non-cancer death | 2.199 | 0.832–5.810 | 0.112 |
| Cancer death | 2.544 | 1.307–4.954 | 0.006 | |
| Surgical approach (thoracotomy vs VATS) | Non-cancer death | 2.512 | 1.149–5.494 | 0.0211 |
| Cancer death | 1.447 | 0.839–2.498 | 0.1842 | |
| Extent of lung resection (sublobar vs lobectomy) | Non-cancer death | 1.473 | 0.684–3.169 | 0.3225 |
| Cancer death | 1.092 | 0.600–1.983 | 0.7737 | |
| Postoperative complication | Non-cancer death | 3.545 | 1.700–7.389 | 0.0007 |
| Cancer death | 1.652 | 0.909–3.002 | 0.0997 | |
| %FEV1 (<80 vs ≥80) | Non-cancer death | 5.257 | 2.500–11.057 | <0.0001 |
| Cancer death | 1.174 | 0.605–2.278 | 0.6354 | |
| %DLco (<80 vs ≥80) | Non-cancer death | 1.712 | 0.822–3.567 | 0.1508 |
| Cancer death | 1.391 | 0.807–2.398 | 0.2347 | |
| ppo%FEV1 (<60 vs ≥60) | Non-cancer death | 4.88 | 2.281–10.440 | <0.0001 |
| Cancer death | 1.905 | 0.981–3.699 | 0.0569 | |
| ppo%DLco (<60 vs ≥60) | Non-cancer death | 2.549 | 1.216–5.345 | 0.0132 |
| Cancer death | 1.461 | 0.814–2.622 | 0.2036 | |
| Pathological stage (IB vs IA) | Non-cancer death | 2.093 | 0.998–4.391 | 0.0507 |
| Cancer death | 1.706 | 0.981–2.966 | 0.0584 |
BMI: body mass index; DLco: carbon monoxide lung diffusion capacity; %FEV1: % forced expiratory volume in 1 s; ppo: predicted postoperative; VATS: video-assisted thoracic surgery.
Results of a multivariable competing risk analysis for non-cancer death
| Factor | Hazard ratio | 95% CI | P-value |
|---|---|---|---|
| Age (≥70 vs <70 years) | 2.803 | 1.194–6.581 | 0.0179 |
| Sex (male vs female) | 6.417 | 1.172–35.149 | 0.0322 |
| BMI (<18.5 vs ≥18.5) | 3.35 | 1.312–8.555 | 0.0115 |
| Smoking status | 1.483 | 0.343–6.417 | 0.5977 |
| Heart diseases | 1.881 | 0.789–4.481 | 0.1539 |
| Diabetes mellitus | 1.775 | 0.712–4.423 | 0.218 |
| Cerebrovascular diseases | 1.412 | 0.455–4.382 | 0.5506 |
| Surgical approach (thoracotomy vs VATS) | 1.618 | 0.674–3.880 | 0.2813 |
| Postoperative complications | 2.446 | 1.078–5.546 | 0.0323 |
| %FEV1 (<80 vs ≥80) | 3.025 | 1.292–7.084 | 0.0108 |
| ppo%DLco (<60 vs ≥60) | 1.563 | 0.691–3.535 | 0.2837 |
| Pathological stage (IB vs IA) | 1.41 | 0.624–3.188 | 0.4092 |
BMI: body mass index; DLco: carbon monoxide lung diffusion capacity; %FEV1: % forced expiratory volume in 1 s; ppo: predicted postoperative; VATS: video-assisted thoracic surgery.
DISCUSSION
The multivariable competing risk analysis in the present study showed that an advanced age (≥70 years), the male sex, a low BMI (<18.5), postoperative complications and a low preoperative %FEV1 (<80) were risk factors for postoperative non-cancer death in patients with stage I NSCLC.
The most commonly used regression model for analysing event-time data is the Cox proportional hazards model. However, the standard Cox proportional hazards model is considered to be inappropriate in the presence of competing risks because the cause-specific Cox model treats competing risks of the event of interest as independent or non-informative censoring. In other words, the Cox model does not include information on the fact that a patient who died due to cancer cannot die due to non-cancer causes. To overcome this disadvantage, Fine and Gray [21] proposed a model for the subdistribution hazard of the cumulative incidence function. The distribution hazard is defined as the hazard of failing from a given cause in the presence of competing events. Because cancer death was regarded as a competing risk to non-cancer death, we used this proportional hazards model for the subdistribution of a competing risk to define risk factors for non-cancer death.
It seems reasonable that age is a risk factor for postoperative non-cancer death because the incidence of community-onset pneumonia and coronary artery disease reportedly increases with age, as does the risk of death from these diseases [22, 23]. In addition, epidemiological evidence supports the notion that the incidence of death from cardiopulmonary diseases is higher in men than in women [22, 23]. In terms of BMI, the results of several studies support our results. Nakagawa et al. [4] recently reported that a low BMI is a negative prognostic factor after lung cancer surgery, and a low BMI was also shown to be relevant to death from pneumonia [24].
The association between the occurrence of postoperative complications and a worse survival after lung cancer surgery is a remarkable result. This phenomenon may be attributed to either an increased risk of cancer recurrence or an increased risk of non-cancer death, or both. Andalib et al. [5] reported that postoperative complications were an independent prognostic factor after adjusting for several patient- and treatment-related factors in patients who had undergone lung cancer surgery. However, Lugg et al. [9] analysed the details underlying the cause of death after lung cancer surgery. They reported that patients who developed postoperative pulmonary complications had a higher rate of non-cancer-related death than those without such complications, and postoperative pulmonary complications were shown to be a significant independent risk factor for late death in patients with NSCLC who underwent surgery. Their findings support the results of the present study.
Several reports on the relationship between pulmonary function parameters and short-term outcomes in patients undergoing lung cancer surgery have been presented [6]. Regarding short-term outcomes, Zhang et al. [25] reported that the ppoFEV1% and ppoDLco% predict postoperative pulmonary complications after open lobectomy as well as after minimally invasive lobectomy. Ferguson et al. [7] found that ppoDLco and ppoFEV1 were strongly associated with long-term survival. Berry et al. [8] reported the findings of a univariable analysis showing that the DLco and FEV1 were significantly associated with the 5-year overall survival in patients with stage I NSCLC, with a larger tumour size and lower DLco found to be significant predictors of a worse survival in a multivariable analysis. However, these studies lacked details regarding the cause of death. Reduced pulmonary function parameters may be correlated with both a poor general condition of the patient and the degree of malignancy of the tumour itself, although their full meaning remains unclear. Ozeki et al. [26] noted that low DLco in NSCLC indicates a strong relationship between DLco and the degree of malignancy. They compared patients with low (≤80%) and normal (>80%) DLco who underwent surgery for lung adenocarcinoma and analysed the relationship between the DLco status and histopathological indices, such as the degree of differentiation and the nuclear atypia grade. Their results demonstrated that low DLco had a significant correlation with those indices, even after adjusting for other clinical factors. Their findings suggest that the association of low DLco with worse prognosis is due, at least in part, to the degree of malignancy of the tumour. However, to our knowledge, the present results are the first to show a significant relationship between pulmonary function parameters and non-cancer death after surgery in patients with NSCLC.
Whether non-cancer deaths after lung cancer surgery are entirely preventable is uncertain. According to nationwide statistics in Japan, the leading causes of death in the general population are malignancy, cardiac disease, cerebrovascular disease and pneumonia [27]. Considering this finding, cancer survivors will eventually die from other diseases, such as pneumonia or cardiac diseases. Indeed, the causes of non-cancer death found in the present study were pneumonia, cardiac death, multiple organ failure and cerebral stroke, and most of our patients died after reaching 75 years of age. Therefore, most non-cancer deaths after lung cancer surgery seem difficult to prevent, although some may be preventable. For example, lung cancer surgery survivors may be at higher risk for morbidity than those who have not undergone lung cancer surgery in the setting of pneumococcal or influenza infection [11], for which vaccination may be effective [28]. Therefore, treatments for comorbid conditions, such as cardiovascular disease or COPD, should be appropriately considered for patients who have undergone lung cancer surgery, alongside recommendations for healthy behaviours that address smoking cessation and increase physical activity [10].
The precise definition of non-cancer death is sometimes difficult. In the present study, the determination of the cause of death was conducted based on documents, that is chart, certificate of death in principle, as described in the Methods section. This means that the actual judgement of cancer death was made by each doctor in charge. As a common understanding among doctors, cancer death occurs in patients with advanced cancer, which cannot be controlled anymore and spreads to healthy tissues and organs. However, pneumonia occurring in a patient with recurrent lung cancer, for example could be cancer related but also cancer unrelated, and sometimes it is difficult to draw a line. In the present study, 3 out of 29 (10%) patients in the non-cancer death group experienced a relapse of lung cancer. Because recurrent diseases in these patients were controlled (surgical margin relapse controlled by radiotherapy, brain metastasis controlled by surgery and pulmonary metastasis controlled by radiotherapy), the cause of death was judged as non-cancer death. It is considered that difficulty in the precise definition of non-cancer death is an essential limitation of the present study.
Limitations
Several limitations associated with the present study warrant mention. First, a comparison of non-cancer death rates between the study population and the general population is needed to validate the treatment strategy in which surgery is the first choice treatment mode, especially for patients with risk factors for non-cancer death. Because the data on the cause of death in the general population were not available, this comparison could not be done. Second, not all patients underwent systematic lymph node dissection. There remains a possibility that the downstaging of patients without systematic lymph nodes affects the results. Third, our patients received treatment over an 8-year period, during which there were changes in radiological and therapeutic modalities, which might have affected the outcomes. Fourth, because this was a retrospective single-centre analysis, there may have been patient selection bias. Patients with several comorbidities tend to be referred to a university hospital, making it difficult to draw a definitive conclusion regarding the risk factors associated with postoperative non-cancer death. A future multicentre study is needed to draw more detailed conclusions.
CONCLUSION
Advanced age (≥70 years), male sex, low BMI (<18.5), postoperative complications and low preoperative %FEV1 (<80) were found to be risk factors for postoperative non-cancer death after surgery in patients with stage I NSCLC. Thoracic surgeons should consider appropriate care in the follow-up period for patients who have risk factors for postoperative non-cancer death.
SUPPLEMENTARY MATERIAL
Supplementary material is available at EJCTS online.
Conflict of interest: none declared.
Author contributions
Ryu Kanzaki: Conceptualization; Data curation; Formal analysis; Funding acquisition; Investigation; Methodology; Project administration; Writing—original draft. Akihiro Nagoya: Data curation; Writing—review & editing. Takashi Kanou: Data curation; Writing—review & editing. Naoko Ose: Data curation; Writing—review & editing. Soichiro Funaki: Data curation; Writing—review & editing. Masato Minami: Data curation; Writing—review & editing. Yuna Okamoto: Data curation; Writing—review & editing. Hiroto Tabuchi: Data curation; Writing—review & editing. Tomoko Hoshino: Data curation; Writing—review & editing. Tetsuya Tajima: Formal analysis; Methodology; Software; Writing—review & editing. Makoto Fujii: Formal analysis; Methodology; Software; Validation; Writing—review & editing. Yuko Ohno: Formal analysis; Methodology; Software; Supervision; Writing—original draft. Yasushi Shintani: Data curation; Supervision; Writing—review & editing.
Reviewer information
European Journal of Cardio-Thoracic Surgery thanks René Horsleben Petersen, Madhuri Rao and the other, anonymous reviewer(s) for their contribution to the peer review process of this article.
REFERENCES
Japan Lung Cancer Society (
Committee for the Third Edition of the COPD Guidelines of the Japanese Respiratory Society. Guidelines for the Diagnosis and Treatment of COPD (Chronic Obstructive Disease) (3rd edn). Tokyo, Japan: Nihon Kokyuki Gakkai Zasshi,
Japanese Nephrology Society.
Guidelines for the Primary Prevention of Ischemic Heart Disease Revised Version (JCS 2012). http://wwwj-circorjp/guideline/pdf/JCS2012_shimamoto_hpdf
Analysis of Cause of Death. Japanese Ministry of Health, Labour and Welfare. https://www.mhlw.go.jp/toukei/saikin/hw/life/life10/04.html (5 October
ABBREVIATIONS
- BMI
Body mass index
- COPD
Chronic obstructive pulmonary disease
- CT
Computed tomography
- DLco
Carbon monoxide lung diffusion capacity
- FEV1
Forced expiratory volume in 1 s
- NSCLC
Non-small-cell lung cancer
- ppo
Predicted postoperative
