


Abstract
Current evidence on sutureless and rapid deployment aortic valve replacement (SURD-AVR) is limited and does not allow for the assessment of the clinical impact and the evolution of procedural and clinical outcomes of this new valve technology. The Sutureless and Rapid Deployment International Registry (SURD-IR) represents a unique opportunity to evaluate the current trends and outcomes of SURD-AVR interventions.
Data from 3682 patients enrolled between 2007 and 2018 were analysed. Patients were divided according to the date of surgery into 6 equal groups and by the type of intervention: isolated SURD-AVR (n = 2472) and combined SURD-AVR (n = 1086).
Across the 11-year study period, significant changes occurred in patient characteristics including a decrease in age and in estimated surgical risk. Less invasive approaches for isolated SURD-AVR increased considerably from 49.4% to 85.5%. The overall in-hospital mortality rate was 1.6% and 3.9% in isolated and combined procedures, respectively, with no change over time. The rate of perioperative stroke decreased significantly (from 4% to 0.5%), as did the rates of postoperative pacemaker implantation (from 12.8% to 5.9%) and aortic regurgitation (from 17.8% to 2.7%).
The present study provides a comprehensive analysis of the current trends and results of SURD-AVR interventions. The most notable changes over time were the increasing implantation of SURD valves in a younger population, with more frequent utilization of less invasive techniques. SURD-AVR demonstrated remarkable improvements in clinical outcomes with a significant reduction in the rates of stroke, pacemaker implantation and postoperative aortic regurgitation.

INTRODUCTION
Over the last decade, the therapeutic options for patients with aortic valve disease have expanded considerably as demonstrated by the exponential growth of catheter-based aortic valve implants the popularizing of minimally invasive surgical aortic valve replacement (AVR) techniques and the introduction of new valve technologies such as sutureless and rapid deployment (SURD) valves [1]. Yet, the current evidence on SURD-AVR interventions is limited to small multicentric clinical trials or single-centre series that do not adequately reflect the real-world situation and do not allow assessment of the clinical impact and of the evolution of procedural and clinical outcomes of these new valve technologies. The Sutureless and Rapid Deployment International Registry (SURD-IR) offers a unique opportunity to analyse trends in demographics, operative techniques and in-hospital results in the worldwide largest SURD patient population operated on during an 11-year period [2]. In the present study, we describe the trends in patient characteristics and the in-hospital outcomes of patients undergoing isolated and combined SURD-AVR.
PATIENTS AND METHODS
Patient population
The SURD-IR is a multicentric registry that includes patients undergoing SURD-AVR interventions using any available SURD valve prosthesis: Perceval S (LivaNova PLC, London, UK), Edwards Intuity/Intuity Elite (Edwards Lifesciences, Irvine, CA, USA) and Enable 3F (Medtronic, Minneapolis, MN, USA). Further details of the registry were published previously [2, 3].
At the time of the present study, 3682 patients were enrolled in the registry between April 2007 and February 2018. Patients who received the off-market Enable 3F valve (n = 123), as well as patients with missing data on the key study variable—date of surgery—(n = 1), were excluded. The final study population comprised 3558 patients who underwent isolated SURD-AVR (n = 2472) or combined SURD-AVR (n = 1086). Both study cohorts were divided into 6 equal groups in chronological order over an 11-year period. Group data were analysed for historical trends in demographic characteristics, operative data and in-hospital results. The definitions of the main variables are described in the Supplementary Material.
Statistical analysis
Categorical variables are reported as absolute values and percentages. Percentages were calculated with the available data as the denominator. Continuous variables are expressed as mean ± standard deviation or median and interquartile range when continuous variables did not follow a normal distribution (tested using the Kolmogorov–Smirnov test for normality and Q–Q plots). Categorical variables were compared using a 2-sided χ2analysis or the Fisher’s exact test where appropriate.
Differences among patient groups stratified by time periods for continuous variables were determined utilizing one-way analysis of variance. The Mantel–Haenszel test for trend was used to calculate time trends between categorical variables. A P-value <0.05 was considered statistically significant. SPSS (version 25.0, IBM Corp., Armonk, NY, USA) was used for all analyses.
RESULTS
Patient characteristics
Isolated sutureless and rapid deployment aortic valve replacements
During the 11-year study period, 2472 (69.5%) patients underwent isolated SURD-AVR. The age distribution significantly decreased over time, from 78.2 to 73.5 years (P < 0.001), with SURD valves being implanted more frequently in patients aged <65 years in the last time period (from 1.7% to 12.7%; P < 0.001).
Significant trends in patient comorbidities were noted, with more patients presenting with a history of hypertension in most years, but fewer with advanced New York Heart Association functional class symptoms, reduced left ventricular function and renal insufficiency. Accordingly, the median logistic EuroSCORE decreased from 8.4% to 5.5% (P < 0.001). A bicuspid aortic valve (BAV) was observed in 5.1% of cases, with a growing incidence in the later time periods (P = 0.032). Trends in patient demographics are reported in Table 1.
Isolated sutureless and rapid deployment aortic valve replacement: patient demographics (n = 2472)
| Group 1 (n = 412) | Group 2 (n = 412) | Group 3 (n = 412) | Group 4 (n = 412) | Group 5 (n = 412) | Group 6 (n = 412) | Trend P-value | |
|---|---|---|---|---|---|---|---|
| Male gender | 28.7 | 37.9 | 39.4 | 34.5 | 42.8 | 44.8 | <0.001 |
| Age (years) | 78.2 ± 5.6 | 77.1 ± 6.8 | 76.4 ± 7.3 | 76.8 ± 7 | 75.9 ± 7.1 | 73.5 ± 7.2 | <0.001 |
| Age <65 years | 1.7 | 5.6 | 6.6 | 3.6 | 6.3 | 12.7 | <0.001 |
| Hypertension | 72.1 | 81.1 | 76.9 | 83.7 | 83 | 89.6 | <0.001 |
| Diabetes | 28.8 | 28.5 | 30.6 | 25.8 | 27.3 | 26.6 | 0.31 |
| Obesity | 27.4 | 25.9 | 26.2 | 25 | 29.4 | 23.2 | 0.52 |
| AF | 16.9 | 11 | 10.9 | 14.2 | 17.4 | 9 | 0.31 |
| PM | 4.5 | 6.9 | 2.3 | 3.8 | 2.7 | 2.7 | 0.013 |
| NYHA functional class | <0.001 | ||||||
| I | 2.3 | 4.5 | 6.9 | 5.6 | 6.4 | 7.6 | |
| II | 23.1 | 43.1 | 37.2 | 54.5 | 50.5 | 48.1 | |
| III | 66.2 | 57.1 | 51.3 | 36.8 | 39 | 42.4 | |
| IV | 8.3 | 4.3 | 4.6 | 3.1 | 4.1 | 1.7 | |
| Valve disease | 0.48 | ||||||
| Stenosis | 86.3 | 47.1 | 54.8 | 60.6 | 58.6 | 74.6 | |
| Insufficiency | 0.3 | 2.2 | 1.3 | 1.5 | |||
| Mixed | 13.5 | 52.9 | 45.2 | 36.9 | 40.1 | 23.9 | |
| Other | 0.2 | ||||||
| BAV | 2.5 | 3.5 | 4.9 | 7.4 | 6.9 | 5.3 | 0.032 |
| LVEF ≤50% | 17.3 | 18.8 | 24.4 | 16.8 | 18.5 | 12.3 | 0.029 |
| Active endocarditis | 0.8 | 0.6 | 1.2 | 1.3 | 0.034 | ||
| CVD | 7.5 | 11.8 | 10.5 | 11.4 | 10.8 | 11.6 | 0.12 |
| Renal insufficiency | 57.8 | 33.7 | 31.8 | 49.6 | 47.2 | 46.4 | 0.028 |
| Dialysis | 2.2 | 1.5 | 0.6 | 0.6 | 0.6 | 0.082 | |
| Chronic lung disease | 17.7 | 12.5 | 14.4 | 16.4 | 18.6 | 11.6 | 0.41 |
| Logistic EuroSCORE | 8.4 (6.2–12.7) | 8.1 (5.5–13.2) | 8.4 (5.1–13) | 8.9 (5.8–13.3) | 7.5 (5.5–11.7) | 5.5 (3.5–8) | <0.001 |
Values are % or mean ± standard deviation or median (interquartile range). Time span: group 1, 24 May 2007–22 September 2010; group 2, 28 September 2010–11 December 2012; group 3, 18 December 2012–26 November 2014; group 4, 27 November 2014–18 December 2015; group 5, 20 December 2015–4 January 2017; group 6, 05 January 2017–15 February 2018.
AF: atrial fibrillation; BAV: bicuspid aortic valve; CVD: cerebrovascular disease; LVEF: left ventricular ejection fraction; NYHA: New York Heart Association; PM: pacemaker.
Combined sutureless and rapid deployment aortic valve replacement
Between 2007 and 2018, a total of 1086 patients undergoing combined SURD-AVR were enrolled in the SURD-IR. The mean age was 76.4 ± 7.1 years: 78.9 ± 5.7 years in the first study period and 73.1 ± 7.8 in the last study period (P < 0.001). Accordingly, the rate of younger patients (<65 years) receiving combined SURD-AVR increased markedly in the last time period, from 1.1% to 12.2% (P < 0.001). Higher rates of hypertension, atrial fibrillation and reduced left ventricular function were observed in the recent era, whereas the percentages of obesity, advanced New York Heart Association functional class and chronic lung disease were considerably higher in the first period of data collection. The median logistic EuroSCORE was 8.7% and revealed a significant reduction in the last study period (from 9.1% to 6.7%; P < 0.001). Trends in patient characteristics are detailed in Table 2.
Combined sutureless and rapid deployment aortic valve replacement: patient demographics (n = 1086)
| Group 1 (n = 181) | Group 2 (n = 181) | Group 3 (n = 181) | Group 4 (n = 181) | Group 5 (n = 181) | Group 6 (n = 181) | Trend P-value | |
|---|---|---|---|---|---|---|---|
| Male gender | 33.1 | 48.6 | 49.2 | 49.7 | 61.9 | 60.2 | <0.001 |
| Age (years) | 78.9 ± 5.7 | 77.4 ± 6.4 | 76.8 ± 7.6 | 76.7 ± 6.1 | 75.5 ± 7.3 | 73.1 ± 7.8 | <0.001 |
| Age <65 years | 1.1 | 3.9 | 5.5 | 1.1 | 6.6 | 12.2 | <0.001 |
| Hypertension | 71 | 73.1 | 85.1 | 91.1 | 86.2 | 89.3 | <0.001 |
| Diabetes | 32.2 | 32.7 | 28.2 | 33.1 | 38.8 | 24.4 | 0.53 |
| Obesity | 32 | 31.3 | 23.9 | 26.6 | 25.9 | 18.5 | 0.004 |
| AF | 20.7 | 17.7 | 23.4 | 23.6 | 28.5 | 26 | 0.064 |
| PM | 7.9 | 6.9 | 1.2 | 4.8 | 5.4 | 3.9 | 0.13 |
| NYHA functional class | 0.018 | ||||||
| I | 9 | 8.1 | 7.1 | 9.6 | 5.2 | ||
| II | 29.7 | 25.9 | 26 | 34.5 | 35.9 | 33.1 | |
| III | 63.4 | 61.4 | 56.6 | 47 | 45.5 | 57 | |
| IV | 7 | 3.6 | 9.2 | 11.3 | 9 | 4.7 | |
| Valve disease | <0.001 | ||||||
| Stenosis | 95.4 | 68.8 | 64.2 | 57.1 | 64.6 | 67.3 | |
| Insufficiency | 3.4 | 5.1 | 9.5 | ||||
| Mixed | 4.6 | 31.3 | 35.8 | 39.5 | 30.3 | 23.1 | |
| BAV | 1.3 | 2.8 | 5.4 | 9.1 | 6.8 | 1 | 0.13 |
| LVEF ≤50% | 18.5 | 23.5 | 31.2 | 34.8 | 30.9 | 27.1 | 0.033 |
| Active endocarditis | 0.8 | 2.3 | 2.3 | 0.8 | 3 | 0.064 | |
| CAD | 80.8 | 84.2 | 72.4 | 74.3 | 80.9 | 69.8 | <0.001 |
| CVD | 13.6 | 12.1 | 10.1 | 15.7 | 15.9 | 16.3 | 0.19 |
| Renal insufficiency | 54.8 | 35.5 | 50 | 54.5 | 62.9 | 37.4 | 0.83 |
| Dialysis | 0.8 | 0.7 | 0.8 | 2.3 | 0.7 | 0.46 | |
| Chronic lung disease | 23.1 | 22.5 | 17.8 | 16.4 | 22.7 | 6.9 | 0.001 |
| Logistic EuroSCORE | 9.1 (6.2–13.9) | 9.6 (6.2–15.5) | 9.5 (6.2–18.1) | 9.7 (6.4–19.5) | 9.1 (6–15.1) | 6.7 (4.2–10) | <0.001 |
Values are % or mean ± standard deviation or median (interquartile range). Time span: group 1, 30 May 2007–17 August 2010; group 2, 21 August 2010–12 September 2012; group 3, 13 December 2012–05 December 2014; group 4, 11 December 2014–09 January 2016; group 5, 15 January 2016–3 March 2017; group 6, 9 March 2017–14 February 2018.
AF: atrial fibrillation; BAV: bicuspid aortic valve; CAD: coronary artery disease; CVD: cerebrovascular disease; LVEF: left ventricular ejection fraction; NYHA: New York Heart Association; PM: pacemaker.
Operative data
Isolated sutureless and rapid deployment aortic valve replacement
Overall, 643 (26.2%) procedures were performed through a full sternotomy and 1810 (73.8%) used less invasive approaches (ministernotomy, 47.5%; anterior right thoracotomy, 26.3%). Over the years, there was a substantial increase in the use of less invasive approaches (from 49.4% to 85.5%) and a decline in the use of standard sternotomy (from 50.6% to 14.5%) (P < 0.001) (Fig. 1).
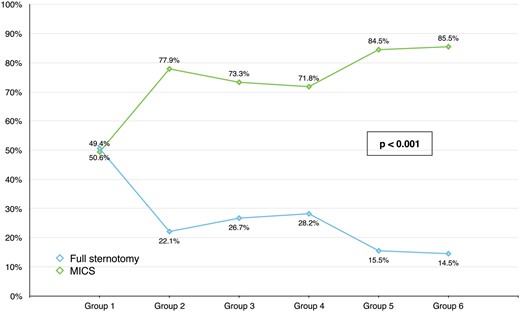
Trends in surgical approach among patients undergoing isolated sutureless and rapid deployment aortic valve replacement. MICS: minimally invasive cardiac surgery.
The frequency of implantation of the Perceval valve was 76.3%, whereas 23.7% of patients received Intuity valves. The percentage of Perceval valves decreased from 88.1% to 62.6% as Intuity implants increased from 11.9% to 37.4% (P < 0.001). The prostheses were implanted successfully in 97.7% of cases with a significant improvement during the observational period (Table 3).
Isolated sutureless and rapid deployment aortic valve replacement: operative data
| Group 1 (n = 412) | Group 2 (n = 412) | Group 3 (n = 412) | Group 4 (n = 412) | Group 5 (n = 412) | Group 6 (n = 412) | Trend P-value | |
|---|---|---|---|---|---|---|---|
| Full sternotomy | 50.6 | 22.1 | 26.7 | 28.2 | 15.5 | 14.5 | <0.001 |
| MICS | 49.4 | 77.9 | 73.3 | 71.8 | 84.5 | 85.5 | <0.001 |
| Ministernotomy | 45.7 | 38.3 | 40.3 | 47.8 | 51.8 | 61.4 | <0.001 |
| ART | 3.7 | 39.6 | 33 | 24 | 32.7 | 24.1 | <0.001 |
| Reintervention | 7.3 | 8.3 | 8.7 | 6.6 | 5.8 | 4.9 | 0.042 |
| Valve type | <0.001 | ||||||
| Perceval | 88.1 | 78.4 | 76.9 | 76.7 | 75 | 62.6 | |
| Intuity/Intuity Elite | 11.9 | 21.6 | 23.1 | 23.3 | 25 | 37.4 | |
| Successful implant | 95.5 | 95.9 | 96.3 | 97.5 | 98.5 | 98.6 | 0.021 |
| CPB timea (min) | 58 (46–73) | 76 (61–98) | 83 (70–103) | 80 (62–98) | 85 (62–107) | 59 (49–78) | <0.001 |
| Clamp timea (min) | 34 (26–43) | 48 (38–60) | 54 (44–68) | 51 (39–65) | 54 (38–68) | 39 (31–52) | <0.001 |
Values are % or median (interquartile range).
Operative times according to valve types and surgical approaches are reported in Supplementary Material, Table S1.
ART: anterior right thoracotomy; CPB: cardiopulmonary bypass; MICS: minimally invasive cardiac surgery.
Combined sutureless and rapid deployment aortic valve replacement
Combined SURD-AVR procedures were most often performed using a standard sternotomy approach (92.6%) with no change over time. A Perceval valve was implanted in 719 (66.2%) patients and an Intuity prosthesis, in 367 (33.8%). The proportion of their use changed significantly in recent years: from 86.7% to 31.5% for the Perceval and from 13.3% to 68.5% for the Intuity valves (P < 0.001). Concomitant procedures included coronary artery bypass grafting (CABG) (74.7%), mitral (16.1%) or tricuspid (7.2%) valve surgery, septal myectomy (9%), the maze procedure (8.6%), thoracic aorta repair (7.4%) and other (6%). Although concomitant CABG experienced a considerable decrease over time, the frequency of mitral surgery, thoracic aorta repair and the maze procedure increased (Table 4).
Combined sutureless and rapid deployment aortic valve replacement: operative data
| Group 1 (n = 181) | Group 2 (n = 181) | Group 3 (n = 181) | Group 4 (n = 181) | Group 5 (n = 181) | Group 6 (n = 181) | Trend P-value | |
|---|---|---|---|---|---|---|---|
| Full sternotomy | 93.9 | 93.4 | 90.1 | 91.7 | 94.5 | 92.3 | 0.83 |
| MICS | 6.1 | 6.6 | 9.9 | 8.3 | 5.5 | 7.7 | 0.83 |
| Ministernotomy | 6.1 | 2.8 | 7.7 | 7.2 | 3.9 | 7.2 | 0.57 |
| ART | 3.9 | 2.2 | 1.1 | 1.7 | 0.6 | 0.52 | |
| Valve type | <0.001 | ||||||
| Perceval | 86.7 | 75.1 | 69.9 | 66.9 | 67.4 | 31.5 | |
| Intuity/Intuity Elite | 13.3 | 24.9 | 30.4 | 33.1 | 32.6 | 68.5 | |
| Reintervention | 4.4 | 13.3 | 9.9 | 7.2 | 12.7 | 8.3 | 0.41 |
| Concomitant procedures | |||||||
| CABG | 84 | 82.7 | 70.1 | 66.3 | 74.4 | 68.5 | <0.001 |
| Septal myectomy | 7.3 | 8.5 | 12.6 | 9.9 | 7.5 | 6.7 | 0.49 |
| Mitral surgery | 0.6 | 14 | 14.3 | 22.3 | 22 | 23 | <0.001 |
| Tricuspid surgery | 3.7 | 5 | 9.5 | 11.6 | 5.1 | 7.3 | 0.29 |
| Maze procedure | 6.1 | 6.9 | 4.6 | 5.9 | 10.9 | 15.2 | 0.002 |
| Thoracic aorta surgery | 1.8 | 3.3 | 9.5 | 8.6 | 7.6 | 13.3 | <0.001 |
| Other | 6.7 | 5.1 | 7.7 | 7.7 | 5.1 | 3 | 0.22 |
| CPB time (min) | 73 (58–99) | 95 (75–131) | 100 (82–129) | 114 (87–143) | 119 (90–152) | 95 (72–125) | <0.001 |
| Clamp time (min) | 46 (35–62) | 65 (48–90) | 67.5 (57–93) | 77 (61–99) | 84 (61–105) | 64 (50–89) | <0.001 |
| Successful implantation | 95.7 | 98.2 | 97.7 | 98.5 | 97.5 | 98.4 | 0.18 |
Values are % or median (interquartile range).
ART: anterior right thoracotomy; CABG: coronary artery bypass grafting; CPB: cardiopulmonary bypass; MICS: minimally invasive cardiac surgery.
In-hospital outcomes
Isolated sutureless and rapid deployment aortic valve replacement
Trends in hospital outcomes are presented in Table 5. Overall, the in-hospital mortality rate was 1.6% with no change over time. The rate of perioperative stroke (2.3%) declined markedly from 4% to 0.5% (P = 0.018), as did the rate of postoperative atrial fibrillation (from 29.5% to 21.4%; P < 0.001). The overall incidence of conduction disorders requiring a definitive pacemaker (PM) implant and postoperative aortic regurgitation (AR) (≥mild) was 8.8% and 10.2%, respectively. Interestingly, both rates significantly decreased in recent years: PM implantation from 12.8% to 5.9% (P = 0.012) and AR from 17.8% to 2.7% (P < 0.001) (Fig. 2).
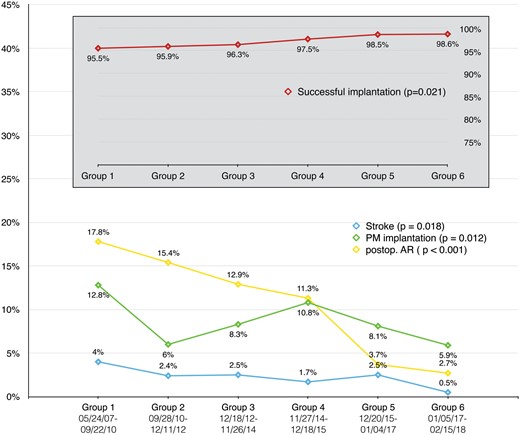
Isolated sutureless and rapid deployment aortic valve replacement: in-hospital outcomes over time. AR: aortic regurgitation; PM: pacemaker.
Isolated sutureless and rapid deployment aortic valve replacement: in-hospital outcomes
| Group 1 (n = 412) | Group 2 (n = 412) | Group 3 (n = 412) | Group 4 (n = 412) | Group 5 (n = 412) | Group 6 (n = 412) | Trend P-value | |
|---|---|---|---|---|---|---|---|
| Hospital mortality | 0.5 | 1.5 | 2.3 | 1.8 | 2.2 | 1.7 | 0.13 |
| Stroke | 4 | 2.4 | 2.5 | 1.7 | 2.5 | 0.5 | 0.018 |
| Low cardiac output | 0.6 | 1.3 | 1.8 | 1.1 | 1.7 | 0.064 | |
| Bleeding (requiring chest reopening) | 3 | 5.4 | 2.9 | 3.3 | 6.1 | 3.2 | 0.96 |
| AKI (grade > 1) | 2.3 | 2.8 | 2.5 | 4.3 | 4.9 | 3.5 | 0.14 |
| Temporary dialysis | 2.4 | 2.4 | 1.4 | 0.8 | 3.1 | 2.2 | 0.85 |
| Atrial fibrillation | 29.5 | 37 | 28.3 | 21 | 27.6 | 21.4 | <0.001 |
| PM | 12.8 | 6 | 8.3 | 10.8 | 8.1 | 5.9 | 0.012 |
| Intubation time >72 h | 2.2 | 2.4 | 3.4 | 2.9 | 4.6 | 3.9 | 0.083 |
| ICU stay (days) | 1 (1–3) | 1 (1–2) | 1 (1–3) | 1 (1–3) | 2 (1–3) | 1 (1–3) | 0.079 |
| Hospital stay (days) | 9 (7–13) | 9 (7–12) | 9 (7–14) | 9 (7–13) | 9 (7–13) | 10 (7–14) | 0.79 |
| Postoperative AR grade | <0.001 | ||||||
| Mild | 14.1 | 13.5 | 11.5 | 9.4 | 3.7 | 1.6 | |
| Moderate | 3.1 | 1.8 | 1 | 0.8 | 1.1 | ||
| Severe | 0.6 | 0.4 | |||||
| Mean AV gradient | 14.3 ± 6.1 | 12.3 ± 5.5 | 13.4 ± 6 | 13.4 ± 5.9 | 13.5 ± 5.1 | 13.6 ± 5.5 | 0.021 |
| Peak AV gradient | 27 ± 10.2 | 25.3 ± 10.2 | 25.6 ± 10.3 | 24.6 ± 10.8 | 25.3 ± 8.6 | 24.9 ± 9.9 | 0.14 |
Values are % or median (interquartile range) or mean ± standard deviation.
AKI: acute kidney injury; AR: aortic regurgitation; AV: aortic valve; ICU: intensive care unit; PM: pacemaker.
Combined sutureless and rapid deployment aortic valve replacement
Overall, in-hospital mortality and stroke rates were 3.9% and 3.2%, respectively, and they did not change over time. An increase was observed in the incidence of postoperative acute kidney injury (15.9%) and respiratory failure (5.3%). Both PM implant (overall rate 9.1%) and AR rates (overall rate 12.5%) experienced favourable trends (PM 9.9–6.6%, AR 14.4–8.8%). In-hospital results for combined SURD-AVRs are listed in Table 6.
Combined sutureless and rapid deployment aortic valve replacement: in-hospital outcomes
| Group 1 (n = 181) | Group 2 (n = 181) | Group 3 (n = 181) | Group 4 (n = 181) | Group 5 (n = 181) | Group 6 (n = 181) | Trend P-value | |
|---|---|---|---|---|---|---|---|
| Hospital mortality | 2.2 | 4.4 | 1.7 | 6.3 | 5 | 4 | 0.2 |
| Stroke | 4.7 | 3.7 | 2.2 | 2.4 | 4 | 2.4 | 0.48 |
| Low cardiac output | 2.6 | 4 | 3.6 | 1 | 2.9 | 5.7 | 0.47 |
| Bleeding (requiring chest reopening) | 4.3 | 5 | 3 | 8.5 | 5.3 | 7.2 | 0.35 |
| AKI (grade > 1) | 1.2 | 2.9 | 8.5 | 9.8 | 9 | 9.4 | 0.001 |
| Temporary dialysis | 1.2 | 2.9 | 3 | 3.8 | 3.8 | 6.3 | 0.006 |
| Atrial fibrillation | 25.3 | 33.5 | 29 | 24.7 | 32.5 | 24.4 | <0.001 |
| PM | 9.9 | 13.8 | 13.3 | 10.7 | 11.7 | 6.6 | 0.19 |
| Intubation time >72 h | 1.7 | 5.5 | 4.4 | 5 | 4.4 | 11 | 0.002 |
| ICU stay (days) | 1 (1–2) | 1 (1–3) | 1 (1–3) | 1 (1–3) | 2 (1–3) | 2 (2–4) | 0.26 |
| Hospital stay (days) | 8 (6–12) | 9 (7–14) | 9 (7–13) | 10 (7–15) | 11 (8–15) | 11 (9–16) | 0.19 |
| Postoperative AR grade | 0.74 | ||||||
| Mild | 14.4 | 8.9 | 8.4 | 12.1 | 16.1 | 5.1 | |
| Moderate | 0.9 | 0.8 | 0.8 | 0.8 | 3.7 | ||
| Severe | 0.9 | 0.8 | |||||
| Mean AV gradient | 12.8 ± 5.1 | 12.5 ± 4.9 | 13.3 ± 5.5 | 13.5 ± 6.1 | 12.9 ± 5.7 | 11.9 ± 6.7 | 0.28 |
| Peak AV gradient | 25.1 ± 10 | 24.9 ± 9.8 | 26.2 ± 10.4 | 23.8 ± 11.8 | 24.1 ± 11.2 | 21.8 ± 11.6 | 0.063 |
Values are % or median (interquartile range) or mean ± standard deviation.
AKI: acute kidney injury; AR: aortic regurgitation; AV: aortic valve; ICU: intensive care unit; PM: pacemaker.
DISCUSSION
The SURD-IR provides a real-world picture of the 11-year experience at 18 international centres that performed SURD-AVR interventions. We report contemporary data on trends in demographics and operative and hospital outcomes of SURD-AVR. The main findings are (i) a change in patient characteristics with a significant decrease in estimated surgical risk over time; (ii) increasing adoption of less invasive techniques in patients undergoing isolated SURD-AVR; (iii) a low, stable in-hospital mortality rate; and (iv) a substantial decrease in postoperative strokes, PM implantation and AR rates.
In SURD-IR the patient risk profile at baseline has improved over time, as evidenced by a steep decrease in the median logistic EuroSCORE. This finding was consistent with the current national trends in conventional AVR described in both the German and the French registries [4, 5]. Several reasons may explain these trends. First, we saw a dramatic growth in transcatheter aortic valve implantation (TAVI) case volumes that had the highest penetration in elderly and higher risk patients [1, 4, 5]. Second, the worldwide trend favoured the biological valves, including SURD valves, in younger, low risk patients [6]. Indeed, the overall mean age of the SURD-IR cohort decreased from 78.4 to 73.4 years over the study period (P < 0.001). Accordingly, the rate of younger patients undergoing SURD-AVR markedly increased in the last time period, from 1.5% to 12.6% (P < 0.001).
Over time, SURD-AVR was increasingly performed in patients with BAV. However, using SURD valves in patients with BAV remains controversial, and available data for this anatomical setting are limited thus far. Nguyen et al. [7] reported no major paravalvular leakage and no postoperative valve migration in 25 patients with BAV who underwent SURD-AVR with the Perceval valve. Nevertheless, Chiariello et al. [8] described a case of late prosthesis dislocation 2 years after a successful valve implant. Thus, robust clinical trials are still needed to adequately address the performance of SURD-AVR in patients with BAV.
By facilitating and shortening the valve implant process, SURD valves have contributed to simplify and promote minimally invasive AVR [9]. Our findings strongly support this observation and show a clear shift towards less invasive approaches. In the first time period, approximately half of the isolated SURD-AVR were performed using less invasive approaches (49.4%); this proportion had markedly increased to 85.5% (P < 0.001) in the later years (Fig. 1). Significant trends in the types of combined SURD-AVR interventions were noted over the years, with a growing occurrence of additional mitral and tricuspid procedures as well as thoracic aorta and maze surgery but fewer CABG interventions. The increasing complexity of the combined procedures explains the longer cardiopulmonary bypass and cross-clamp times (Table 4) that may have caused the increasing rates of postoperative acute kidney injury and respiratory failure experienced by this subgroup of patients. Furthermore, it may explain why the hospital mortality and stroke rates did not significantly decrease despite the reduction in patient risk profiles.
In SURD-IR, the Perceval S was the most frequently used valve: it was implanted in 2617 (73.3%) patients compared to 954 (26.7%) patients who received the Intuity valve. However, this finding was clearly biased by the late market entry of the Intuity valve. Indeed, the volume of the implanted Intuity valves has increased significantly in recent years, both in isolated and combined procedures.
Remarkable advances in the isolated treatment of SURD-AVR can be observed in our analysis (Fig. 2). However, it must be mentioned that the in-hospital mortality rate has remained stable and low, despite the reduction in the risk profiles of the patients over the years. This outcome is likely due to the small number of events observed in each group; a larger cohort (with a greater number of events) would be required to observe any significant trend. Conversely, the occurrence of stroke decreased considerably over time. This finding has probably been affected by the reduced patient risk profile noted in recent years. However, recent data from the SURD-IR indicated that SURD-AVR is associated with satisfactory outcomes in patients of all risk categories [10]. In the present analysis, the substantial decline in the rates of PMs implanted and the postoperative AR in patients who underwent isolated SURD-AVR must be emphasized. In fact, SURD-AVR has been associated with an elevated rate of PM implantation compared to conventional AVR [11]. In a propensity matched analysis from the GARY registry, Ensminger et al. [11] reported an incidence of PM implantation of 9.1% and 4.1% for SURD-AVR and conventional AVR, respectively. These data were consistent with the overall rate reported in our registry (8.8%). However, given recent developments, SURD technologies have been shown to be strongly influenced by the ‘learning curve effect’, with improving outcomes resulting from the optimization of the surgical technique over time, with careful avoidance of oversizing and level of implant [2, 12]. Our analysis strongly confirms this assumption, with a dramatic reduction in the PM implantation rate from 12.8% to 5.9% (P = 0.012) (Supplementary Material, Fig. S1). The latter compares satisfactorily with the rate reported after conventional AVR and is much lower than those rates reported after TAVI [4, 13, 14]. During the observation period, both the incidence and the severity of postoperative AR significantly decreased with an improving rate of successful valve implantation (Supplementary Material, Fig. S2). These findings are also likely the results of the growing experience of surgeons and of refined surgical techniques. Nevertheless, it must be noted that the AR rate was still higher than those reported with conventional AVR, especially in patients who underwent combined SURD-AVR.
Limitations
This study has the limitations of any observational registry involving no adjudication of patient inclusion and data collection and a lack of comparative arms. It is a non-randomized, retrospective analysis, with no core laboratory to review images, and the investigators are responsible for data reporting from their own institutions. The present study focused on in-hospital outcomes, and no robust long-term data were available to effectively assess mid- and long-term results.
A majority of the participating institutions may be somewhat biased because some of the surgeons participated in first-in-man and in CE market studies. However, the SURD-IR is the largest and the only independent SURD-AVR registry and includes all SURD valves. Thus, it reflects a real-world picture and provides a valuable opportunity to assess this new technology.
CONCLUSIONS
The results of our study provide a comprehensive view of the current trends and outcomes of SURD-AVR interventions. The most notable changes over time include an increasing number of SURD valves implanted in a younger, lower-risk population and the more frequent utilization of less invasive approaches in patients undergoing isolated SURD-AVR. Over time, although the in-hospital mortality rate remained stable, the rates of stroke, PM implantation and postoperative AR decreased significantly. Although our findings are promising, long-term evidence is warranted to thoroughly evaluate the performance of these new valve technologies.
Supplementary material is available at EJCTS online.
Conflict of interest: Thierry P. Carrel received research grants from ATS Medical and from Sorin Medical during the years 2004 and 2010. Alberto Albertini is consultant for LivaNova. Martin Andreas is proctor for Edwards and an advisory board member for Medtronic. All other authors declared no conflict of interest.
Author contributions
Paolo Berretta: Conceptualization; Data curation; Formal analysis; Investigation; Methodology; Project administration; Software; Validation; Writing—original draft; Writing—review & editing. Sebastian Arzt: Data curation; Validation; Visualization. Antonio Fiore: Data curation; Validation; Visualization. Thierry P. Carrel: Data curation; Validation; Visualization; Writing—review & editing. Martin Misfeld: Data curation; Validation; Visualization. Kevin Teoh: Data curation; Validation; Visualization; Writing—review & editing. Emmanuel Villa: Data curation; Validation; Visualization; Writing—review & editing. Alberto Albertini: Data curation; Validation; Visualization. Theodor Fischlein: Data curation; Validation; Visualization; Writing—review & editing. Gianluca Martinelli: Data curation; Validation; Visualization. Malak Shrestha: Data curation; Validation; Visualization. Carlo Savini: Data curation; Validation; Visualization. Antonio Miceli: Data curation; Validation; Visualization; Writing—review & editing. Giuseppe Santarpino: Data curation; Validation; Visualization. Martin Andreas: Data curation; Validation; Visualization; Writing—review & editing. Carmelo Mignosa: Data curation; Validation; Visualization. Kevin Phan: Data curation; Visualization. Bart Meuris: Data curation; Validation; Visualization. Marco Solinas: Data curation; Validation; Visualization. Tristan Yan: Conceptualization; Data curation; Validation; Visualization. Marco Di Eusanio: Conceptualization; Methodology; Project administration; Supervision; Validation; Visualization; Writing—review & editing.
REFERENCES
ABBREVIATIONS
- AR
Aortic regurgitation
- BAV
Bicuspid aortic valve
- CABG
Coronary artery bypass grafting
- PM
Pacemaker
- SURD-AVR
Sutureless and rapid deployment aortic valve replacement
- SURD-IR
Sutureless and Rapid Deployment International Registry
- TAVI
Transcatheter aortic valve implantation
