


Abstract

The purpose of this study was to analyse the prognostic significance of the dominant features of ground-glass opacities (GGOs) in part-solid node-negative adenocarcinomas with invasive components of similar sizes.
From 2004 to 2017, a total of 544 patients with a diagnosis of part-solid pathological node-negative adenocarcinoma with an invasive component <20 mm in size were selected. The enrolled patients were categorized into 2 groups: a GGO-dominant [50% < GGO (%) < 100%, n = 245] group (group 1) and a solid-dominant [0% < GGO (%) ≤ 50%, n = 299] group (group 2). To analyse the prognostic significance of GGO-dominant features, propensity score matching incorporating variables such as age, sex, preoperative pulmonary function, operation methods and size of the solid component was performed.
Propensity score matching produced 92 patients in each group for the prognostic analysis. The mean size of the solid part was 8.8 mm in the GGO-dominant group and 9.0 mm in the solid-dominant group (P = 0.34); the mean size of the total lesion was 22.2 mm in the GGO-dominant group and 14.9 mm in the solid-dominant group (P < 0.001). The 5-year overall survival rates were 96.7% in group 1 and 96.2% in group 2 (P = 0.52), and the 5-year disease-free survival rates were 96.7% in group 1 and 94.3% in group 2 (P = 0.48).
Although the total sizes of the GGO-dominant lesions were larger than those of the solid-dominant lesions, the prognosis of patients with GGO-dominant lesions was not significantly different from that of patients with solid-dominant lesions in node-negative adenocarcinomas with a similar invasive component size <20 mm.
INTRODUCTION
Recent advances in high-resolution computed tomography have enabled the diagnosis of small-sized lung cancer [1, 2]. In addition to small solid lesions, small ground-glass opacity (GGO) nodules have also been increasingly identified due to computed tomography (CT) screening programmes. Previous studies have claimed that pure GGO nodules are likely related to pathologically preinvasive lesions, and these patients are known to have a good prognosis when the tumour has an indolent course. However, a part-solid nodule is a mixture of a solid portion and a GGO portion. Several studies have reported that the solid portion has been found to be related to pathological invasive lesions and that the GGO portion may be associated with pathological preinvasive lesions. Therefore, a controversy exists concerning which criteria related to the respective sizes of the solid and the GGO portions should be applied to the diagnosis and treatment of a part-solid nodule [3–6].
Radiological and pathological studies have been performed to identify part-solid adenocarcinomas according to the total size of the tumour and the size of the solid component of the tumour [6–8]. These studies show that the consolidation-to-tumour ratio of part-solid nodules is related to the prognosis [9]. In other words, when the GGO proportion is small, the prognosis is poor. One of the recent ongoing randomized trials has shown that adenocarcinomas with tumours <2 cm in size with a consolidation-to-tumour ratio <0.25 have a low degree of invasiveness [10]; thus, further studies are in progress to determine the operative range based on the consolidation-to-tumour ratio [8, 11, 12].
However, the relationship between the proportion of GGO area and the prognosis remains controversial. Travis et al. [13] reported that the absolute size of the solid component is important for predicting prognosis, regardless of the size of the outer GGO portion. In the recent 8th edition of the American Joint Commission on Cancer tumour, node and metastasis (TNM) staging system, clinical stage is measured by the absolute size of the solid portion, not by the total diameter of the lesion including the GGO component in part-solid nodules. This approach is used because the radiological GGO component corresponds to the pathologically preinvasive portion; thus, this GGO component may not have an impact on prognosis.
We investigated whether the GGO portion affects the prognosis of part-solid adenocarcinomas with invasive components of similar sizes.
MATERIALS AND METHODS
This study was approved by the institutional review of board of the Seoul National University Bundang Hospital (IRB number: B-1909-567-106); the requirement for patient consent was waived because of the retrospective nature of the study. The medical records of 544 consecutive patients with an invasive component <20 mm in size who underwent surgical resection for part-solid nodules with pathologically proven node-negative lung adenocarcinoma between January 2004 and December 2017 were reviewed. The 544 enrolled patients were categorized into 2 groups. Group 1 comprised patients with GGO-dominant nodules with a GGO % >50 and <100, and group 2 included patients with solid-dominant nodules with a GGO % >0 and <50. To analyse the prognostic significance of different GGO-dominant features in part-solid nodules with similar invasive components, various clinical variables such as age, sex, preoperative pulmonary function, operative methods and solid component size were matched and compared (Fig. 1). The invasive component was defined as follows: (i) histological subtypes other than a lepidic pattern (i.e. acinar, papillary, micropapillary and/or solid) or (ii) tumour cells infiltrating myofibroblastic stroma. The total size of the tumour was defined as the maximum dimension of the tumour, including the invasive component and the lepidic growth component [13]. The tumours were pathologically staged according to the 8th edition of the TNM classification [14]. The surgical principle for early-stage lung cancer during the study period was anatomical pulmonary resection with mediastinal lymph node dissection. However, limited resections such as wedge resection were performed selectively in patients with a peripheral part-solid nodule ≤2 cm in total diameter with >50% GGO proportion.
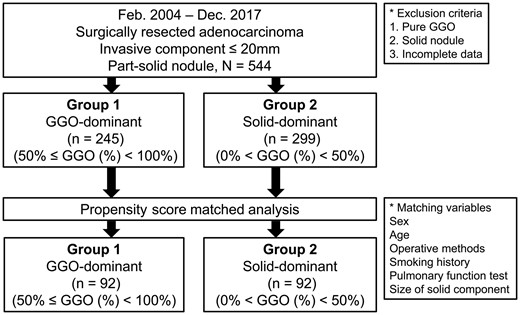
Diagram of the study population. GGO: ground-glass opacity.
Follow-up and recurrence
Postoperative surveillance was performed every 3 months during the first 2 years, biannually from the second to the fifth year and annually thereafter. Recurrence was defined by the presence of radiological findings or histological confirmation on follow-up examinations. The date of recurrence was defined as the date of the examination on which the recurrence was documented. Overall survival (OS) was defined as the interval in months between the date of surgical resection and the date of death from any cause. Disease-free survival (DFS) was defined as the time from the operation to a recurrence or death from any cause or event of interest.
Statistical analyses
Statistical analyses were performed with the SPSS package (version 19.0; IBM, Armonk, NY, USA). Descriptive statistics were used to compare variables between the unmatched groups, using the χ2 test or the Fisher’s exact test for categorical variables and the Student’s t-test for continuous variables. Normally distributed continuous data were expressed as the mean ± standard deviation. Categorical data were expressed as counts and proportions. To control for potential differences in the perioperative characteristics of groups with different GGO features, propensity score matching that incorporated preoperative variables, such as age, sex, preoperative pulmonary function, operation methods and size of the solid component, was performed. A balanced cohort was then created using a 1-to-1 nearest neighbour matching algorithm. The logit of the propensity score was used for matching, with a caliper width of 0.2 times its standard deviation. Covariate balance was measured using the standardized differences between the 2 groups, and a standardized mean difference (SMD) >0.10 was considered to indicate imbalance in the covariate. Once a matched sample was performed, comparisons between the matched groups were performed with McNemar’s test for categorical variables and paired t-tests or Wilcoxon rank sum tests for continuous variables. OS and DFS were estimated with the Kaplan–Meier method, and the prognostic factors were compared with the means of log-rank statistics for significant differences. P-values <0.05 were considered statistically significant. The Cox proportional hazards model was used to explore the influence of independent prognostic factors in a multivariable model. Potential prognostic factors with P-values <0.20 in the univariate analysis, together with clinically important variables, were included in the final multivariable analysis. The enter method was used to determine the final Cox model for multivariable analysis. A 2-sided P-value <0.05 was considered statistically significant.
RESULTS
The enrolled study patients were divided into 2 groups: a GGO-dominant group with a GGO % >50 and <100 (n = 245) and a solid-dominant group with a GGO % >0 and <50 (n = 299). The characteristics of these 544 patients are summarized in Table 1. No significant differences were found between the 2 groups in terms of age, preoperative forced expiratory volume in the first second and pathological total tumour size (all SMD < 0.10). However, there were significant differences in variables such as sex, never smoker, preoperative carbon monoxide diffusing capacity, operative methods, size of the clinical solid component, size of the pathological invasive component and the clinical size of the overall tumour (all SMD > 0.10).
Characteristics of the GGO-dominant and solid-dominant patients before matching
| Variables | GGO-dominant (n = 245) | Solid-dominant (n = 299) | P-value | SMD |
|---|---|---|---|---|
| Female gender | 140 (57) | 195 (65) | 0.054 | 0.166 |
| Age (years) | 62.8 ± 9.6 | 63.7 ± 10.7 | 0.34 | 0.084 |
| Never smoker | 148 (60) | 205 (69) | 0.047 | 0.171 |
| Preoperative FEV1 (%) | 106.3 ± 17.8 | 107.2 ± 18.7 | 0.57 | 0.049 |
| Preoperative DLCO (%) | 107.6 ± 19.5 | 104.1 ± 18.8 | 0.034 | 0.183 |
| Operative methods | 0.020 | 0.144 | ||
| Lobectomy | 157 (64) | 220 (74) | ||
| Segmentectomy | 50 (20) | 36 (12) | ||
| Wedge resection | 38 (16) | 43 (14) | ||
| GGO ratio (%) | 68.3 ± 11.1 | 32.1 ± 12.4 | <0.001 | 3.074 |
| Solid part (mm), clinical | 6.0 ± 3.2 | 12.3 ± 4.0 | <0.001 | 1.674 |
| Total tumour (mm), clinical | 19.5 ± 7.1 | 18.2 ± 5.9 | 0.030 | 0.189 |
| Invasive component (mm), pathological | 10.9 ± 6.6 | 13.5 ± 5.9 | <0.001 | 0.425 |
| Total tumour size (mm), pathological | 17.6 ± 6.5 | 17.6 ± 5.9 | 0.96 | 0.004 |
| Minimally invasive adenocarcinoma | 118 (48) | 13 (4) | <0.001 | 1.146 |
| Visceral pleural invasion, pathological | 5 (2) | 22 (7) | 0.004 | 0.253 |
| Lymphovascular invasion, pathological | 24 (10) | 40 (13) | 0.20 | 0.112 |
Data presented as the number of patients or mean ± standard deviation. Figures in parentheses indicate percentage.
DLCO: carbon monoxide diffusing capacity; FEV1: forced expiratory volume in the first second; GGO: ground-glass opacity; SMD: standardized mean difference.
Propensity score matching produced 92 patients in each group, and the paired groups were well balanced. After propensity matching, all covariates using propensity score matching were non-significantly different (all SMD < 0.10; Table 2). The sizes of the solid components were similar between the 2 groups with 8.8 ± 3.0 mm in the GGO-dominant group and 9.0 ± 3.4 mm in the solid-dominant group. Additionally, the size of the invasive component was 10.9 ± 6.3 mm in the GGO-dominant group and 10.8 ± 5.7 mm in the solid-dominant group. In contrast, although the sizes of the solid and invasive components were similar between the GGO-dominant and the solid-dominant groups, the clinical (22.2 ± 6.8 mm in the GGO-dominant vs 14.9 ± 5.5 mm in the solid-dominant) and pathological total tumour sizes (19.3 ± 6.1 mm in the GGO-dominant vs 14.5 ± 5.6 mm in the solid-dominant) differed in the matched groups. We analysed the survival of the 2 matched groups with similar invasive components but different GGO features and found no significant differences in OS and DFS between the 2 groups. The 5-year OS rate was 96.7% for the GGO-dominant group and 96.2% in the solid-dominant group (P = 0.52); the 5-year DFS was 96.7% in the GGO-dominant group and 94.3% in the solid-dominant group (P = 0.48) (Fig. 2).
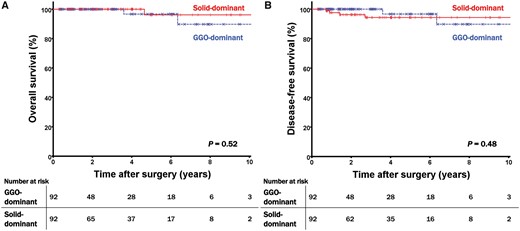
(A) Overall survival curves and (B) disease-free survival curves of the matched patients according to the different GGO features. GGO: ground-glass opacity.
Characteristics of the GGO-dominant and solid-dominant patients after matching
| Variables | GGO-dominant (n = 92) | Solid-dominant (n = 92) | P-value | SMD |
|---|---|---|---|---|
| Female gender | 57 (62) | 60 (65) | 0.055 | 0.067 |
| Age (years) | 63.7 ± 9.7 | 63.4 ± 9.9 | 0.81 | 0.030 |
| Never smoker | 61 (66) | 60 (65) | 0.34 | 0.023 |
| Preoperative FEV1 (%) | 107.1 ± 19.0 | 107.2 ± 18.9 | 0.96 | 0.007 |
| Preoperative DLCO (%) | 107.2 ± 20.1 | 105.9 ± 18.2 | 0.65 | 0.066 |
| Operative methods | 0.55 | 0.072 | ||
| Lobectomy | 59 (64) | 61 (66) | ||
| Segmentectomy | 22 (24.0) | 13 (14) | ||
| Wedge resection | 11 (12) | 18 (20) | ||
| GGO ratio (%) | 60.6 ± 6.4 | 38.5 ± 10.2 | <0.001 | 2.583 |
| Solid part (mm), clinical | 8.8 ± 3.0 | 9.0 ± 3.4 | 0.34 | 0.089 |
| Total tumour (mm), clinical | 22.2 ± 6.8 | 14.8 ± 5.5 | <0.001 | 1.189 |
| Invasive component (mm), pathological | 10.9 ± 6.3 | 10.8 ± 5.7 | 0.95 | 0.009 |
| Total tumour size (mm), pathological | 19.3 ± 6.1 | 14.5 ± 5.6 | <0.001 | 0.815 |
| Minimally invasive adenocarcinoma | 14 (15) | 13 (14) | 0.84 | 0.031 |
| Visceral pleural invasion, pathological | 4 (4) | 5 (5) | 0.74 | 0.054 |
| Lymphovascular invasion, pathological | 10 (11) | 12 (13) | 0.66 | 0.067 |
Data presented as the number of patients or mean ± standard deviation. Figures in parentheses indicate percentage.
DLCO: carbon monoxide diffusing capacity; FEV1: forced expiratory volume in the first second; GGO: ground-glass opacity; SMD: standardized mean difference.
Additional multivariable analyses were performed to determine which clinical factors had an independent impact on survival of 544 patients with node-negative adenocarcinomas with invasive components <20 mm in size (Table 3). The multivariable analysis using the Cox hazards model revealed that age [hazard ratio (HR) 1.057, 95% confidence interval (CI) 1.001–1.117; P = 0.046] and the size of the clinical solid component (HR 1.154, 95% CI 1.008–1.321; P = 0.038) were independent prognostic factors for DFS, whereas the proportion of GGO (HR 1.018, 95% CI 0.985–1.052; P = 0.30) was not an independent prognostic factor for DFS.
Prognostic factors for disease-free survival in 544 patients with node-negative adenocarcinomas with invasive component size <20 mm
| Variables | Multivariable analysis (Cox hazards model) | |
|---|---|---|
| HR (95% CI) | P-value | |
| Female gender | 0.570 (0.085–3.876) | 0.57 |
| Age (years) | 1.057 (1.001–1.117) | 0.046 |
| Never smoker | 0.743 (0.119–4.637) | 0.80 |
| Preoperative FEV1 (%) | 0.977 (0.953–1.001) | 0.059 |
| Preoperative DLCO (%) | 0.991 (0.967–1.016) | 0.48 |
| Operative methods (lobectomy) | 0.11 | |
| Segmentectomy | 2.256 (0.648–7.860) | 0.20 |
| Wedge resection | 3.105 (0.956–9.606) | 0.06 |
| Solid part (mm), clinical | 1.154 (1.008–1.321) | 0.038 |
| GGO ratio (%) | 1.018 (0.985–1.052) | 0.30 |
CI: confidence interval; DLCO: carbon monoxide diffusing capacity; FEV1: forced expiratory volume in the first second; GGO: ground-glass opacity; HR: hazard ratio.
DISCUSSION
No significant difference in prognosis could be found between GGO-dominant lesions and the solid-dominant lesions of node-negative adenocarcinomas with similar invasive components <20 mm in size. Recent advances in imaging modalities have enabled the diagnosis of early-stage lung cancer and continue to increase the incidence and diagnostic rates of radiological screening programmes. In particular, the diagnosis of ground-glass nodules and the treatment policy for these nodules have been suggested in many guidelines [15–17]. In the case of the solid nodule, there is no controversy about the surgical method when surgical resection is possible based on the results of previous studies. However, in the case of GGOs, many controversies still exist about whether surgical treatment should be performed and what kind of operation should be performed because the tumours contain not only solid portions but also GGO portions.
Several researchers have reported that the prognosis or treatment policy of part-solid GGO lesions can be determined by the consolidation-to-tumour ratio. The Japan Clinical Oncology Group (JCOG) 0201 study revealed that patients with nodules <2 cm and a consolidation-to-tumour ratio <0.25 have a very good prognosis [10]. In ongoing randomized controlled trials, studies based on such a consolidation-to-tumour ratio are actively progressing. In other words, these studies argue that the size and proportion of the GGO component as well as the size of the solid portion are closely related to the prognosis.
Many studies have found that the size of the solid portions is important. Lee et al. reported a significant correlation between the size of the solid component on thin-section CT scans and the size of the invasive component on pathological analysis based on 59 part-solid nodules in 58 patients. Kim et al. [18] insisted that the presence of a solid component was the only factor that could predict nodule growth. In addition, the 8th edition of clinical T staging recommends that the T stage should be determined based on the size of the solid portion regardless of the size of the GGO component [13].
No reports have compared the prognosis of patients with part-solid adenocarcinomas while maintaining consistently sized invasive components. According to the research results so far, the GGO portion is important, but the size of the solid portion varies between groups, so clearly identifying the radiological and pathological relationship is difficult [5]. Therefore, in this study, the size of the solid part was consistently matched, and the 2 groups with different GGO components were compared to investigate the impact of the GGO component on prognosis, especially OS and DFS. Although the total size of the GGO-dominant lesions was larger than that of the solid-dominant lesions, the GGO proportion was not associated with prognosis in node-negative adenocarcinomas with similarly invasive component sizes <20 mm. Therefore, the absolute total tumour size and consolidation-to-tumour ratio of the GGO component did not significantly affect the prognosis when lesions had solid components of similar sizes.
As a result, the GGO portion is a pathological preinvasive lesion and may not be related to the prognosis [12]. In fact, most of the patients with pure GGOs, such as adenocarcinoma in situ or minimally invasive adenocarcinoma, had a very good prognosis with a survival rate >95% [19]. Thus, the absolute size of the solid portion is the most important factor in the part-solid nodule, and the GGO component may be relatively unrelated to prognosis.
Limitations
This retrospective study has several limitations. First, we used a retrospective data set from a single institutional study; therefore, selection bias was unavoidable. However, propensity score matching gives the present study the power to represent an unbiased sample. Second, the number of matched patients in the study was insufficient for subgroup analysis stratified by pathological T staging. Lastly, the relatively small number of events for survival precluded a more robust statistical analysis. In our study, prognosis was good particularly in both matched groups; thus, comparisons of survival beyond this point should be interpreted with caution. Further randomized studies including large numbers of patients followed over a longer period would be needed to confirm and validate our findings.
CONCLUSION
Although the total size of the GGO-dominant lesions was larger than that of the solid-dominant lesions, the prognosis of patients with GGO-dominant lesions was not significantly different from that of patients with solid-dominant lesions in node-negative adenocarcinomas with similar invasive components <20 mm.
Conflict of interest: none declared.
Author contributions
Sung Joon Han: Data curation; Formal analysis; Writing—original draft. Jae Hyun Jeon: Conceptualization; Investigation; Methodology; Supervision; Visualization; Writing—review & editing. Woohyun Jung: Formal analysis; Investigation; Supervision. Yong Won Seong: Formal analysis; Investigation; Supervision. Sukki Cho: Formal analysis; Investigation; Supervision. Kwhanmien Kim: Formal analysis; Investigation; Supervision. Sanghoon Jheon: Formal analysis; Investigation; Supervision.
Presented at the 27th European Conference on General Thoracic Surgery, Dublin, Ireland, 9–12 June 2019.
REFERENCES
ABBREVIATIONS
- CI
Confidence interval
- CT
Computed tomography
- DFS
Disease-free survival
- GGO
Ground-glass opacity
- HR
Hazard ratio
- OS
Overall survival
- SMD
Standardized mean difference
