


Abstract
Emphysema is one of the main causes of respiratory complications in patients operated on for lung cancer. We have used three-dimensional computed tomography (3D CT) for surgical simulations, as well as for depicting emphysematous areas as low attenuation areas (LAAs) and visual scores based on the Goddard classification (Goddard score), which is a visual scale of the area of vascular disruption and LAA for each lung field. This study aimed to investigate the effectiveness of the 3D CT function for assessing emphysema severity and its association with respiratory complications.
The study included 504 lung cancer patients who had preoperative 3D CT from October 2010 to March 2015. Goddard score and LAA% (LAA/total lung volume) were measured using 3D CT data. The relationship between respiratory complications and independent variables was investigated.
Postoperative respiratory complications were observed in 69 (13.6%) patients. The receiver operating characteristic curves for respiratory complications determined using the Goddard score and LAA% dichotomized at each cut-off level (1 and 0.7%, respectively) showed that the events were observed in 32% of the patients with a Goddard score ≥1 and in 25% of the patients with an LAA% ≥0.7. On multivariable analyses, the Goddard score was significantly correlated with postoperative respiratory complications (P < 0.001).
Preoperative measurement of the Goddard score and LAA% using 3D CT in patients with lung cancer, particularly with the coexistence of emphysema, was beneficial for predicting postoperative respiratory complications.
INTRODUCTION
More than half of all lung cancer patients have chronic obstructive pulmonary disease (COPD), which is an umbrella term that includes emphysema, owing to their smoking history [1]. The severities of COPD and emphysema are the main causes of postoperative respiratory complications, subsequently causing perioperative mortality in patients undergoing major pulmonary surgery [2–5]. Recent reports have also shown that emphysematous changes as assessed by computed tomography (CT) scan predict respiratory mortality in patients with various COPD stages [6]. Preoperative evaluation of pulmonary function and emphysema status in lung cancer patients should therefore be performed accurately.
Multidetector computed tomography (MDCT) is important and allows surgeons to not only diagnose pulmonary diseases accurately but also conduct surgical simulations by constructing three-dimensional (3D) images of lung structures [7–10]. We have used 3D lung modelling based on CT images using the Fujifilm Synapse Vincent system® (Fujifilm Corporation, Tokyo, Japan) to obtain 3D images of the pulmonary vessels and tracheobronchial tree for surgical simulations in daily practice [10, 11]. Our recent report demonstrated that pulmonary vessels and the bronchial structure were precisely identified by 3D CT and that patients undergoing preoperative 3D CT have a lower incidence of postoperative complications and a shorter operative time than those not undergoing preoperative 3D CT. This suggests that detailed surgical simulation and shared virtual lung anatomical information provided by 3D images lead to a safe video-assisted thoracic surgery (VATS) performance without causing vascular injuries resulting from unusual pulmonary artery branching patterns [12]. In patients with COPD or emphysematous lung changes, 3D CT can easily be scalable for evaluating emphysema severity as a low attenuation area (LAA) and visual scores based on Goddard classification (Goddard score). The Goddard score is used as a visual scale of the area of vascular disruption and LAA for each lung field [13].
This study aimed to investigate the effectiveness of 3D CT for assessing emphysema severity and its association with and predictive value of postoperative respiratory complications in primary lung cancer patients.
MATERIALS AND METHODS
Patients
A total of 504 patients with lung cancer who had preoperative 3D lung images and subsequent pulmonary resection from October 2010 to March 2015 were included in this study. We reviewed their postoperative pulmonary complications, age, gender, smoking history, body mass index, operative procedure (partial resection, segmentectomy, lobectomy or more extensive resection), approach for operation (thoracotomy or VATS), forced expiratory volume in 1 s (FEV1.0) measured by spirometry and forced expiratory volume in 1 s as percent forced vital capacity (FEV1.0%) without using a bronchodilator before spirometry and investigated the relationship between the development of postoperative respiratory complications and independent variables.
In this study, postoperative respiratory complications were defined on the basis of the Clavien–Dindo classification system [14]. The postoperative respiratory complications included the following: prolonged air leakage (persistent air leakage beyond 7 days postoperatively or those requiring intervention beyond tube thoracostomy), pneumonia, bronchial fistula, atelectasis, acute exacerbation of interstitial lung disease, empyema, recurrent nerve paralysis, chylothorax, pleural effusion and other respiratory-related adverse events. All postoperative respiratory complications above Grade 1 described by the Clavien–Dindo classification system were detected from available clinical records.
Three-dimensional computed tomography construction and emphysema severity measurement
All preoperative CT examinations were performed using a 64-channel MDCT (Light speed VCT, GE Medical System, Milwaukee, WI, USA). CT images (1.25 mm in thickness) were reconstructed at intervals of 1.0 mm. The CT images of each patient were transferred to a workstation with the Synapse Vincent, and a surgeon constructed 3D models that were completed within approximately 3 min for surgical simulations as well as accurate analysis of emphysema severity. The lung field area with attenuation values <−950 Hounsfield Unit (HU) of thresholds was considered as LAA. The proportion of LAA for total lung volume (LAA%) was calculated automatically. After calculation of the proportion of LAA for each slice, the Goddard score was measured (Fig. 1). The results of the scoring were interpreted by 2 board-certified thoracic surgeons (Y.M. and Y.S.) and an experienced pulmonary radiologist (J.P.). Goddard score: Score 0, normal; Score 1, ≤25% affected; Score 2, >25% and ≤50% affected; Score 3, >50% and ≤75% affected and Score 4, >75% affected. Six images were analysed in 3 slices, which were obtained from the aortic arch level, carina level and 1 cm above the right diaphragm, and a total score of 6 images was calculated for each person. There was a possible maximum score of 24 for each patient.
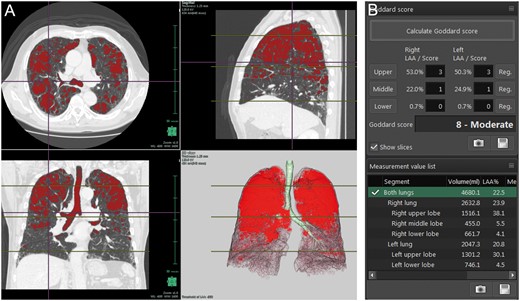
A representative case of three-dimensional (3D) image analysis of emphysematous areas using Synapse Vincent. (A) 3D images of emphysematous areas. (B) Measurement of Goddard score and low attenuation area/total lung volume ×100.
Statistical analysis
The associations between independent variables and the frequency of postoperative respiratory complications were analysed. Categorical comparison was performed using the Pearson’s χ2 test for discrete data and Student’s t-test for continuous data. Spearman’s rank correlation coefficient was used to determine the correlation between the Goddard score and LAA%. Multivariable logistic regression analysis with a stepwise variable selection was performed to identify factors that were independently correlated with postoperative respiratory complications. To identify the association between the Goddard score or LAA% and the incidence of postoperative respiratory complications, patients were subdivided into 2 cohorts via receiver operating characteristic curve analyses. All tests were 2-sided, and probability values <0.05 were considered to indicate a statistically significant difference between the 2 groups. All statistical calculations were performed using the SPSS statistical software package (version 22, SPSS Inc., Chicago, IL, USA).
RESULTS
The characteristics of the patients are summarized in Table 1. The cohort in this study consisted of 281 men and 223 women (mean age 67 ± 10 years; range 23–87). Of these, 315 (62.5%) patients had a smoking history and 175 (34.7%) patients had obstructive respiratory abnormality (FEV1.0% <70%). The operative procedures included partial resection (n = 11), segmentectomy (n = 46), lobectomy (n = 436) and bilobectomy (n = 11). There were 174 (34.5%) patients who underwent thoracotomy and 330 (65.5%) patients in whom VATS was performed.
Patient characteristics (n = 504)
| Variables | No. of patients |
|---|---|
| Age (years) | 66.9 ± 10.0 |
| Gender, male/female | 281/223 |
| Smoking history, yes/no | 315/189 |
| Body mass index (kg/m2) | 22.6 ± 3.2 |
| Operative procedure, limited resection/ more extensive resection | 57/447 |
| Approach (thoracotomy/VATS) | 174/330 |
| FEV1.0 (l) | 2.34 ± 0.64 |
| FEV1.0%, < 70%/70% ≤ | 175/329 |
| ppoFEV1.0 (l) | 1.87 ± 0.56 |
| Goddard score | 0.71 ± 1.87 |
| LAA% (%) | 1.47 ± 3.92 |
| Pathological stage, Stage IA/IB/IIA/ IIB/IIIA/IIIB/IV | 274/88/53/23/56/4/6 |
| Histology, adeno/squamous/ neuroendocrine/large/others | 388/69/21/7/19 |
| Postoperative respiratory complications, yes/no | 69/435 |
Data are expressed as number of patients or mean ± SD.
adeno: adenocarcinoma; FEV1.0: forced expiratory volume in 1 s; LAA%: low attenuation area/total lung volume; large: large cell carcinoma; neuroendocrine: neuroendocrine tumors; ppoFEV1.0: predicted postoperative FEV1.0; squamous: squamous cell carcinoma; SD: standard deviation; VATS: video-assisted thoracic surgery.
Postoperative respiratory complications were observed in 69 (13.6%) patients; these data are presented in Table 2. These included prolonged air leakage (n = 22), pneumonia (n = 13), bronchial fistula (n = 4), atelectasis (n = 5), acute exacerbation of interstitial lung disease (n = 3), empyema (n = 5), recurrent nerve paralysis (n = 2), chylothorax (n = 5), pleural effusion (n = 3) and other respiratory-related adverse events (n = 7). The frequency of patients presenting a postoperative respiratory complication with Grade 2 or above was 11.1% (n = 56), and 1 patient died due to acute exacerbation of interstitial lung disease within 30 days after surgery.
Postoperative respiratory complications
| Type of respiratory complications | No. of patients | No. of patients (≥Grade 2) |
|---|---|---|
| Overall (%; out of all patients) | 69 (13.6) | 56 (11.1) |
| Prolonged air leakagea | 22 | 15 |
| Pneumonia | 13 | 13 |
| Bronchial fistula | 4 | 3 |
| Atelectasis | 5 | 5 |
| Acute exacerbation of ILD | 3 | 3 |
| Empyema | 5 | 5 |
| Recurrent nerve paralysis | 2 | 0 |
| Chylothorax | 5 | 2 |
| Pleural effusion | 3 | 3 |
| Other respiratory-related adverse events | 7 | 7 |
Air leakage was defined as persistent air leakage beyond 7 days postoperatively or those requiring intervention beyond tube thoracostomy.
ILD: interstitial lung disease.
Figure 2 shows the association between the Goddard scores measured using a 3D imaging system and postoperative respiratory complications. This shows how many percentage of postoperative complication can happen depending on the Goddard score. The Goddard scores were divided into 4 groups. Respiratory complications were observed in 8.3% of the patients who had a score of 0, in 25.0% of those who had scores of 1–3 and in 37.0% of those who had scores of 4–6. In the patient group that had the score of 7 or above, respiratory complications were observed in 69.2% of them.

Association between the Goddard scores and postoperative respiratory complications.
Figures 3 and 4 show the receiver operating characteristic curves identifying the optimal cut-off values for the Goddard score and LAA% in predicting respiratory complications, and these showed areas under the curve of 0.690 and 0.693, respectively. The suitable cut-off values of the Goddard score and LAA% were estimated to be 1 and 0.7%, which is 0.65 rounded off to 1 decimal place, respectively. Postoperative respiratory complications were observed in 32% of the patients who had a Goddard score ≥1 and in 25% of those who showed an LAA% ≥0.7.

Receiver operating characteristic curve of the Goddard score for postoperative respiratory complications. AUC: area under the curve; CI: confidence interval.

Receiver operating characteristic curve of low attenuation area/total lung volume ratio for postoperative respiratory complications. AUC: area under the curve; CI: confidence interval.
We evaluated the relationship between various clinical factors and postoperative respiratory complications (Table 3). Gender (P < 0.001), smoking history (P < 0.001), approach for operation (thoracotomy or VATS, P = 0.029), predicted postoperative forced expiratory volume in 1 s (ppoFEV1.0; P = 0.046), Goddard score (P < 0.001) and LAA% (P < 0.001) were found to be associated with an increase in postoperative respiratory complications. Age tended to have an association, but the difference was not statistically significant (P = 0.054).
Outcomes by respiratory complications group
| Variables | Respiratory complications (−) | Respiratory complications (+) | P-valuea |
|---|---|---|---|
| (n = 435) | (n = 69) | ||
| Age (years) | 66.6 ± 9.9 | 69.0 ± 10.1 | 0.054 |
| Gender, male/female | 226/209 | 55/14 | <0.001 |
| Smoking history, yes/no | 259/176 | 56/13 | <0.001 |
| Body mass index (kg/m2) | 22.7 ± 3.1 | 22.2 ± 3.4 | 0.176 |
| Operative procedure, limited resection/more extensive resection | 50/385 | 7/62 | 0.742 |
| Approach, thoracotomy/VATS | 142/293 | 32/37 | 0.029 |
| FEV1.0%, <70%/70% ≤ | 139/295 | 36/33 | 0.001 |
| ppoFEV1.0 (l) | 1.89 ± 0.57 | 1.75 ± 0.48 | 0.046 |
| Goddard score, 0/1 ≤ | 363/72 | 33/36 | <0.001 |
| LAA%, <0.7/0.7≤ | 322/113 | 30/39 | <0.001 |
Data are expressed as number of patients or mean ± SD.
P-values were determined using the χ2 test for categorical variables and the t-test for continuous variables.
FEV1.0: forced expiratory volume in 1 s; LAA%: low attenuation area/total lung volume; ppoFEV1.0: predicted postoperative FEV1.0; SD: standard deviation; VATS: video-assisted thoracic surgery.
Goddard score and LAA% were strongly and naturally correlated with one another (ρ = 0.713, P < 0.001; Supplementary Material, Fig. S1). We therefore used only the Goddard score in multivariable logistic regression analyses with a stepwise variable selection (Table 4). The Goddard score (odds ratio 3.666, 95% confidence interval = 2.038–6.592; P < 0.001) dichotomized at cut-off value, as well as gender and ppoFEV1.0, was shown to be a significant independent predictor.
Multivariable analysis using Goddard score for the occurrence of respiratory complications
| Variables | Multivariable analysis with Goddard score | ||
|---|---|---|---|
| Odds ratio | 95% CI | P-value | |
| Gender, male/female | 3.783 | 1.834–7.804 | <0.001 |
| ppoFEV1.0 (l) | 2.873 | 1.616–5.128 | <0.001 |
| Goddard score, 0/1 ≤ | 3.666 | 2.038–6.592 | <0.001 |
| Variables | Multivariable analysis with Goddard score | ||
|---|---|---|---|
| Odds ratio | 95% CI | P-value | |
| Gender, male/female | 3.783 | 1.834–7.804 | <0.001 |
| ppoFEV1.0 (l) | 2.873 | 1.616–5.128 | <0.001 |
| Goddard score, 0/1 ≤ | 3.666 | 2.038–6.592 | <0.001 |
CI: confidence interval; ppoFEV1.0: predicted postoperative forced expiratory volume in 1 s.
DISCUSSION
We set out to clarify the effectiveness of 3D CT for the measurement of emphysematous changes in predicting postoperative respiratory complications in primary lung cancer patients. Analyses were carried out in 504 patients who had preoperative 3D CT and subsequent pulmonary resection for primary lung cancer. Goddard score and LAA% measured using 3D CT strongly affected the incidence of postoperative pulmonary complications. The receiver operating characteristic curves for respiratory complications determined using the Goddard score and LAA% dichotomized at each cut-off level showed higher rates of pulmonary complications in patients with a Goddard score ≥1 and an LAA% ≥0.7. Importantly, the 3D CT system enables a surgeon without expert knowledge of synthetic imaging to easily construct 3D images in a few minutes for not only surgical simulation but also identifying patients who are at risk for postoperative respiratory complications.
Recently, several reports have addressed the benefits of preoperative and intraoperative uses of 3D evaluation in the field of thoracic surgery [7–12, 15]. Three-dimensional CT for surgical simulation facilitates the performance of more complicated procedures such as segmentectomy for a non-palpable small tumour located deeply in the lung parenchyma or multiple segmentectomy for synchronous or metachronous multiple tumours [8–10, 15]. In the context of the merit of surgical simulation of 3D imaging, however, majority of studies have focused on a better understanding of the surgical anatomy, safe and efficient performance of surgery and educational purposes. As part of simulation and navigation in lung cancer surgery, there are only a few studies in which patients with emphysema are associated with postoperative complications [16].
Appropriate prediction of patients at a high risk of postoperative complications is vital to optimize therapeutic strategy for lung cancer patients. Pulmonary function tests such as the predicted values of the preoperative and postoperative FEV1.0% and diffusing capacity of the lungs for carbon monoxide have been well known as predictors of postoperative morbidity and mortality [3, 17–19] and reported to be significantly correlated with the volume-metric CT quantification of emphysema and normal lung area as shown in the current study [20, 21]. However, some studies have reported that postoperative pulmonary complications cannot be accurately predicted with the results of pulmonary function tests [22, 23] and lobectomy can be performed with acceptable morbidity in patients with marginal pulmonary function [24, 25]. In patients with the coexistence of emphysema and idiopathic pulmonary fibrosis, the so-called combined pulmonary fibrosis and emphysema, their lung function tests are likely to differ from those of patients with emphysema, which mainly occurs in the upper pulmonary area, or those of patients with pulmonary fibrosis, which commonly develops from the lower area [26]. This indicates that the postoperative respiratory functional contribution can vary according to the volume of each resected lobe. Thus, it is essential to know not only pulmonary function test results but also the 3D image of the distribution and extent of the emphysematous change in the overall picture as LAA as a part of surgical simulation.
To date, visual scoring methods and attenuation threshold-based quantitative analysis using high-resolution CT have been reported to measure emphysema accurately. Goddard classification based on the LAA proportion for each slice was introduced in 1982 [13]. This visual evaluation method is widely accepted but is highly dependent on the judgement of observers. Hersh et al. [27] reported that interobserver agreement in the determination of upper lobe-predominant severe emphysema, which was found to be a better indication of lung volume reduction surgery, was poor compared with emphysema in any other portions. Although emphysema on CT findings is heterogeneous and has a wider range of severity, it should be noted that mild emphysema tends to be missed by both visual scoring methods and quantitative analysis of emphysema. Although much effort has been made to identify the locations of the damaged alveolar architecture and to estimate the extent and severity of emphysema, focusing on the prevention of pulmonary complications is of greatest importance in the case of surgical candidates. Given that the present 3D imaging system provides accurate measured values of LAA and 3D distribution of emphysema even for patients with the mild or moderate type in an easier manner, it is considered to be highly beneficial for the preoperative assessment of lung volume reduction surgery for patients with severe emphysema. Although there are no reports as to the cost-effectiveness of 3D workstation by which any physician can make use of the volume metric CT quantification of emphysema area, the routine use of this system for measuring LAA% and Goddard score should be utilized for the selection of the appropriate therapeutic strategy for lung cancer patients with an underlying emphysema, which can be tailored to the risk stratification for postoperative pulmonary complication and might eventually contribute to acceptable cost-effectiveness.
Limitations
This study has several limitations. First, as a retrospective single-institutional study, patient selection bias in constructing the preoperative 3D imaging might affect the results of postoperative respiratory complications. Randomized controlled or prospective study designs would be needed to solidify our findings. However, since the beginning of 2013 at which all the thoracic surgeons in our department could become proficient in using this system, we have performed 3D lung simulation for nearly all consecutive patients who were scheduled to have lobectomy or segmentectomy unless they have any contraindication such as contrast medium allergy or their refusal. LAA% and Goddard score were promising predictors for the incidence of postoperative respiratory complications. The result is, therefore, thought to be invariable even if the study sample size increased. Second, we did not investigate postoperative FEV1.0 and vital capacity, and preoperative diffusing capacity of the lungs for carbon monoxide in all cases. These parameters should be included in future investigations to validate and strengthen the significance of the measurement of LAA% and Goddard score.
CONCLUSION
In conclusion, this study demonstrated that preoperative measurement of LAA% and the Goddard score using 3D CT imaging in patients with lung cancer, particularly with the coexistence of emphysema, appeared to be beneficial for predicting postoperative pulmonary complications. The field of surgical simulations using cutting-edge technology has advanced rapidly to improve the safety and accuracy of operations. Further development is necessary to establish a post-surgical risk stratification model.
ACKNOWLEDGEMENTS
The authors are indebted to the medical editors of the Department of International Medical Communications of Tokyo Medical University for their editorial review of the English manuscript. They are also indebted to the Division of Clinical Research Consultation at the Institute of Medical Science of Tokyo Medical University for their confirmation of our statistical analysis.
Funding
This work was supported by Tokyo Medical University Research Grant 2016.
Conflict of interest: none declared.
