


Abstract
Aortic arch repair remains a major surgical challenge. Multiple manufacturers are developing branched endografts for Zone 0 endovascular repair, extending the armamentarium for minimally invasive treatment of aortic arch pathologies. We hypothesize that the design of the Zone 0 endograft has a significant impact on the postoperative haemodynamic performance, particularly in the cervical arteries. The goal of our study was to compare the postoperative haemodynamic performance of different Zone 0 endograft designs.
Patient-specific, clinically validated, computational fluid dynamics simulations were performed in a 71-year-old woman with a 6.5-cm saccular aortic arch aneurysm. Additionally, 4 endovascular repair scenarios using different endograft designs were created. Haemodynamic performance was evaluated by calculation of postoperative changes in blood flow and platelet activation potential (PLAP) in the cervical arteries.
Preoperative cervical blood flow and mean PLAP were 1080 ml/min and 151.75, respectively. Cervical blood flow decreased and PLAP increased following endovascular repair in all scenarios. Endografts with 2 antegrade inner branches performed better compared to single-branch endografts. Scenario 3 performed the worst with a decrease in the total cervical blood flow of 4.8%, a decrease in the left hemisphere flow of 6.7% and an increase in the mean PLAP of 74.3%.
Endograft design has a significant impact on haemodynamic performance following Zone 0 endovascular repair, potentially affecting cerebral blood flow during follow-up. Our results demonstrate the use of computational modelling for virtual testing of therapeutic interventions and underline the need to monitor the long-term outcomes in this cohort of patients.
INTRODUCTION
Open surgical repair of aortic arch pathologies remains a major challenge in aortic surgery that requires sternotomy or thoracotomy and cardiopulmonary bypass [1]. Many patients are not considered fit for this invasive procedure due to pre-existing comorbidities [2].
To address this issue, multiple device manufacturers are developing Zone 0 endografts for total endovascular repair of the aortic arch, eliminating the need for open surgical repair [3]. This approach involves deployment of an endograft in the ascending aorta with either 1 or 2 branches that redirect flow to the brachiocephalic trunk (BCT) alone or to the BCT and left common carotid artery (LCCA), in combination with 1 or 2 extra-anatomical bypasses [4]. Different Zone 0 endograft designs have been introduced, with varying number, size and orientation of the branches that redirect flow to the supra-aortic arteries [3].
Early results of Zone 0 endovascular aortic arch repair are promising and encourage the use of these devices, especially in patients with aortic pathologies that would be considered unrepairable otherwise [4, 5]. Stroke remains a significant complication following endovascular repair of the aortic arch [4, 6, 7], with reported incidences up to 11% [4]. Guidewire manipulation and covering of the supra-aortic arteries are procedural factors known to increase stroke risk [5, 7]. Yet, little is known about the impact of the branched endograft design on the risk for cerebrovascular complications. We hypothesize that the design of the Zone 0 endograft has a significant impact on the postoperative haemodynamic performance, particularly in the cervical arteries.
The goal of the present study was to assess and compare the postoperative haemodynamic performance of different Zone 0 endograft designs. Advanced computational fluid dynamics (CFD) tools have been used to support clinical decision-making through calculation of the haemodynamic outcomes of different therapeutic interventions using a ‘virtual testing’ paradigm [8–10]. The virtual testing paradigm, which has been used in various engineering fields to replace the ‘build-and-test’ paradigm, uses computational simulations to optimize a proposed design before any physical model is built. We applied these methods in a patient with a saccular aortic arch aneurysm to calculate the cervical blood flow (CBF) and blood shear rates in 4 virtual postoperative scenarios featuring different Zone 0 endograft designs.
METHODS
Approval for this study was obtained from the institutional review board (University of Michigan protocol number HUM00112350), and the need for patient consent was waived.
Patient history
A 71-year-old woman presented with a 6.5-cm isolated saccular aortic arch aneurysm. Her medical history included hypertension, obstructive sleep apnoea, dilated non-ischaemic cardiomyopathy and paroxysmal atrial fibrillation for which a dual-chamber implantable cardioverter defibrillator had been implanted.
Clinical data
Computed tomography angiography was performed using a 64-slice scanner after intravenous injection of 150 ml of iopamidol 76% contrast agent. Ultrasonography examinations of the heart and the cervical arteries were acquired, including measurements of surface area and flow velocity with duplex Doppler ultrasonography, enabling calculation of flow volumes in the cervical arteries. A cardiac catheterization procedure was performed using 80 ml of iopamidol 76% contrast agent, providing information on aortic pressure and cardiac output via the Fick principle [11].
Patient-specific computational modelling
Computational modelling techniques were used to calculate patient-specific haemodynamics based on the physical laws of fluid flows. CFD is a well-established technique that enables calculation of the motion of an incompressible fluid by solving the Navier–Stokes equations. CFD methods have been used profusely in applications such as aerospace and automotive engineering. Over the past decades, CFD methods have also been applied to study haemodynamics in cardiovascular health and disease [12]. Here, a computational model of haemodynamics requires the definition of: (i) a 3D geometric model of the vessels of interest and (ii) a set of inflow and outflow boundary conditions that represent the flow and pressure conditions of the subject.
For this study, we first produced a validated baseline (preoperative) solution, matching patient-specific clinical measurements on cardiac output, aortic pressure and CBF [10]. Then, the geometry of the preoperative model was modified to construct 4 postoperative scenarios featuring different Zone 0 endograft designs, representing the currently available branched endograft options for total endovascular repair of the aortic arch [3]. All scenarios were run with the same inflow and outflow boundary conditions. Using this 2-step approach, we can quantify haemodynamic alterations induced by the different endograft designs based on the physical laws of fluid dynamics.
The preoperative patient-specific geometric model was built from the computed tomography angiography image data using the validated custom software package CRIMSON [13]. The preoperative model and the 4 endovascular repair scenarios are presented in Fig. 1. A summary of the specifications of the endograft designs is listed in Table 1. All Zone 0 endovascular repair models included an extra-anatomical bypass from the LCCA to the left subclavian artery (8-mm diameter).
Specifications of endograft designs
| Scenario | Number of branches | Branch orientation | Dimensions of inner branch to BCT (mm) | Dimensions of inner branch to LCCA (mm) |
|---|---|---|---|---|
| 1 | 2 | Antegrade | 12 × 44 | 12 × 40 |
| 2 | 2 | Antegrade | 12 × 21 | 8 × 21 |
| 3 | 1 | Retrograde | 12 × 25 | NA |
| 4 | 1 | Cranial | NA | NA |
Dimensions of the inner branches are given in diameter × length.
BCT: brachiocephalic trunk; LCCA: left common carotid artery.
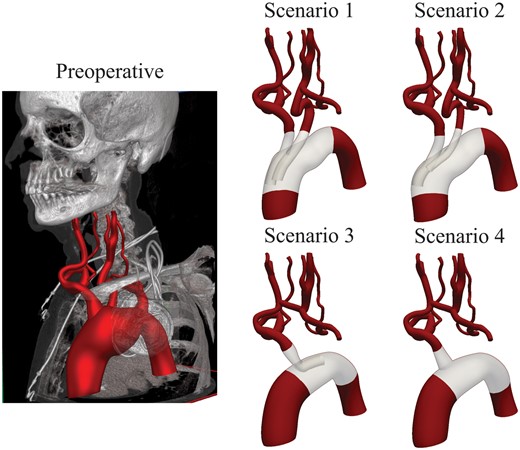
Geometric models of the preoperative situation and 4 endovascular repair scenarios.
Scenario 1 used an endograft with 2 antegrade inner branches of equal diameter positioned side by side, carrying blood flow to the BCT and LCCA. Scenario 2 also featured an endograft with 2 antegrade inner branches; however, the inner branch to the LCCA had a smaller diameter and was positioned oblique behind the inner branch to the BCT. Scenario 3 used an endograft with a single retrograde inner branch carrying flow to the BCT, combined with an extra-anatomical bypass from the right common carotid artery to the LCCA (8-mm diameter). Finally, Scenario 4 used an endograft with a single volcano-shaped branch redirecting flow to the BCT, combined with an extra-anatomical bypass from the right common carotid artery to the LCCA (8-mm diameter).
To solve the blood flow equations, a computational mesh is required. The mesh breaks down the anatomical model into many small elements. The resolution of the mesh must be such that it captures the complex velocity patterns near and around the branches of the device and the vessel walls. Therefore, automatic mesh refinement procedures [14] were used to capture such haemodynamics. Figure 2 presents a cut-through view of the mesh with the total number of elements noted for each model. The models with inner branches (Scenarios 1, 2 and 3) required significantly more elements to produce similar accuracy as the preoperative and Scenario 4 models.
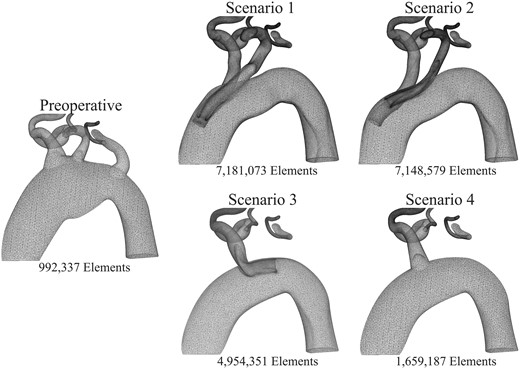
Computational mesh refinement near the supra-aortic arteries in the preoperative anatomy (left) and in the 4 endovascular repair scenarios (right). Mesh refinement is needed to capture complex haemodynamics around the inner branches. Therefore, the postoperative cases have computational meshes with more elements, leading to higher computational costs.
Blood was modelled as a Newtonian fluid with a density of 1060 kg/m3 and a dynamic viscosity of 0.004 Pa·s. The vessel walls were modelled as rigid. A volumetric flow waveform was imposed at the inflow face of the ascending aorta using echocardiography data, adjusted to match the cardiac output measured during cardiac catheterization via the Fick principle [11]. As outflow boundary conditions, 3-element Windkessel models were specified representing the behaviour of the distal vascular bed at each outlet [15]. A 3-element Windkessel model consists of 3 parameters: a proximal resistor, capacitor and distal resistor. The numerical values of these parameters were tuned to match the clinical measurements from duplex Doppler ultrasonography and cardiac catheterization. The choice for this type of boundary condition was motivated by the fact that in virtual surgical planning, no direct measurements of postoperative flow and pressure are typically available. Furthermore, due to the lack of patient-specific flow measurements at the left and right subclavian arteries, we assigned previously reported flow rates measuring 6% of the cardiac output to each subclavian artery [16]. The numerical values of the Windkessel parameters are reported in Supplementary Material, Table S1.
Computations were performed using the CRIMSON incompressible Navier–Stokes flow solver on 80 cores at the University of Michigan high-performance computing cluster ConFlux. Typical computational time was 24 h per cardiac cycle, varying depending on the number of elements in the mesh.
Particle tracking and platelet activation potential
In addition to quantifying flow and pressure waveforms in the cervical arteries for the different scenarios, we were interested in assessing the risk of thrombus formation relative to the preoperative configuration. It is well known that high blood shear rates lead to platelet activation and can trigger thrombus formation [17, 18]. Therefore, we used a CFD tool called ‘particle tracking’, which enables tracing the path of thousands of blood particles as they move through the aorta and endograft. We can then calculate a metric known as ‘platelet activation potential’ (PLAP) [19, 20], which has been recently linked to thrombus formation in thoracic and abdominal aortic flows [8, 20]. The PLAP metric is a dimensionless scalar quantifying accumulated blood shear rate. Using PLAP, the impact of endograft-induced shear distortion can be compared between the different virtual endovascular repair scenarios. In this work, 110 000 particles were injected at the ascending aorta and collected in virtual spheres at the outflows of the supra-aortic arteries (Fig. 3).
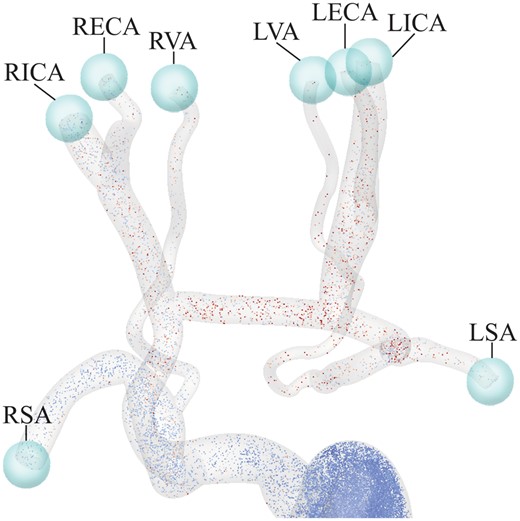
Representation of the virtual spheres used to capture particles leaving the domain through each vessel, enabling calculation of average platelet activation potential values for each of the supra-aortic arteries. LECA: left external carotid artery; LICA: left internal carotid artery; LSA: left subclavian artery; LVA: left vertebral artery; RECA: right external carotid artery; RICA: right internal carotid artery; RSA: right subclavian artery; RVA: right vertebral artery.
RESULTS
Flow and pressure waveforms in the preoperative model
The preoperative simulation successfully reproduced the clinical data of the patient. Figure 4 presents the computed preoperative flow and pressure waveforms and a comparison between clinical data and computation results at selected locations. All computed flow and pressure values lay within 5% of the clinical data.
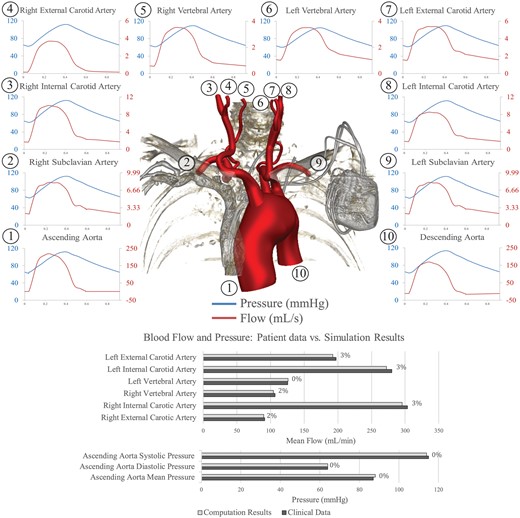
Top: pressure (blue lines) and flow (red lines) waveforms at the inlet (ascending aorta) and all outlets of the preoperative model. The location of each measurement is denoted by a number. Bottom: comparison between measured and computed blood flows and pressures in the preoperative model, with percentage differences between the 2 shown.
Impact of endograft design on cervical blood flow
Table 2 presents the computed mean flow for the preoperative and 4 endovascular repair scenarios. Blood flow to the right hemisphere (RHS) was calculated as the sum of the flows through the right internal carotid artery, right external carotid artery and right vertebral artery. Similarly, blood flow to the left hemisphere (LHS) was calculated as the sum of the flows through left internal carotid artery, left external carotid artery and left vertebral artery. Total CBF was calculated as the sum of LHS and RHS flows.
Simulated mean flow values
| Preoperative (mL/min) | Scenario 1 (mL/min) | Scenario 2 (mL/min) | Scenario 3 (mL/min) | Scenario 4 (mL/min) | |
|---|---|---|---|---|---|
| Ascending aorta | 4665 | 4665 | 4665 | 4665 | 4665 |
| Right subclavian artery | 283 | 280 | 280 | 282 | 286 |
| Right external carotid artery | 90 | 90 | 90 | 87 | 88 |
| Right internal carotid artery | 296 | 294 | 295 | 287 | 290 |
| Right vertebral artery | 104 | 103 | 104 | 104 | 105 |
| Left vertebral artery | 126 | 120 | 119 | 117 | 118 |
| Left internal carotid artery | 272 | 269 | 266 | 255 | 258 |
| Left external carotid artery | 192 | 188 | 186 | 179 | 181 |
| Left subclavian artery | 284 | 273 | 270 | 264 | 267 |
| Descending aorta | 3019 | 3053 | 3059 | 3093 | 3072 |
| Mean flow to RHS | 490 | 488 (−0.4%) | 488 (−0.3%) | 477 (−2.5%) | 483 (−1.3%) |
| Mean flow to LHS | 591 | 577 (−2.3%) | 570 (−3.4%) | 551 (−6.7%) | 558 (−5.6%) |
| Total mean CBF | 1080 | 1065 (−1.4%) | 1059 (−2.0%) | 1029 (−4.8%) | 1041 (−3.6%) |
CBF: cervical blood flow; LHS: left hemisphere; RHS: right hemisphere.
Total CBF was reduced in all endovascular repair scenarios, and double branch scenarios performed better compared to single branch alternatives (CBF changes of −1.4% and −2.0% for Scenarios 1 and 2 vs −4.8% and −3.6% in Scenarios 3 and 4, respectively). Blood flow to the LHS decreased more compared to RHS flow in all repair scenarios. Again, scenarios with a double-branch endograft performed better compared to the single branch alternatives (LHS flow changes of −2.3% and −3.4% in Scenarios 1 and 2 vs −6.7% and −5.6% in Scenarios 3 and 4, respectively).
Impact of endograft design on blood shear rate
PLAP metrics were computed following injection and tracking of particles during 10 cardiac cycles. Average PLAP was calculated at the outflows of the cervical arteries. Significant differences in PLAP were revealed between the different endovascular repair scenarios. Table 3 summarizes the calculated mean PLAP values for all scenarios. Figure 5 presents a qualitative comparison of PLAP maps, showing colour-coded advected particles 2.4 s after virtual injection.
Calculated mean PLAP values at the outflow branches
| Preoperative | Scenario 1 | Scenario 2 | Scenario 3 | Scenario 4 | |
|---|---|---|---|---|---|
| Right subclavian artery | 106.42 | 109.67 | 120.08 | 164.08 | 125.43 |
| Right external carotid artery | 129.66 | 132.22 | 129.05 | 200.53 | 181.34 |
| Right internal carotid artery | 119.53 | 105.49 | 110.57 | 188.82 | 162.98 |
| Right vertebral artery | 173.87 | 182.98 | 192.51 | 238.05 | 201.29 |
| Left vertebral artery | 218.15 | 340.34 | 388.18 | 427.16 | 361.87 |
| Left internal carotid artery | 127.89 | 135.04 | 170.37 | 261.69 | 214.74 |
| Left external carotid artery | 141.37 | 147.89 | 183.29 | 270.89 | 230.30 |
| Left subclavian artery | 108.31 | 153.45 | 202.50 | 263.17 | 219.48 |
| Descending aorta | 78.80 | 60.13 | 70.06 | 67.86 | 61.15 |
| Mean PLAP cervical arteries | 151.75 | 173.99 (+14.7%) | 195.66 (+28.9%) | 264.52 (+74.3%) | 225.42 (+48.6%) |
PLAP: platelet activation potential.
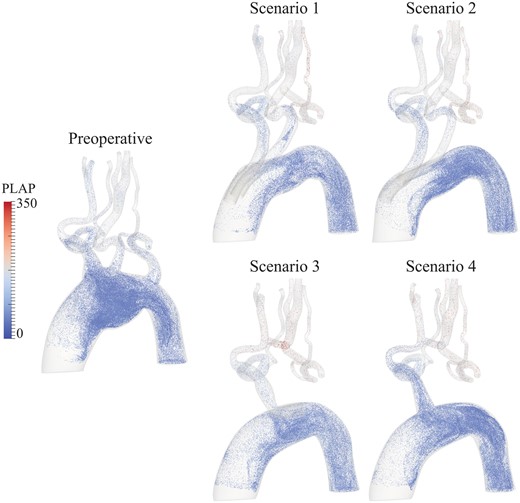
The image visualizes the position and PLAP values, representing the amount of accumulated blood shear rate, of particles 2.4 s after virtual injection at the ascending aorta for all scenarios. All postoperative scenarios show elevated values of shear rate in the supra-aortic arteries compared to the preoperative situation. Furthermore, Scenarios 3 and 4 present higher values of blood shear rate in the cervical arteries compared to Scenarios 1 and 2. PLAP: platelet activation potential.
Mean PLAP was increased in all endovascular repair scenarios compared to the preoperative situation. Scenario 1 performed best with a mean PLAP increase of 14.7% in the cervical arteries. Scenario 3 performed the worst with an increase in the mean PLAP of 74.3%. The endograft used in Scenario 3 had a single retrograde inner branch, which caused all blood flowing to the supra-aortic arteries to make a U-turn in the aortic arch and pass through the single outlet, increasing blood shear rates.
DISCUSSION
Multiple manufacturers are developing branched endografts for Zone 0 deployment, enabling total endovascular repair of the aortic arch. These devices extend the armamentarium for treatment of aortic arch pathologies, providing a solution for patients unfit for open surgical repair. The present study aimed to compare the postoperative haemodynamic performance of different endograft designs for Zone 0 endovascular aortic repair using advanced computational modelling analyses. This approach enables studying detailed haemodynamic indices without the need for performing invasive interventions in diseased patients. Furthermore, it facilitates virtual testing of different treatment scenarios in the same patient in a controlled setting. Haemodynamic performance was quantified for the different endograft designs by calculating changes in total CBF and average blood shear rate in the cervical arteries.
The use of double branch endografts, with 2 antegrade inner branches, resulted in smaller reductions in CBF compared to single branched alternatives (−1.4% and −2.0% vs −4.8% and −3.6%, respectively). When differential changes in blood flow to the RHS and LHS were calculated, blood flow to the LHS experienced the largest reduction in all endovascular repair scenarios (up to −6.7% in Scenario 3). This finding underlines the need for assessment of the circle of Willis before performing total endovascular aortic arch repair, as normal anatomy with a complete circle is present in only 28% of the population [21]. Most frequent anatomical variations include hypoplasia of the posterior communicators (22%) and absence or hypoplasia of either the A1 segment of the anterior cerebral artery (25%) or the posterior communicator (15%) [22, 23]. This is valuable information when planning Zone 0 endovascular repair, as patients with incomplete circles cannot compensate for a reduction in blood flow to the LHS through redistribution [21]. Reductions in cerebral blood flow could hypothetically be compensated through cerebral autoregulation; nonetheless, this would be the same for all endograft designs. In addition, the target population for these endografts is diseased patients, in whom reserve capacity for cerebral autoregulation will likely be impaired [24, 25].
The alterations in blood shear rate were calculated using the so-called PLAP index, which has been related to thrombus formation in aortic flows previously [8, 20]. Both single branch endografts resulted in larger increments in blood shear rates in the cervical arteries compared to the double branch devices (74.3% and 48.6% increase vs 14.7% and 28.9% increase, respectively). The increases in blood shear rate are inherent and mostly unavoidable consequences of the altered morphology of the aorta and supra-aortic arteries following Zone 0 repair.
Reduced perfusion, in combination with increased blood shear rates may have negative long-term consequences, particularly in the cerebral microcirculation. Evidence from epidemiological, clinical and experimental studies indicates that cerebral hypoperfusion and microcirculatory dysfunction play a critical role in the pathogenesis of many types of vascular cognitive impairment and dementia, including Alzheimer’s disease [25–27].
We hypothesized that Zone 0 endograft design has a significant impact on the postoperative haemodynamic performance, particularly in the cervical arteries. Our results confirm this hypothesis. In the present study, double branch endografts offered better postoperative haemodynamic performance compared to single branch alternatives. We believe that the closer an endograft design is to preserving preoperative aortic morphology, the smaller the postoperative haemodynamic disturbances will be.
The advantages of a double branch design highlighted above focus on postoperative haemodynamic performance and may be offset during device deployment. Single branch devices could be easier to deploy, requiring less catheter manipulation in the aortic arch, which is considered to be the main risk factor for perioperative embolic stroke [6]. On the other hand, single branch devices require an additional extra-anatomical bypass, potentially increasing perioperative risks [4].
Limitations
The patient who is presented in this study was not treated with any of the studied endografts, making it impossible to relate our computational predictions to in vivo follow-up data. Furthermore, performing the same ‘virtual testing’ analysis in patients with different anatomical features could potentially lead to different postoperative results. However, as the differences in aortic arch anatomy between patients are relatively small compared to the differences between the endograft designs and resulting postoperative morphology, we can say from our experience that the likelihood of obtaining drastically different results among patients is small.
When considering the value of ‘population-based’ analyses, it is important to realize the fundamental differences between these and ‘patient-specific’ analyses. In ‘population-based’ studies, few aspects of the system are known or controlled, and therefore, many subjects are needed to extract conclusions. In computational modelling, a ‘patient-specific’ paradigm produces highly detailed results for 1 specific patient, which can be used to identify optimal devices or interventions for that specific patient [10]. The value of this article is to offer a controlled, ‘apples-to-apples’ comparison between different device designs for the same patient, and as such, we are confident that our results are sound, given the extensive validation work done in our code.
All postoperative scenarios were run with equal boundary conditions relative to the preoperative model, meaning that the cardiac output and outflow boundary conditions (i.e. Windkessel parameters) did not change after endovascular intervention and between the different scenarios. These assumptions enable fair comparison of haemodynamics between the endovascular repair scenarios, but their validity has not been determined yet. The endograft alters the postoperative left ventricular afterload due to the much higher stiffness relative to the native aorta, potentially affecting cardiac performance [28]. Additionally, the reduced number of postoperative supra-aortic outflow tracts may also contribute to an increase in left ventricular afterload relative to the preoperative conditions. Furthermore, it has been reported previously that devices or catheters inserted in the aorta lead to increases in left ventricular afterload and ultimately to changes in cardiac performance [29]. In addition, following endovascular repair, patients are often prescribed antihypertensive medications, which affect the vascular resistance and may alter cardiac output chronically.
The computations in this work have been carried out assuming a rigid behaviour for the arterial wall. Simulating the interactions between blood flow and vessel wall motion is possible [30], but it would increase computational cost significantly without altering the observed differences in haemodynamics between the different endograft designs. Of note, all computed flow and pressure values lay within 5% of the clinical data in the preoperative simulation.
CONCLUSIONS
Double branch Zone 0 endograft designs offer superior postoperative haemodynamic performance compared to single branch alternatives for total endovascular aortic arch repair, minimizing reductions in CBF and alterations in blood shear rate that could potentially lead to cerebral ischaemic events. Reductions in CBF might be particularly problematic in patients with an incomplete circle of Willis, where reductions in blood flow to the LHS cannot be compensated through redistribution.
CFD provides a powerful tool to enhance our understanding of haemodynamics in complex aortic anatomies and optimize the design and planning of advanced endovascular procedures.
SUPPLEMENTARY MATERIAL
Supplementary material is available at EJCTS online.
Funding
This work was supported by the European Research Council under the European Union’s 7th Framework Programme (FP/2007-2013) [ERC grant agreement no. 307532]; the Edward B. Diethrich Professorship; the Bob and Ann Aikens Aortic Grants Program and the Frankel Cardiovascular Center. Funding sources also include the Joe D. Morris Professorship; David Hamilton Fund and the Phil Jenkins Breakthrough Fund. Computing resources were provided by the National Science Foundation [grant no. 1531752] Acquisition of Conflux, A Novel Platform for Data-Driven Computational Physics (Tech. Monitor: Ed Walker).
Conflict of interest: Kim A. Eagle received grants from W.L. Gore and Medtronic Inc. during the course of this study. Himanshu J. Patel serves as consultant and co-patent holder with W.L. Gore and consultant for Medtronic Inc. Santi Trimarchi serves as consultant and speaker for W.L. Gore and Medtronic Inc. Joost A. van Herwaarden serves as consultant and speaker for Bolton Medical, Cook Medical and Philips Health Care. All authors declare no conflict of interest related to the content of the manuscript.
Presented at the 7th Annual Scientific Meeting of the International Society for Neurovascular Disease, Taormina, Italy, 4 May 2017.
