


Abstract
The aim of this study was to investigate the current trends and results of lung cancer surgery in Finland at the population level.
Three compulsory national registries provided the data on surgical treatment of lung cancer during 2004 and 2014. Outcomes of interest were all-cause mortality, population level surgical rates and frequencies of resections. The data were divided into 2 eras to analyse changes in treatment strategies and baseline characteristics: 2004–2009 and 2010–2014.
A total of 3621 patients underwent lung resections for cancer during the study period. The mean age of the patients was 65.8 years. During the study period, the patients were older and Charlson comorbidity index score of the patients increased (P < 0.001 for both). Simultaneously, the rate of surgery (from 12.8% to 14.4%, P = 0.001) and the rate of video-assisted thoracoscopic surgery increased (from 7.3% to 31.9%, P < 0.001). The rate of pneumonectomy decreased from 12.7% to 7.5% (P < 0.001). Mortality was 2.3% at 30 days and 4.3% at 90 days without significant differences between eras. Overall survival was 85% at 1 year and 50.2% at 5 years. Long-term survival improved significantly during the study from 53% to 60.1% at 4 years (P < 0.001).
This nationwide population-based study demonstrates an improvement in long-term outcome after lung cancer surgery despite an increasing age and comorbidity burden concomitantly with an increasing rate of surgery. This suggests that video-assisted thoracoscopic surgery can be offered to more patients with more comorbidities while still improving lung cancer survival.
INTRODUCTION
Worldwide lung cancer remains the leading cause of cancer death [1]. Overall 5-year survival in Europe is below 20% [1]. In Finland, with 2616 new lung cancer cases in 2014, 5-year survival is 15% in women and 10% in men [2].
In the early stages of lung cancer, surgery offers the best chance for cure. The rate of surgery varies, however, significantly between countries and even within a country [3–5]. It is suggested that in the UK with an overall low rate of surgery, higher resection rates were strongly associated with a better overall survival of lung cancer patients [3].
During the last decade, there have been many changes together with published guidelines related to the surgical therapy of lung cancer: preoperative staging, incorporation of minimally invasive surgery [video-assisted thoracoscopic surgery (VATS)] and the use of neoadjuvant and adjuvant therapies [6, 7]. It is possible to operate patients with a higher surgical risk using VATS. The adoption of VATS has, however, been slow, being approximately 20% in the recent years in the European Society of Thoracic Surgeons (ESTS) database despite research indicating its advantages over open surgery in the early stages of lung cancer [8]. Our aim was to investigate the current trends in lung cancer surgery in Finland and the results of surgery on a nationwide population level.
MATERIALS AND METHODS
Study population
All Finnish residents are listed by the individual unique and immutable 10-digit national registration number in several national databases. This allows reliable identification of patients from hospital records and administrative databases. In this study, patients treated for lung cancer between 2004 and 2014 were identified from the Care Register for Health Care (CRHC), and data of each patient were linked individually to the data on cancer from the National Cancer Registry. Reporting to each of these databases is compulsory. Database queries were performed from July to December 2016.
All hospitals in Finland are legislatively obligated to report annually every inpatient treatment period and all outpatient contacts to the CRHC held by the National Institute of Health and Welfare of Finland. Each healthcare contact is provided with basic baseline data (e.g. age, gender and specialty of healthcare contact), data on length of stay, performed procedures and International Classification of Diseases 10th version (ICD-10) diagnostic codes.
Based on the above data, all surgical procedures can be identified in the CRHC database. This database provides the number of both open lung surgery and VATS performed in Finland between January 2004 and December 2014. To avoid the loss of cases due to a misdiagnosis at the time of surgery, all patients who underwent lung resection for cancer were retrieved from the CRHC. For further analyses, only patients who underwent surgery with a subsequent lung cancer diagnosis in the National Cancer Registry or on death certificate were included. Mortality data for patients extending up to 31 December 2014 were obtained from Statistics Finland.
For analyses of regional variance in treatment, the study population was divided into 5 regions based on the catchment areas of the 5 Finnish university hospitals (which provide tertiary care in the respective areas), i.e. areas of the Helsinki University Hospital, the Kuopio University Hospital, the Oulu University Hospital, the Tampere University Hospital and the Turku University Hospital. Sex- and age-specific baseline population numbers were obtained from the Statistics Finland. The study was approved by the National Institute for Health and Welfare of Finland (permission numbers: THL/143/5.05.00/2015 and THL/707/5.05.00/2016) and Statistics Finland (TK53-1410-15).
Cancer data
The Finnish Cancer Registry (FCR) is population based and covers all parts of Finland. The registry receives notifications on tumours independently from multiple sources at different phases of the disease, which improves registration coverage. This coverage has been shown to be more than 99% [9]. All primary malignant neoplasms of the lung and trachea (ICD 10 C33-C34) diagnosed during the study period were considered from the Finnish Cancer Registry. Disease extent was classified as (i) isolated tumour, (ii) spread to regional lymph nodes, (iii) invasion of adjacent structures and (iv) spread beyond regional lymph nodes. Surgical rate was defined as the number of resections for lung cancer divided by the number of diagnosed new lung cancers (from the Finnish Cancer Registry).
Data analysis
The data were divided into 2 eras to analyse changes in treatment strategies and baseline characteristics: 2004–2009 and 2010–2014. Cancer incidence was standardized with the European 2013 standard population. A cut-off point of 25 resections/year was used to separate low- and high-volume centres. The cut-off value of 25 represented the hinge point for volume on the Classification and Regression Tree (CART) analysis with death as outcome. The Charlson comorbidity index (CCI) excluding lung cancer and tracheal cancer (C33-C34) was calculated according to a previously used algorithm [10]. Differences between groups were evaluated by the χ2 test, Mann–Whitney U-test or t-test with Bonferroni correction for multiple testing as appropriate. Patients who died during admission for surgery (1.3%) were excluded from analysis of length of hospital stay (beginning days). Factors associated with VATS were analysed with logistic regression. The association between study era and 1 year all-cause mortality after surgery was analysed with the Cox regression modelling. To allow 1-year follow-up period, patients who underwent surgery up to the end of 2013 were included in mortality analyses. Results are given as mean, median, percentage, odds ratio or hazard ratio (HR) with 95% confidence interval (CI) or ± standard deviation. P-value <0.05 was inferred statistically significant. Analyses were conducted using the SAS version 9.4 (SAS Institute Inc., Cary, NC, USA).
RESULTS
Patients
During the study period, there were 26 796 new lung cancer diagnoses in the population ≥15 years of age in Finland resulting in an incidence rate of 57.3/100 000 person-years. The incidence rate of lung cancer was 93.2/100 000 in men and 32.2/100 000 in women aged ≥ 15 years. The number of patients who underwent lung resection for lung cancer for the first time in Finland between 2004 and 2014 was 3526. Of these, 63.1% (2225) of patients was men. Of 3526 resections, 2871 (81.4%) were lobectomies, 354 (10.0%) were pneumonectomies, and 301 (8.5%) were sublobar resections. The mean age of lung resection patients was 65.7 ± 9.5 years, and the median CCI score was 2 (range 0–10).
The patient profile, surgical techniques and extent and cancer types changed significantly during the study period (Table 1). There was a decreasing trend in the number of pneumonectomies (P < 0.0003), whereas the number of lobectomies increased (P = 0.0258). The patients who underwent surgery were older (P < 0.0001) and had higher CCI scores (P < 0.0001) in the latter part of the study period. Simultaneously, the length of hospital stay during admission for surgery decreased (P < 0.0001) from 9.6 ± 4.9 to 8.4 ± 4.6 days.
Patient characteristics and differences between 2004–2009 and 2010–2014
| Variables | Total (n = 3526) | 2004–09 era (n = 1783) | 2010–14 era (n = 1786) | P-value between era |
|---|---|---|---|---|
| Age (years), mean ± SD | 65.7 ± 9.5 | 64.9 ± 9.8 | 66.6 ± 9.2 | <0.0001 |
| Female gender, n (%) | 1301 (36.9) | 609 (34.2) | 692 (39.6) | 0.0009 |
| CCI score, n (%) | <0.0001 | |||
| 0–1 | 598 (17.0) | 278 (15.6) | 320 (18.3) | 0.1284 |
| 2 | 2031 (60.4) | 1189 (66.8) | 942 (54.0) | <0.0004 |
| 3 | 537 (15.2) | 226 (12.7) | 311 (17.8) | <0.0004 |
| ≥4 | 260 (7.4) | 87 (4.9) | 173 (9.9) | <0.0004 |
| Length of stay (days),a mean ± SD | 9.0 ± 4.8 | 9.6 ± 4.9 | 8.4 ± 4.6 | <0.0001 |
| VATS resections, n (%) | 710 (20.1) | 135 (7.6) | 575 (32.9) | <0.0001 |
| Surgery type, n (%) | <0.0001 | |||
| Lobectomy/bilobectomy | 2871 (81.4) | 1419 (79.7) | 1451 (83.2) | 0.0258 |
| Pneumonectomy | 354 (10.0) | 224 (12.6) | 130 (7.5) | <0.0003 |
| Sublobar resection | 301 (8.5) | 137 (7.7) | 164 (9.4) | 0.2145 |
| Adjuvant chemotherapy,bn (%) | 712 (20.5) | 430 (24.7) | 282 (16.2) | <0.0001 |
| Adjuvant radiotherapy,bn (%) | 458 (13.2) | 325 (18.7) | 133 (7.6) | <0.0001 |
| Stage, n (%) | <0.001 | |||
| Unknown | 1169 (33.6) | 426 (24.5) | 743 (42.7) | <0.0004 |
| Isolated tumour | 1408 (40.4) | 805 (46.2) | 603 (34.6) | <0.0004 |
| Spread only to regional lymph nodes | 543 (15.6) | 308 (17.7) | 235 (13.5) | 0.0064 |
| Spread beyond regional lymph nodes | 362 (10.4) | 202 (11.6) | 160 (9.2) | 0.1304 |
| Morphology,bn (%) | ||||
| Adenocarcinoma | 1785 (50.6) | 828 (46.5) | 957 (54.8) | <0.0001 |
| Squamous cell carcinoma | 1107 (31.8) | 608 (34.9) | 499 (28.7) | 0.0004 |
| Atypical carcinoid tumour | 222 (6.4) | 114 (6.5) | 110 (6.3) | 0.9922 |
| Parvocellular carcinoma | 82 (2.4) | 45 (2.6) | 37 (2.1) | 0.4205 |
| Sarcoma | 21 (0.6) | 9 (0.5) | 12 (0.7) | 0.4833 |
| Lymphoma | 19 (0.6) | 10 (0.6) | 9 (0.5) | 0.8510 |
| Other/carcinoma NOS | 246 (7.1) | 129 (7.4) | 117 (6.7) | 0.5245 |
n = 3480.
n = 3482.
CCI: Charlson comorbidity index; NOS: not otherwise specified; SD: standard deviation; VATS: video-assisted thoracoscopic surgery.
The proportion of patients with known spread to regional lymph nodes increased (P = 0.0064) during the study period. In the latter part of the study period, adjuvant chemotherapy or radiotherapy were less commonly (P < 0.0001) used. Adenocarcinoma was the most common cancer type (46.7%) followed by squamous cell carcinoma (31.8%) (Table 1). The rates of operated adenocarcinomas increased significantly (P < 0.0001) during the study, whereas rates of operated squamocellular carcinoma had a decreasing trend (P = 0.0004). Rates of surgeries for sarcoma, lymphoma, parvocellular carcinoma and atypical carcinoid tumour remained stable during the study.
Surgery rate
The overall rate of surgery during the study period was 13.1%. This rate was 15.3% in women and 12.2% in men (P < 0.0001). Annual overall surgical rates varied from 11.4% to 15.5% with an increasing trend from 2010 onwards (Fig. 1). Surgery rates increased significantly from 12.6% in 2004–2009 to 13.8% in 2010–2014 (P = 0.0040). Cancer patients younger than 50 years were most commonly treated with surgery (Fig. 2). The surgical rate was 19.3–16.6% in patients aged 50–69 years, and it decreased with age. Older lung cancer patients were more likely to be treated with lung resection in 2010–2014 vs 2004–2009 (Fig. 2). Rates of lung cancer surgery were higher in the Northern part of Finland (Oulu district) than elsewhere (15.4% vs 11.9–13.5%, P < 0.0005), but otherwise there were no significant differences between university districts.
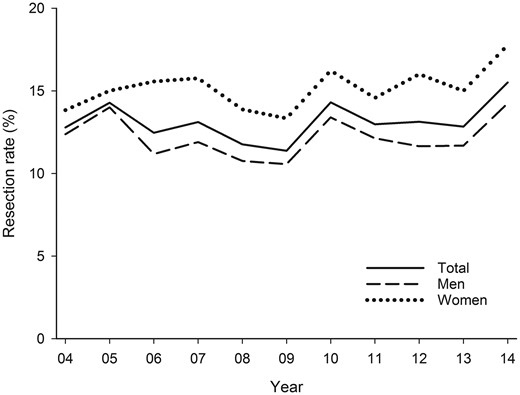
Annual resection rates for lung cancer in Finland.
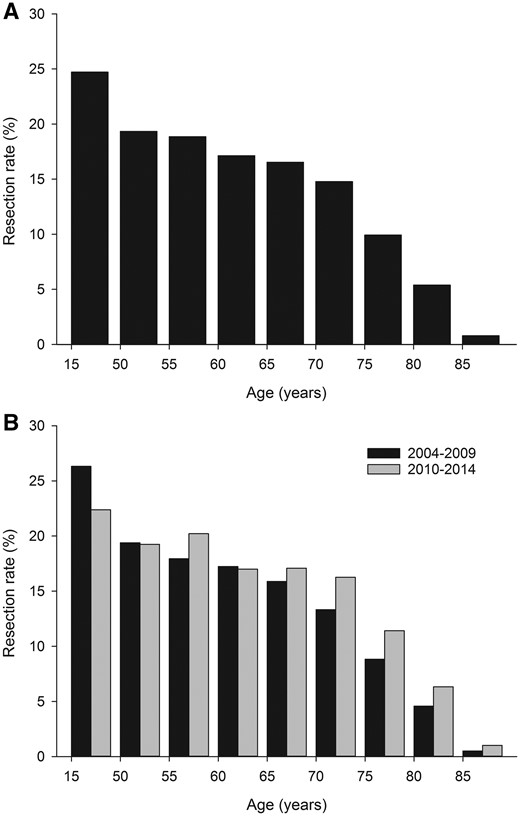
Age-specific resection rates for lung cancer in 2004–2014 (A) and 2004–2009 vs 2010–2014 (B).
Mortality rate and survival
The mortality after lung resection was 2.3% at 30 days and 4.4% at 90 days without a change between eras. Overall, 14.9% of the patients who underwent surgery died during the first year. One-year mortality was 13.4% in the latter part of the study period when compared with 16.7% in the earlier period (Fig. 3). The difference was significant (HR 0.83; CI 0.68–0.99, P = 0.0041) in univariate analysis and when adjusted for patient and tumour-specific covariables (Table 1) (HR 0.81; CI 0.67–0.99, P = 0.0442). There was no difference in mortality when adjusted for surgical type and technique (HR 0.88; CI 0.72–1.07, P = 0.2005). Four-year survival improved from 53% to 60.1% (P < 0.001).
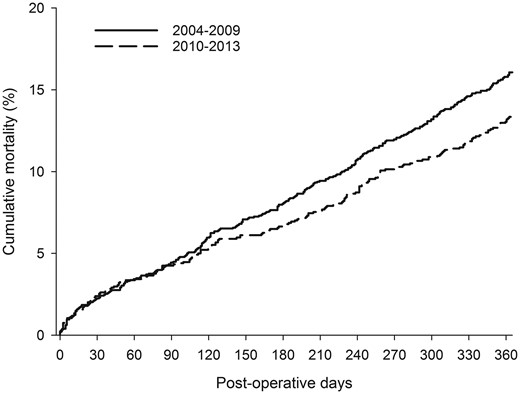
One-year mortality after surgical lung resection for cancer by study era.
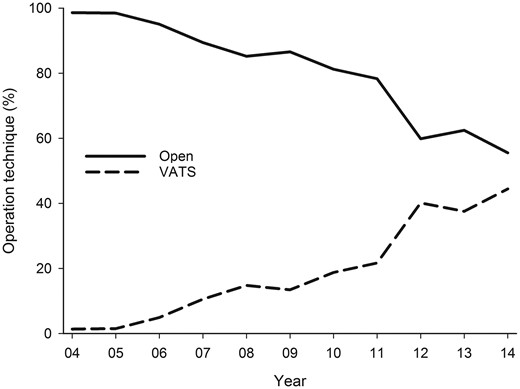
Usage of video-assisted thoracoscopic surgery
VATS usage in lung cancer resections increased from 1.4% in 2004 to 44.4% in 2014 (Fig. 4) with a mean rate of 20.1% during the study. The adjusted odds ratio for VATS usage in 2010–2014 was 5.3 (CI 4.2–6.6) when compared with 2004–2009. Female sex and aging were associated with VATS usage regardless of other covariables (Table 2). Pneumonectomy was rarely performed using VATS (0.9% of pneumonectomies) when compared with lobectomies (19.6%) or sublobar resections (47.8%). Isolated tumours were significantly more likely to be operated with VATS when compared with regionally or further spread disease. Usage of VATS was more commonly associated with adenocarcinoma when compared with squamocellular carcinoma after multivariate adjustment, whereas VATS usage was similar among other cancer types.
Factors associated with the usage of VATS
| Variables | Univariate (n = 3526) | Multivariate (n = 3482) | ||
|---|---|---|---|---|
| OR (95% CI) | P-value | OR (95% CI) | P-value | |
| Female gender | 1.60 (1.36–1.89) | <0.0001 | 1.24 (1.02–1.51) | 0.0332 |
| Age (vs 15–49 years) | <0.0001 | 0.0024 | ||
| 50–59 years | 1.73 (1.02–2.94) | 2.10 (1.15–3.83) | ||
| 60–69 years | 2.13 (1.29–3.54) | 2.08 (1.16–3.70) | ||
| 70–79 years | 2.50 (1.50–4.15) | 2.46 (1.37–4.40) | ||
| 80 years and older | 3.84 (2.16–6.84) | 3.57 (1.83–6.97) | ||
| CCI score >2 | 1.32 (1.09–1.59) | 0.0043 | 1.16 (0.93–1.45) | 0.1770 |
| Surgery type (reference pneumonectomy) | <0.0001 | <0.0001 | ||
| Lobectomy/bilobectomy | 28.50 (9.13–89.25) | 20.26 (6.40– 64.18) | ||
| Sublobar resection | 107.31 (33.69–341.86) | 86.76 (26.01–276.16) | ||
| Stage (reference isolated tumour) | <0.0001 | <0.0001 | ||
| Spread only to regional lymph nodes | 0.33 (0.23–0.47) | 0.37 (0.25–0.54) | ||
| Spread beyond regional lymph nodes | 0.72 (0.52–0.99) | 0.74 (0.52–1.07) | ||
| Unknown | 1.83 (1.52–2.19) | 1.39 (1.13–1.71) | ||
| Morphotype (vs squamocellular carcinoma)a | <0.0001 | <0.0001 | ||
| Adenocarcinoma | 1.93 (1.59–2.36) | 1.65 (1.31–2.07) | ||
| Atypical carcinoid tumour | 1.65 (1.16–2.36) | 0.93 (0.60–1.44) | ||
| Other | 0.96 (0.69–1.35) | 0.89 (0.61–1.30) | ||
| Study era 2010–14 (vs 2004–2009) | 5.98 (4.89–7.32) | <0.0001 | 5.40 (4.34–6.72) | <0.0001 |
| Larger centre size (>25 surgeries/year) | 2.71 (2.24–3.28) | <0.0001 | 2.53 (2.04–3.12) | <0.0001 |
n = 3482.
CCI: Charlson comorbidity index; CI: confidence interval; OR: odds ratio; VATS: video-assisted thoracoscopic surgery.
Trends for usage of VATS and open surgery for lung cancer resection in 2004–2014. VATS: video-assisted thoracoscopic surgery.
DISCUSSION
This study reports, based on 3 different compulsory national healthcare registries, the nationwide results of lung cancer surgery in Finland. Overall, the rate of surgery was 13.5% with only small variations between geographical areas. In Finland, 30-day and 90-day mortalities were 2.3% and 4.3%, respectively, with a survival of 50.2% at 5 years.
The prognosis for lung cancer patients who underwent surgery is estimated preoperatively based on the International Association for the Study of Lung Cancer Tumor Node Metastasis staging system (IASLC TNM). In the 7th edition, only a minority of the data are, however, from population-based registries, which introduces a considerable bias [11]. For example, the estimated overall survival in Denmark using the stage distribution of patients who underwent surgery from 2003 to 2009 and overall survival by pathological stage according to the 7th edition are significantly higher (57.7%) than the actual observed survival of approximately 45% in Denmark when compared with that of Finland in the same years (47.8%) [12]. In the 8th edition of the IASLC staging project, the Danish national data are included and now represents 36% of the patients in the IASLC database. In that database, on the other hand, a significant number of patients (44%) are from Asia [13]. Therefore, the IASLC survivals will overestimate survival at the national level in Western countries. In Finland, during the decade up to 2014, overall survival for resected lung cancer patients in our study was 60.6% at 4 years and estimated survival was approximately 55% at 5 years being comparable with outcomes in most Western countries.
The mortality rate of 2.3% at 30 days that was observed in Finland was similar to that of Denmark (2.1%) or France (2.4%) but slightly lower than that in Norway in 2006–2007 (3.0%), in the UK in 2004–2010 (3.0%) or in the ESTS database between 2007 and 2013 (3.7%) [4, 14–17]. Similar to Danish and English national data and Dutch regional data, mortality doubles by 90 days to 4.3% [14, 18]. Other population-based studies report 90-day mortality figures at 5.0% in Ontario, 5.4% in the US National Cancer database, 5.9% in the UK and 6.8% in the Dutch regional cancer registry [17–20]. In other words, a marked risk of death persists beyond the traditionally reported 30-day mortality, and this national population-based study supports previous findings that 90-day mortality might provide a more accurate outcome measure for major surgery [21].
The optimal rate of surgery in the treatment of lung cancer is subject to uncertainty. The key is the denominator in the equation. Excluding such disputed groups as patients without histological or cytological verification, patients with postmortem diagnoses or patients with small cell cancer increases the rate of surgery. In our study, all these groups were included, which lowers the observed surgical rate. The resection rate in Western European countries with population-based cancer registries has varied between 9% and 18% [3–5]. The rate of 13.5% in Finland seems to lie in the middle range in these type of data with little variation between geographical areas. This rate is, however, markedly lower than the population-based rate in all other Nordic countries [4, 5, 22, 23]. In Sweden and Norway, the overall 5-year survival of patients with lung cancer is also better than that in Finland. In Denmark, the improved overall survival has been shown to be related to higher surgical rates and a pronounced reduction in the mortality of patients with Stage I disease [22]. It seems, as suggested, that overall survival could be increased with the improved results of modern surgery and with higher rates of lung cancer surgery [3].
In Finland, the rate of surgery decreases in patients aged 75 years and older. A similar drop in the UK occurred 10 years earlier [23]. The drop reflects a reluctance to extend surgery in patients at a higher surgical risk due to comorbidities and poorer exercise capacity. Even though the ERS-ESTS guidelines recommend that these risks be fully evaluated without any age prejudice, this lower rate of surgery may well reflect age itself [24–26]. In fact, in the elderly, the proportion of patients who had local disease at the time of diagnosis actually seems to be higher, and furthermore, survival among these patients could be comparable with that of younger patients [25, 26]. Especially VATS provides a less morbid option for the elderly and should increase the rate of surgery in this age group. In Finland, the increasing number of elderly patients who underwent surgery seems, however, to be related to an aging population with a higher absolute number of elderly lung cancer patients rather than an actual increase in the rate of surgery in this age group.
VATS offers less invasive surgery for lung cancer with lower mortality and morbidity, with better quality of life and at least equivalent survival [8, 27–29]. At the population level in Denmark, surgical mortality has declined significantly simultaneously with an increasing rate of VATS. In Finland, no decline in short-term mortality was evident, but overall the short-term mortality was already low. The rate of 32% in VATS in this study is, however, still relatively low, and this period included the major learning curve phase of VATS in Finland. The rate is, however, significantly higher than the rate in France (7.4% in 2011–2012) or in the ESTS database [15, 30]. In both the STS and ESTS databases, open surgery is associated with higher mortality [8, 31]. Overall mortality in the recent years was lower in the STS database with significantly higher rate of VATS (63% vs 22%) [30]. Therefore, it could be speculated that with the increasing rate of usage and experience of VATS in Finland and widely in Europe, the mortality of lung cancer surgery will likely decline. This is, however, likely also related to other concomitant paradigm shifts in the treatment of lung cancer, such as specialization and improvements in multidisciplinary decision-making. Importantly, also the non-surgical treatment modalities such as more tailored adjuvant and neoadjuvant chemotherapeutic and radiotherapeutic modalities are likely to have had an impact on survival, but granular data on the specifics of these therapies were not readily available in the current database to provide insights into their roles. The prevalence of patients receiving adjuvant therapies actually declined during the study, which could reflect better preoperative staging and less stage shift in patients who underwent surgery.
The completeness of the data, nationwide coverage and large size of a population-based design are major strengths of this study. Furthermore, in this study, because of personal and immutable identity numbers of Finnish people and compulsory Finnish registries, lung cancer patients undergoing lung resection could be reliably identified and followed without follow-up losses. The major weakness is the lack of data on TNM stage or preoperative diagnostic protocols (e.g. use of PET-CT and/or invasive staging). In addition, we could not reliably separate wedge resection and segmentectomy, and therefore, both were classified as sublobar resection. Furthermore, the type and exact extent of nodal retrieval or the number of extended resection could not be defined. Because of the nature of these data, our aim was to evaluate overall results and trends of surgical treatment for lung cancer rather than concentrate on the specific technical details of surgery. A possible source of bias is the fact that the proportion of patients classified as having ‘unknown’ tumour stage increased between study periods. Unknown stage was also associated with VATS on multivariable analysis. An explanation for this is that the data retrieval from the cancer registry can be delayed by ongoing treatment and consequently reporting for patients in the later years of the study was still pending. When adjusted for stage, the survival difference was, however, still significant, whereas adjusting for surgical technique rendered the survival difference non-significant, which points to the notion that surgical approach and not tumour stage explains the improvement in survival.
Stage shift between study periods could explain improved survival, but this is unlikely to be important taking into account that during the entire study period no local or national screening endeavours have been adopted in Finland.
CONCLUSION
In conclusion, this nationwide population-based study demonstrates an improvement in long-term outcome after lung cancer surgery despite an increasing comorbidity burden and age of the patient population concomitantly with an increase in surgical rates and use of VATS. This suggests that extending surgical treatment to higher risk patients especially with minimally invasive surgery could improve overall survival in lung cancer patients.
Conflict of interest: none declared.
REFERENCES
http://stats.cancerregistry.fi/stats/fin/vfin0003i0.html (1 October 2017, date last accessed).
De Leyn P, Dooms C, Kuzdzal J, Lardinois D, Passlick B, Rami-Porta R et al. Revised ESTS guidelines for preoperative mediastinal lymph node staging for non-small-cell lung cancer.
http://www.ests.org/_userfiles/pages/files/ESTS Report 2014_final_on-line.pdf (1 October 2017, date last accessed).
Author notes
Presented at the IASLC 18th World Conference on Lung Cancer, Vienna, Austria, 15–18 October 2017.
Jarmo Gunn and Johanna Valo authors contributed equally to this study.
