


Abstract
To investigate whether and in which patients with catheter-derived low pressure gradient (PG, <40 mmHg) severe (aortic valve area ≤ 1 cm2) aortic stenosis and preserved left ventricular ejection fraction, early aortic valve replacement (AVR) might improve survival.
We investigated a total of 506 consecutive patients (age 75 ± 9 years, 58% men) with either moderate aortic stenosis (MAS) or severe aortic stenosis (SAS) and preserved left ventricular ejection fraction (≥50%) as defined at catheterization. Propensity score matching was used to select matched pairs of patients with and without AVR in each group. A 100% complete follow-up of all cause death was obtained after a median of 6.6 years (interquartile range 3.4–8.8 years).
There were 62 (12%) patients with MAS, 119 (24%) patients with SAS and low (<40 mmHg) PG and 325 (64%) patients with SAS and high PG. Significantly less patients with MAS and low-gradient SAS underwent AVR compared to patients with high gradient SAS (58% vs 60% vs 83%, P < 0.001). In propensity score-matched patients, AVR was independently associated with a decrease in all-cause mortality in all groups (P < 0.05) regardless of the PG, stroke volume or aortic valve area.
The present data indicate a that AVR improves survival in SAS regardless of the gradient and flow. This advocates an ‘early-AVR’ rather than a ‘watchful waiting’ strategy.
INTRODUCTION
Aortic valve replacement (AVR) improves survival in severe symptomatic aortic stenosis (AS) [1, 2]. Yet, in many patients with moderate and severe AS, the timing of AVR remains poorly defined. In particular, patients with low mean pressure gradient (PG, <40 mmHg) and moderate-to-severe AS [aortic valve area (AVA) ≤ 1.5 cm2] or patients with high gradient (≥40 mmHg) and moderate AS (AVA between 1 and 1.5 cm2), with preserved left ventricular (LV) ejection fraction are challenging. A mismatch between PG and calculated AVA is frequent, but its clinical significance and impact on ‘early AVR’ versus a ‘watchful waiting’ strategy is unclear with conflicting results across different studies [3–16]. Although many of these patients remain stable for many years on conservative treatment, others show rapid deterioration warranting early AVR [2–4, 9–15, 17–21]. Furthermore, there is growing evidence that even patients with less severe AS may benefit from early AVR before development of more advanced disease [5, 12, 22, 23]. In the majority of these studies, AS severity was assessed by Doppler echocardiography. The latter is hampered by frequent inconsistencies between mean PG and calculated AVA [5, 24, 25]. Therefore, it is likely that patients with a gradient–area mismatch at echocardiography represent a mixture of true severe AS, moderate AS and measurement errors, probably more than if the catheter-derived assessment would have been used [25]. Accordingly, this study investigated whether and in which patients with catheter-derived low-gradient severe AS and preserved LV ejection fraction, AVR is associated with improved long-term survival.
MATERIALS AND METHODS
Study population
The study population comprised consecutive patients (n = 986, 75.3 ± 10.1 years, 58% men) with a tentative diagnosis of moderate-to-severe AS who underwent right and left heart catheterization between January 2002 and December 2010 at our institution (Fig. 1). To be eligible for the study, patients had to fulfil the following criteria: (i) AVA ≤ 1.5 cm2 using the Gorlin formula at heart catheterization [26] and (ii) preserved LV ejection fraction (≥50%) using the Simpson method at biplane LV angiography. Patients with mild (AVA >1.5 cm2) or no AS, reduced LV ejection fraction (<50%), concomitant moderate-to-severe aortic regurgitation or mitral valve disease or intracardiac shunt, active malignancy, complex congenital heart disease and hypertrophic cardiomyopathy were excluded. The final study population consisted of 506 (age 75.2 ± 8.7 years, 58% men) patients. Indications for heart catheterization included symptoms suggestive of symptomatic AS or CAD (the majority of patients), reduced LV ejection fraction or abnormal bicycle ergometry. The recommendation of whether to perform AVR was made by the heart team. The final decision was made by the referring cardiologist and the patient. The study protocol was performed in accordance with the ethics committees of our institution. As part of the standard informed consent procedure as agreed upon by the ethics committee of Onze-Lieve-Vrouw Clinic in Aalst, Belgium, all patients gave their informed consent for the use of their haemodynamic, imaging and clinical follow-up data for the purpose of scientific research.
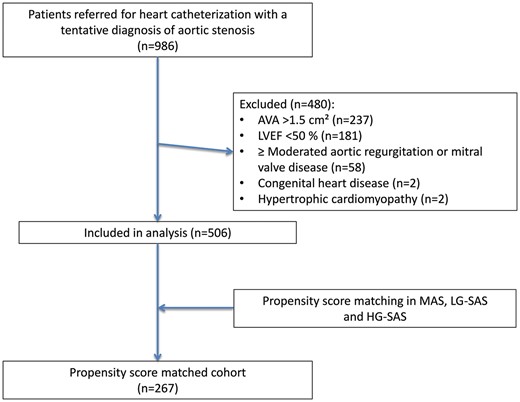
Identification of the study group. AVA: aortic valve area; HG-SAS: high-gradient severe aortic stenosis; LG-SAS: low-gradient severe aortic stenosis; LVEF: left ventricular ejection fraction; MAS: moderate aortic stenosis.
Cardiac catheterization
All patients underwent left and right heart catheterization using a standard percutaneous femoral approach [27]. Cardiac output was obtained using the thermodilution method averaging 3–5 measurements. Stroke volume was derived by dividing cardiac output by heart rate. Stroke volume was indexed to body surface area [stroke volume index (SVI)]. Transaortic valve mean PG was assessed through simultaneous LV and iliac pressure tracings after exclusion of a significant gradient between the central aorta and the iliac artery. The catheter could be passed through the aortic valve in all patients. AVA was calculated using the Gorlin formula [26]. LV ejection fraction was assessed by biplane LV angiography using the Simpson method with automatic edge detection and manual correction as appropriate. Coronary angiography was performed with a 6-Fr or 7-Fr diagnostic or guiding catheter.
Moderate AS (MAS), low-gradient severe AS (LG-SAS) and high-gradient severe AS (HG-SAS) were defined by AVA between 1 and 1.5 cm2, mean PG <40 mmHg and AVA ≤1 cm2 and mean PG ≥40 mmHg and AVA ≤ 1 cm2, respectively.
Data collection and follow-up
Demographic data, medical history, catheterization findings, perioperative, 30-day and follow-up data were collected for analysis. The follow-up was closed on 31 December 2015. In all patients, survival status at the end of follow-up was verified using the National Population Registry.
Statistical analysis
Data were expressed as mean ± standard deviation or median (interquartile range) for continuous variables and as counts or percentages for categorical variables. The Student’s t-test and 1-way analysis of variance (ANOVA) with a post hoc Fisher’s least significant difference test were used to compare continuous variables between 2 and 3 groups, respectively. The non-parametric test (the Kruskal–Wallis test) is used when the parametric test is not appropriate. The Pearson’s χ2 or Fisher’s exact test was used to compare categorical variables between individual groups. The Kaplan–Meier methods and log-rank tests were used for temporal analysis of differences in all-cause mortality between groups. A Cox proportional hazard model was used to identify independent predictors of all-cause mortality. The results were reported as hazard ratios with 95% of confidence interval of probability values. The propensity for AVR was generated using a logistic regression model that included age, gender, smoking habit, hypertension, diabetes, stroke, atrial fibrillation, coronary artery disease (CAD) and peripheral artery disease, logistic EuroSCORE, LV ejection fraction and AVR as covariables. A single propensity score was used to select matched pairs of patients with AVR and without AVR in the MAS (1:1 match), LG-SAS (1:1 match) and HG-SAS (2:1 match) groups. For this purpose, the greedy, nearest neighbour-matching algorithm was used. For all tests, P-values <0.05 were considered significant. Statistical analysis were performed using SPSS version 20 (SPSS Inc., Chicago, IL, USA) and GraphPad Prism version 6.0 (GraphPad Software, San Diego, CA, USA).
RESULTS
Baseline characteristics
At heart catheterization, a total of 62 (12%) patients had MAS (AVA 1.20 ± 0.13 cm2), whereas 119 (24%) and 325 (64%) patients had severe AS (AVA 0.67 ± 0.18, P < 0.001) with a low (LG-SAS) and a high mean PG (HG-SAS), respectively. Table 1 lists baseline clinical and invasive haemodynamic characteristics of the overall population in 3 groups and in the propensity score-matched cohort with and without AVR. Patients with MAS were slightly younger with a slightly higher prevalence of male gender as compared to both groups with SAS. A significantly higher prevalence of diabetes mellitus and previous stroke was observed in the MAS group versus both the SAS groups (P < 0.05). In contrast, the prevalence of atrial fibrillation, CAD or peripheral artery disease and logistic EuroSCORE was similar between groups. The majority of patients in all groups had symptomatic AS (NS).
Baseline characteristics in the overall population with MAS, LG-SAS and HG-SAS and in propensity score-matched patients with and without AVR
| Overall population | Propensity score-matched cohort | ||||||||||||
|---|---|---|---|---|---|---|---|---|---|---|---|---|---|
| MAS (n = 62) | LG-SAS (n = 119) | HG-SAS (n = 325) | P-value | MAS + AVR (n = 18) | MAS − AVR (n = 18) | P-value | LG-SAS + AVR (n = 36) | LG-SAS − AVR (n = 36) | P-value | HG-SAS + AVR (n = 106) | HG-SAS − AVR (n = 53) | P-value | |
| Age (years), mean ± SD | 72 ± 10 | 76 ± 6 | 75 ± 9 | 0.014 | 72 ± 7 | 73 ± 12 | 0.27 | 76 ± 6 | 77 ± 6 | 0.85 | 79 ± 8 | 79 ± 10 | 0.74 |
| Male, n (%) | 43 (69) | 61 (51) | 187 (58) | 0.065 | 13 (72) | 12 (67) | 0.72 | 20 (56) | 19 (53) | 0.81 | 45 (43) | 25 (47) | 0.57 |
| Smoker, n (%) | 14 (23) | 26 (22) | 90 (28) | 0.38 | 2 (11) | 4 (22) | 0.37 | 11 (31) | 7 (19) | 0.28 | 25 (24) | 11 (21) | 0.69 |
| Hypertension, n (%) | 40 (65) | 72 (61) | 199 (61) | 0.86 | 13 (72) | 12 (67) | 0.72 | 20 (56) | 23 (64) | 0.47 | 76 (72) | 38 (72) | 1.00 |
| Diabetes mellitus, n (%) | 20 (32) | 31 (26) | 61 (19) | 0.032 | 4 (22) | 5 (28) | 0.70 | 7 (19) | 10 (28) | 0.41 | 34 (32) | 18 (34) | 0.81 |
| Previous stroke, n (%) | 7 (11) | 6 (5) | 12 (4) | 0.041 | 4 (22) | 2 (11) | 0.37 | 1 (3) | 2 (6) | 0.56 | 6 (6) | 4 (8) | 0.64 |
| Atrial fibrillation, n (%) | 3 (5) | 9 (8) | 28 (9) | 0.59 | 1 (6) | 1 (6) | 1.00 | 3 (8) | 3 (8) | 1.00 | 5 (5) | 3 (6) | 0.80 |
| CAD, n (%) | 53 (86) | 103 (87) | 263 (81) | 0.32 | 15 (83) | 15 (83) | 1.00 | 32 (89) | 33 (92) | 0.69 | 96 (91) | 46 (87) | 0.47 |
| PAD, n (%) | 5 (8) | 11 (9) | 19 (6) | 0.43 | 2 (11) | 3 (17) | 0.63 | 2 (6) | 3 (8) | 0.64 | 6 (6) | 4 (8) | 0.64 |
| Symptoms, n (%) | 49 (79) | 102 (86) | 260 (80) | 0.35 | 11 (61) | 12 (67) | 0.72 | 22 (61) | 22 (61) | 1.00 | 58 (55) | 33 (62) | 0.37 |
| Logistic EuroSCORE (%) | 9 (4–12) | 11 (5–15) | 12 (5–14) | 0.173 | 5 (3–16) | 7 (4–14) | 0.37 | 8 (5–11) | 9 (5–16) | 0.38 | 11 (7–19) | 13 (8–18) | 0.16 |
| Haemodynamic data, mean ± SD | |||||||||||||
| Body surface area (m2) | 1.9 ± 0.2 | 1.8 ± 0.2 | 1.8 ± 0.2 | 0.003 | 1.9 ± 0.2 | 2 ± 0.2 | 0.48 | 1.8 ± 0.2 | 1.8 ± 0.2 | 0.86 | 1.8 ± 0.2 | 1.8 ± 0.2 | 0.71 |
| Heart rate (beats/min) | 73 ± 15 | 70 ± 12 | 70 ± 12 | 0.427 | 73 ± 13 | 75 ± 18 | 0.71 | 69 ± 11 | 71 ± 11 | 0.96 | 70 ± 12 | 68 ± 12 | 0.63 |
| Systolic BP (mmHg) | 159 ± 39 | 164 ± 26 | 155 ± 29 | 0.081 | 160 ± 25 | 145 ± 65 | 0.19 | 163 ± 18 | 171 ± 35 | 0.01 | 156 ± 28 | 156 ± 38 | 0.26 |
| LVEDV (ml) | 153 ± 44 | 133 ± 42 | 140 ± 44 | 0.008 | 159 ± 55 | 154 ± 33 | 0.09 | 135 ± 38 | 125 ± 47 | 0.56 | 140 ± 46 | 132 ± 46 | 0.94 |
| LVEF (%) | 75 ± 13 | 73 ± 11 | 75 ± 11 | 0.135 | 75 ± 13 | 75 ± 12 | 0.70 | 72 ± 11 | 72 ± 11 | 0.88 | 74 ± 11 | 75 ± 12 | 0.19 |
| LV SVI (ml/m2) | 61 ± 20 | 52 ± 15 | 57 ± 17 | 0.056 | 62 ± 20 | 59 ± 15 | 0.74 | 52 ± 16 | 50 ± 15 | 0.94 | 57 ± 18 | 55 ± 16 | 0.99 |
| Mean PG (mmHg) | 29 ± 7 | 31 ± 5 | 58 ± 14 | <0.001 | 31 ± 9 | 28 ± 5 | 0.20 | 31 ± 6 | 30 ± 5 | 0.26 | 56 ± 12 | 56 ± 16 | 0.14 |
| AVA (cm2) | 1.2 ± 0.1 | 0.8 ± 0.2 | 0.6 ± 0.2 | <0.001 | 1.2 ± 0.2 | 1.2 ± 0.1 | 0.79 | 0.8 ± 0.1 | 0.8 ± 0.2 | 0.12 | 0.6 ± 0.2 | 0.6 ± 0.2 | 0.15 |
| AVA index (cm2/m2) | 0.7 ± 0.1 | 0.4 ± 0.1 | 0.4 ± 0.1 | <0.001 | 0.7 ± 0.2 | 0.6 ± 0.1 | 0.80 | 0.4 ± 0.1 | 0.5 ± 0.1 | 0.17 | 0.4 ± 0.1 | 0.3 ± 0.1 | 0.23 |
AVA: aortic valve area; AVR: aortic valve replacement; BP: blood pressure; CAD: coronary artery disease; HG-SAS: high-gradient severe aortic stenosis; LG-SAS: low-gradient severe aortic stenosis; LVEDV: left ventricular end-diastolic volume; LVEF: left ventricular ejection fraction; LV SVI: left ventricular stroke volume index; MAS: moderate aortic stenosis; PAD: peripheral artery disease; PG: pressure gradient; SD: standard deviation.
At heart catheterization, patients with LG-SAS showed significantly smaller LV end-diastolic volume and SVI than patients with MAS (P < 0.01), while the LV ejection fraction was similar. Transaortic mean PG was significantly higher in the HG-SAS than in the LG-SAS and the MAS groups (P < 0.01). AVA was the smallest in the HG-SAS group compared with the LG-SAS or the MAS group (both P < 0.01). After propensity score matching, patients with and without AVR were well balanced in each group.
Clinical outcomes
Following the index catheterization, AVR was performed in 377 (75%) patients within a median of 36 days (IQR 19–55 days), whereas the remaining patients were treated conservatively. The majority of patients underwent surgical AVR (96%) either isolated (40%) or combined with concomitant coronary artery bypass grafting (60%). A significantly lower proportion of patients in the MAS and LG-SAS groups underwent AVR, both with or without CABG, compared with the HG-SAS group (P < 0.001) (Table 2). The 30-day mortality post-AVR was similar in all 3 groups (NS).
Clinical outcome in moderate, low-gradient and high-gradient severe aortic stenosis
| MAS (n = 62) | LG-SAS (n = 119) | HG-SAS (n = 325) | P-value | |
|---|---|---|---|---|
| AVR, n (%) | 36 (58)* | 71 (60)* | 270 (83) | <0.001 |
| Isolated AVR, n (%) | 5 (8)* | 13 (11)* | 103 (32) | <0.001 |
| AVR + CABG, n (%) | 20 (32)* | 44 (37)* | 163 (50) | <0.001 |
| Time to AVR (days), median (IQR) | 51 (10–587) | 38 (21–77)*** | 34 (19–51)*** | <0.001 |
| 30-Day mortality post-AVR, n (%) | 1 (3) | 5 (7) | 10 (4) | 0.416 |
| Total mortality post-AVR, n (%) | 16 (44) | 36 (51) | 118 (44) | 0.234 |
| Total mortality CON treatment, n (%) | 19 (73) | 41 (85)** | 48 (87)** | <0.05 |
| Mean follow-up period (years), n | 7.7 | 6.8 | 9.1 | 0.002 |
P < 0.01 versus HG-SAS.
P < 0.05.
P < 0.01 versus MAS.
AVR: aortic valve replacement; CABG: coronary artery bypass grafting; CON: conservative; HG-SAS: high-gradient severe aortic stenosis; IQR: interquartile range; MAS: moderate aortic stenosis.
During a median follow-up of 6.6 years (IQR 3.4–8.8 years), a total of 278 (55%) patients died from any cause. In patients treated conservatively, the lowest all-cause mortality was observed in the MAS group (P < 0.05), whereas patients with SAS showed higher mortality without statistical difference between the LG-SAS group and the HG-SAS group (Fig. 2). For the overall cohort, patients post-AVR had significantly lower mortality than patients treated conservatively regardless of the group assignment (P < 0.05) (Fig. 3). Improved survival post-AVR was also confirmed for the propensity score-matched LG-SAS and HG-SAS cohort. In contrast, in the matched MAS group, survival time was not significantly prolonged by AVR probably because of low number of paired patients.
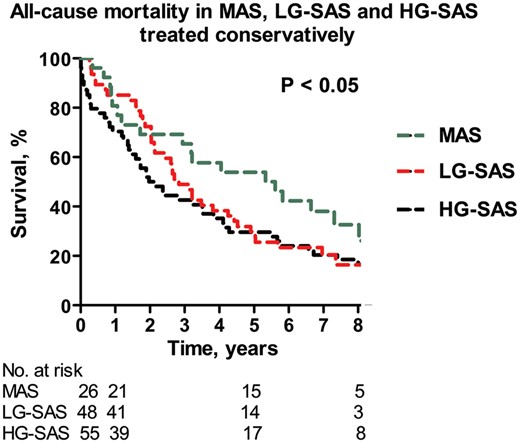
The Kaplan–Meier curve: all-cause MAS, LG-SAS and HG-SAS treated conservatively. HG-SAS: high-gradient severe aortic stenosis; LG-SAS: low-gradient severe aortic stenosis; MAS: moderate aortic stenosis.
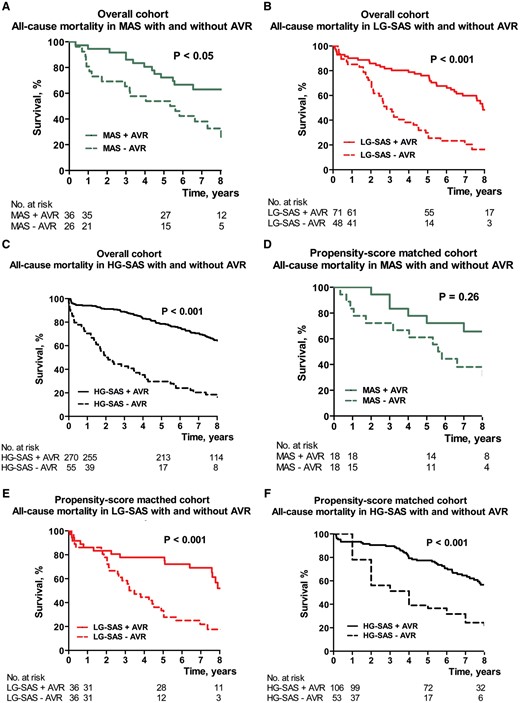
The Kaplan–Meier curve: all-cause mortality for overall cohort (A–C) and for the propensity score-matched cohort (D–F) in MAS (A, D), LG-SAS (B, E) and HG-SAS (C, F) with (solid line) or without (dotted line) AVR. AVR: aortic valve replacement; HG-SAS: high-gradient severe aortic stenosis; LG-SAS: low-gradient severe aortic stenosis; MAS: moderate aortic stenosis.
Predictors of all-cause mortality
Table 3 lists independent predictors of all-cause mortality in Cox regression analysis for the overall population and for the propensity score-matched cohort. In the overall population, in MAS, age, CAD and LV ejection fraction emerged as independent predictors of death (all P < 0.05). In LG-SAS, atrial fibrillation was independently associated with increased mortality (P < 0.01), while age tended to predict survival (P = 0.058). In HG-SAS, age and LV ejection fraction were identified as independent predictors of mortality (both P <0.001). AVR showed independent association with reduction of all-cause mortality in patients with both LG-SAS and HG-SAS (both P < 0.001), and it tended to predict mortality in patients with MAS (P = 0.075). Cox regression analysis for the propensity score-matched cohort confirmed the results for the overall population with 2 exceptions: AVR independently reduced all-cause mortality also in MAS, whereas CAD did not. Other characteristics, including gender, diabetes mellitus, symptoms, transaortic mean PG, SVI or AVA, were not predictors.
Independent predictors of all-cause mortality in the overall population and in propensity score-matched cohort in MAS, LG-SAS and HG-SAS
| Overall population | Propensity score-matched cohort | |||||||||||
|---|---|---|---|---|---|---|---|---|---|---|---|---|
| MAS | LG-SAS | HG-SAS | MAS | LG-SA | HG-SAS | |||||||
| OR (95% CI) | P-value | OR (95% CI) | P-value | OR (95% CI) | P-value | OR (95% CI) | P-value | OR (95% CI) | P-value | OR (95% CI) | P-value | |
| Age | 1.09 (1.04–1.15) | 0.001 | 1.04 (0.99–1.09) | 0.112 | 1.06 (1.03–1.08) | <0.001 | 1.12 (1.03–1.22) | 0.006 | 0.99 (0.92–1.07) | 0.83 | 1.05 (1.02–1.08) | 0.002 |
| CAD | 8.60 (1.69–43.78) | 0.010 | 1.51 (0.70–3.25) | 0.297 | 1.26 (0.79–2.01) | 0.328 | 12.9 (0.35–48.10) | 0.165 | 1.52 (0.42–5.56) | 0.527 | 0.92 (0.45–1.90) | 0.824 |
| AF | 3.10 (0.58–16.52) | 0.186 | 3.39 (1.65–6.98) | 0.001 | 1.11 (0.64–1.92) | 0.707 | 2.59 (0.19–35.29) | 0.476 | 3.13 (1.30–7.51) | 0.011 | 0.56 (0.17–1.90) | 0.563 |
| LVEF | 0.96 (0.94–0.99) | 0.003 | 1.01 (0.98–1.04) | 0.479 | 0.98 (0.97–0.99) | 0.001 | 0.95 (0.91–0.99) | 0.034 | 1.00 (0.96–1.04) | 0.941 | 0.98 (0.97–0.99) | 0.026 |
| AVR | 0.48 (0.19–1.17) | 0.107 | 0.33 (0.21–0.53) | <0.001 | 0.25 (0.18–0.36) | <0.001 | 0.33 (0.13–0.86) | 0.023 | 0.31 (0.17–0.58) | <0.001 | 0.28 (0.19–0.42) | <0.0001 |
AF: atrial fibrillation; AVR: aortic valve replacement; CAD: coronary artery disease; CI: confidence interval; HG-SAS: high-gradient severe aortic stenosis; LG-SAS: low-gradient severe aortic stenosis; LVEF: left ventricular ejection fraction; MAS: moderate aortic stenosis; OR: odds ratio.
DISCUSSION
The main findings of this study can be summarized as follows: (i) LG-SAS represents a subgroup of patients with severe AS with similar clinical outcome and effects of AVR as compared to patients in HG-SAS. Low referral for AVR accounts for worse long-term outcome in LG-SAS versus HG-SAS; (ii) AVR is associated with improved survival regardless of the gradient and flow pattern and (iii) however, patients with HG-SAS appear to benefit earlier from AVR than patients with LG-SAS.
Clinical outcome and effects of aortic valve replacement in low-gradient severe aortic stenosis
The combination of low-gradient, small AVA and preserved LV ejection fraction occurs frequently, and it is referred to as LG-SAS [4, 5]. The clinical significance and optimal timing of AVR in LG-SAS is a matter of ongoing controversies. LG-SAS with preserved ejection fraction is considered to represent both a unique clinical entity and the product of Doppler echocardiography-derived measurement errors [4–15, 25]. Compared with the echocardiography-derived assessment, the catheter-derived assessment of AS severity is associated with a significantly lower prevalence of mean PG-AVA mismatch [25]. This suggests that the majority of patients with LG-SAS at heart catheterization in this study were likely to have had true LG-SAS. Several studies suggested that LG-SAS represents an advanced disease evolving from HG-SAS with reduced LV longitudinal function, increased diffuse myocardial fibrosis, increased afterload and poor prognosis [7, 8, 11]. In contrast, others showed that the transition from HG-SAS towards LG-SAS occurs only infrequently (5%) and LG-SAS rather represents a specific AS phenotype characterized by a unique remodelling pattern [14]. The completely opposite disease course has been also proposed by showing a time-dependent transition from LG-SAS to typical HG-SAS during follow-up [9, 10, 13, 15]. In those studies, patients with LG-SAS had a clinical outcome similar to that of mild–to-moderate AS and LG-SAS has been suggested to represent a benign form of AS [9, 10, 13, 15]. On a similar note, in LG-SAS, AVR has been associated with improved survival in some [3, 6, 11, 12] but not in other studies [9, 13, 15, 17]. In view of these conflicting results and because of the presence of a low gradient, it is not surprising that the timing of AVR in these patients remains uncertain with resulting low referral for AVR [4, 5]. In this study, patients with LG-SAS showed a smaller LV end-diastolic volume than patients with MAS. During long-term follow-up, in patients on conservative treatment, the lowest all-cause mortality was observed in the MAS group, while both groups with severe AS showed a significantly higher but similar mortality independently of the gradient pattern. Significantly less patients with low gradient (MAS and LG-SAS) than HG-SAS underwent AVR despite similar estimated perioperative mortality risk. We have observed that AVR was independently associated with a more than 66% reduction in mortality in both the LG-SAS and the HG-SAS groups regardless of symptoms, concomitant CAD or mean PG. This supports the hypothesis that LG-SAS represents a unique phenotypic form of severe AS with a similar outcome and effects of AVR as in HG-SAS. Lower referral for AVR is one of the major reasons for the poor outcome in LG-SAS.
Early aortic valve replacement versus watchful waiting strategy
LG-SAS with preserved LV ejection fraction can be divided according to the flow pattern into low flow (SVI < 35 ml/m2) and normal flow LG-SAS [5]. Although low-flow LG-SAS is considered by expert consensus to represent advanced disease demanding timely AVR (Class IIa), normal flow LG-SAS is regarded as benign disease warranting watchful observation as the initial strategy [1, 2, 5]. Yet SVI has not been independently associated with outcome in all studies, and even patients with normal-flow LG-SAS seem to benefit from early AVR [11, 12]. It has been recognized that resting echocardiography alone may be insufficient to ascertain AS severity in some patients and additional imaging modality or stress echocardiography may be necessary [5, 24]. This suggests that patients with AS are best helped by integrating or combining an invasive and non-invasive information. Yet, in most centres, the valve is no longer crossed, and thermodilution is no longer performed. In this study, AVR was associated with improved survival also in catheter-derived MAS. This may suggest that even patients with less severe AS may benefit from early AVR before development of the low-flow phenotype [11, 22, 23].
Limitations
This study was retrospective with some potential bias. This may include the mode of selection of patients. The included patients were referred to our department to perform coronary angiography. In many cases, an echocardiography was performed elsewhere, and thus, detailed information is not available. This may have also led to the exclusion of severe patients unsuitable for AVR. In addition, the precise prevalence and outcome of LG-SAS may have been biased. Yet the prevalence of LG-SAS in this study (26%) is within ranges of prevalence reported in previous studies [11–12]. The patients were not randomized. Therefore, other factors—not necessarily accounted for in this multivariate analysis—that contributed to the treatment strategy could not be excluded. This study has other obvious limitations inherent to its retrospective character. However, standardized assessment of AS severity, LV ejection fraction and clinical outcome was systematically used during the study inclusion period. Thus, the retrospective nature of this study might not have substantially influenced the results. The invasive-derived assessment of AS severity, i.e. crossing of the aortic valve, may be associated with embolization leading to neurological deficits of 1.7–3% [28–29]. In this regard, the echocardiography-derived assessment may present a distinct advantage. Finally, frailty is a predictor of adverse outcome in elderly patients [30]. Yet it was not possible to retrieve this information in this retrospective study.
CONCLUSION
This study, using invasive assessment of AS severity and propensity score matching, confirms that in patients with severe AS, AVR improves survival regardless of the gradient or flow pattern. These findings are at the very least hypothesis generating and should be further explored in a randomized trial.
Conflict of interest: none declared.
