


Abstract
We evaluated the outcomes of patients who underwent extracardiac Fontan circulation procedures (ECFP) and received 16-mm polytetrafluoroethylene conduits.
From June 1997 to May 2015, among the 408 patients who underwent ECFP, 66 patients (Group S) also received 16-mm polytetrafluoroethylene conduits. To compare this patient cohort with similarly sized patients who received larger conduits, a matched cohort (66 patients, Group L) was selected according to age and body weight.
The mean age, body weight and Nakata index at ECFP in Groups S and L were 2.9 ± 1.2 and 3.1 ± 1.2 years (P = 0.243), 13.0 ± 2.4 and 13.0 ± 2.3 kg (P = 0.101), 175.3 ± 59.0 and 236.1 ± 75.1 mm2/m2 (P = 0.005), respectively. The mean follow-up periods for Groups S and L were 7.8 ± 6.0 and 9.1 ± 4.9 years (P = 0.150), respectively. The conduit size of Group L was 19.2 ± 1.4 mm (P < 0.001). There was no significant difference in mortality between the groups (P = 0.109). The freedom from reoperation was 94.0 ± 3.4% in Group S and 79.3 ± 5.7% in Group L after 10 years (P = 0.070). Late-occurring morbidities included protein-losing enteropathy (2 in Group S, 4 in Group L; P = 0.491) and thromboembolism (0 in Group S, 4 in Group L; P = 0.206). There was a significant difference in conduit-related events between the groups (1 in Group S, 5 in Group L; P = 0.031). In a paired cohort from the 2 groups including patients who were followed-up for more than 10 years (15 patients from each group), the body mass index was 51.0 ± 33.2% in Group S and 30.3 ± 34.2% in Group L. The decreases in the conduit cross-sectional areas for the paired patients in Group S (n = 20) and Group L (n = 20) were 14.9 ± 19.7% and 24.5 ± 15.5% (P = 0.076), respectively. Coarse liver parenchyma was detected in 9 of 23 (39.1%) patients from Group S and in 7 of 18 (38.8%) patients from Group L upon ultrasonography.
The 16-mm polytetrafluoroethylene conduit for ECFP showed acceptable outcomes and good haemodynamic status in small-sized patients. According to our results, small patients do not require large conduits to accommodate their growth potential.
INTRODUCTION
Most patients who receive treatment for functional single-ventricle lesions ultimately undergo the Fontan procedure. Since its introduction in 1971 [1], the extracardiac Fontan procedure (ECFP) has had some theoretical advantages over other types of Fontan procedures, such as optimized flow dynamics, a lower frequency of atrial arrhythmias and technical ease of the procedure. Many previous studies have proven that the ECFP also has flow dynamics advantages [2–4].
However, the fact that the artificial conduit lacks growth potential and is thrombogenic is a major concern. Moreover, at the time of the operation, the patient’s growth rate must be considered in the selection of conduit size, even if it means the selection of larger conduits. However, a larger size conduit could cause inefficient flow due to stagnation turbulence and may cause late-stage complications, i.e. thrombosis or stenosis [5]. Because a large conduit is difficult to use technically in small patients, it is recommended that ECFP should be delayed until patients weigh 15 kg or more to accommodate at least a 20-mm sized conduit [6]. The mean diameter of an adult inferior vena cava (IVC) is approximately 20 mm [7]. However, in some clinical situations, such as an increasing demonstration of cyanosis or a requirement for the early elimination of ventricular volume overloading, it is difficult to wait until an adult-sized conduit can be implanted.
In such a situation, physicians should consider the patient’s body weight, pericardial space, pulmonary artery (PA) size, IVC size, possible pulmonary vein compression and vessel geometry to select an appropriate conduit size. Recently, some reports have argued for the use of a 16-mm conduit in smaller sized patients because of less stagnation and pressure loss, which are frequently observed in larger conduits [8, 9]. Therefore, in those patients with small body size, careful consideration must be used when selecting an appropriate conduit size. We evaluated the outcomes of patients who underwent ECFP and received 16-mm polytetrafluoroethylene (PTFE) conduits.
MATERIALS AND METHODS
The Institutional Review Board approved this study and waived the need for patient consent. Between June 1997 and May 2015, among the 408 patients who underwent an ECFP at Seoul National University Children’s Hospital and Sejong General Hospital, 66 patients received an ECFP with a 16-mm PTFE conduit. To compare the outcomes among these patients, a matched cohort of similarly aged and sized patients (n = 66) who underwent ECFP and received larger conduits (18 mm, n = 34; 20 mm, n = 23 and 22 mm, n = 9) were selected. Table 1 presents the primary diagnoses of the patients.
Preoperative patient profiles
| PTFE conduit size | ≥18 mm (total) n = 342 | 16 mm (Group S) n = 66 | SD | P-value | ≥18 mm (Group L) n = 66 | SDa | P-valuea |
|---|---|---|---|---|---|---|---|
| Enrolment date | Jun 1997–May 2015 | Aug 1997–May 2015 | May 1998–Feb 2015 | ||||
| Mean age at ECFP (years) | 5.1 ± 6.6 | 2.9 ± 1.2 | −1.360 | 0.002 | 3.1 ± 1.2 | 0.027 | 0.243 |
| Mean body weight at ECFP (kg) | 17.14 ± 12.4 | 13.0 ± 2.4 | −1.701 | 0.008 | 13.0 ± 2.3 | 0.014 | 0.101 |
| Anatomic diagnosis | No. (%) | No. (%) | P-value | No. (%) | P-valuea | ||
| Isomerism | 82 (24.0) | 23 (34.8) | 0.064 | 14 (21.2) | 0.081 | ||
| Tricuspid atresia | 49 (14.3) | 7 (10.6) | 0.421 | 7 (10.6) | 1.0 | ||
| HLHS | 9 (2.6) | 6 (9.1) | 0.011 | 2 (3.0) | 0.145 | ||
| Pulmonary atresia with IVS | 24 (7.0) | 4 (6.1) | 0.778 | 6 (9.0) | 0.511 | ||
| DORV | 26 (7.6) | 4 (6.1) | 0.660 | 7 (6.0) | 0.345 | ||
| Congenitally corrected TGA | 32 (9.4) | 3 (4.5) | 0.201 | 5 (7.5) | 0.466 | ||
| Unbalanced AVSD | 33 (9.6) | 3 (4.5) | 0.181 | 6 (9.0) | 0.300 | ||
| Mitral atresia | 19 (5.6) | 3 (4.5) | 0.739 | 3 (4.5) | 1.0 | ||
| Criss-cross | 14 (4.1) | 3 (4.5) | 0.866 | 7 (10.6) | 0.188 | ||
| DILV | 16 (4.7) | 2 (3.0) | 0.551 | 2 (3.0) | 1.0 | ||
| DIRV | 16 (4.7) | 2 (3.0) | 0.551 | 4 (6.0) | 0.403 | ||
| Ebstein anomaly | 3 (0.9) | 1 (1.5) | 0.630 | 0 (0) | 0.315 | ||
| Others | 19 (5.6) | 5 (7.6) | 3 (4.5) | ||||
| Total | 342 | 66 | 66 | ||||
AVSD: atrioventricular septal defect; DILV: double-inlet left ventricle; DIRV: double-inlet right ventricle; DORV: double-outlet right ventricle; ECFP: extracardiac Fontan procedure; HLHS: hypoplastic left heart syndrome; IVS: intact ventricular septum; PTFE: polytetrafluoroethylene; SD: standardized difference; TGA: transposition of great arteries.
Comparison between Group S and Group L.
Surgical technique
Our ECFP surgical strategy and technique were reported previously [3]. We implanted a 16-mm PTFE conduit in the indicated patients who had low body weights and limited pericardial space to implant a large conduit. We considered a 16-mm PTFE conduit implantation in those with a small PA in terms of haemodynamics.
Eighty-five patients (47 in Group S and 38 in Group L) had received at least 1 operation before the bidirectional cavopulmonary shunt (BCPS) operation. The initial treatments for Groups S and L were a Blalock–Taussig shunt in 22 (46.8%) and 15 (39.5%) patients, pulmonary banding in 19 (40.4%) and 18 (47.3%) patients, coarctation of the aorta repair in 4 (8.5%) and 6 (15.8%) patients, Norwood Stage I in 4 (8.5%) and 4 (10.5%) patients, PA angioplasty in 2 (4.2%) and 1 (2.6%) patients, Damus–Kaye–Stansel procedure in 1 (2.1%) and 3 (7.9%) patients and total anomalous pulmonary venous return repair in 1 (2.1%) and 2 (5.3%) patients, respectively. Almost all of the patients had BCPS before the ECFP, except for 2 patients in Group L. Other pre-Fontan procedures in Groups S and L were as follows: atrial septectomy in 12 and 10 patients, PA angioplasty in 9 and 10 patients, atrioventricular valve repair in 3 and 1 patients, Damus–Kaye–Stansel procedure in 5 and 1 patients and total anomalous pulmonary venous return repair in 2 and 1 patients, respectively. Additionally, there were 2 Norwood procedures and 1 coarctation of aorta repair, both of which occurred in patients from Group S.
An expanded PTFE tube conduit (Gore-Tex vascular graft; W.L. Gore & Associates, Inc., Flagstaff, AZ, USA) was used during the ECFP. The combined procedures are presented in Table 2. Fenestration was required in 26 patients in Group S and 20 patients in Group L (39.4 vs 30.3%, P = 0.273, respectively). Fenestration was considered in patients with small or obstructive pulmonary arteries or elevated pulmonary vascular resistance. The decision to use fenestrations was made in the operating room after weaning the patient from cardiopulmonary bypass. The criteria for using fenestration were a pulmonary arterial pressure greater than 18 mmHg, a transpulmonary gradient greater than 10 mmHg or both. In cases where patients showed low cardiac output after Fontan completion, we added fenestration procedures.
Operative data
| Group S (n = 66) | Group L (n = 66) | P-value | |
|---|---|---|---|
| Mean interval time between BCPS and Fontan completion (years) | 2.2 ± 1.0 | 2.2 ± 0.9 | 0.893 |
| Mean graft size (mm) | 16 ± 0.0 | 19.2 ± 1.4 | 0.000 |
| Fenestration (%) | 26 (39.4%) | 20 (30.3%) | 0.273 |
| Concomitant procedure | |||
| Atrial septectomy | 5 | 3 | 0.466 |
| Pulmonary artery angioplasty | 5 | 10 | 0.170 |
| AV valve repair | 4 | 7 | 0.345 |
| Aortic valvuloplasty | 2 | 1 | 0.559 |
| TAPVR repair | 2 | 0 | 0.154 |
| Arrhythmia surgery | 1 | 0 | 0.315 |
| Pulmonary vein angioplasty | 0 | 2 | 0.559 |
BCPS: bidirectional cavopulmonary shunt; AV: atrioventricular; TAPVR: total anomalous pulmonary venous return.
Our policy is to maintain all patients on low-dose aspirin, but warfarin was used for the patients who had histories of thrombosis or mechanical valves [2, 3].
Cross-sectional area of conduit measurement
We also evaluated the cross-sectional area of the conduits, which was indexed by body surface area (square metre) to reflect body size.
Statistical analysis
Statistical analysis was performed using PASW 20 (IBM SPSS, Inc., Armonk, NY, USA). To compare the outcomes between the patients with a 16-mm PTFE conduit and the similarly sized patients with larger PTFE conduits (control group, n = 342), we performed one-to-one age and body weight matching using R (version 2.12.1, R Foundation for Statistical Computing, Vienna, Austria) plugin for SPSS. A logistic regression model was constructed using age and body weight to calculate the probability of group allocation.
The nearest neighbourhood method with a caliper of 0.2 was applied. Among the 342 patients in the control group, 66 were selected according to age and body weight matching. The initial control group patients (n = 342) had significantly higher age and body weight, but matched patients from the control group (Group L) had similar age and body weight compared with the patients who received 16-mm PTFE conduits (Group S) (Table 1).
Continuous data are reported as the mean ± standard deviation. Cumulative survival rates were calculated using Kaplan–Meier analysis, and survival curves were compared using the Cox proportional hazard regression adjusting standard errors to account for the intracluster dependence in matched data [10]. Time to thromboembolism was compared with a Cox model with Firth’s penalized likelihood method due to no events in Group S and convergence failures (Supplementary Material, Table S2) [11]. The differences between the paired patients in each group were assessed using a paired t-test. McNemar’s test was used to compare categorical data. The difference was considered statistically significant when the P-value was <0.05
RESULTS
Demographic results
The mean age and body weight of the patients from the 16-mm PTFE conduit (Group S) at the time of the ECFP were 2.9 ± 1.2 years and 13.0 ± 2.4 kg, respectively. Table 1 shows that patients who received ECFP with a 16-mm PTFE conduit were significantly younger and had a lower body weight than did patients who received an ECFP with a larger PTFE conduit (mean age: 5.1± 6.6 years, mean body weight: 17.14 ± 12.4 kg). For the patients with the larger conduit (Group L, n = 66), their mean age (3.1 ± 1.2 years) and body weight (13.0 ± 2.3 kg) were not significantly different from those of the patients who received the 16-mm PTFE conduits at the time of the Fontan operation when matched by age and body weight (Table 1).
Catheterization
The preoperative and last follow-up catheterization data, as well as a comparison between the groups, are presented in Table 3. The preoperative mean pulmonary arterial pressures of Groups S and L were 11.2 ± 2.9 and 11.7 ± 3.0 mmHg (P = 0.308), and the mean arterial oxygen saturation of Groups S and L were 84.1 ± 9.5 and 84.3 ± 4.8% (P = 0.846), respectively. The measured preoperative mean Nakata index of Group S was significantly lower than that of Group L (172.4 ± 65.1 vs 236.2 ± 68.1 mm2/m2, P = 0.005). To estimate the PA size, a mean Nakata index was calculated [12].
Preoperative and postoperative catheterization data
| Preoperative catheterization data | |||||||||
|---|---|---|---|---|---|---|---|---|---|
| Mean values of Groups S (n = 65) and L (n = 63) | Comparison of paired patients between the groups | ||||||||
| Group S | n | Group L | n | Group S | n | Group L | n | P-value | |
| PAP (mmHg) | 11.2 ± 2.9 | 65 | 11.7 ± 3.0 | 61 | 11.2 ± 2.9 | 61 | 11.7 ± 3.0 | 61 | 0.308 |
| VEDP (mmHg) | 9.0 ± 3.9 | 65 | 9.5 ± 2.9 | 29 | 8.3 ± 3.4 | 29 | 9.5 ± 3.0 | 29 | 0.174 |
| PVR (U/m2) | 1.5 ± 0.7 | 64 | 1.4 ± 0.6 | 59 | 1.5 ± 0.7 | 57 | 1.4 ± 0.6 | 57 | 0.683 |
| SaO2 (%) | 84.2 ± 9.3 | 65 | 84.4 ± 4.8 | 62 | 84.1 ± 9.5 | 62 | 84.3 ± 4.8 | 62 | 0.846 |
| Nakata index (mm2/m2) | 175.3 ± 59.0 | 44 | 236.1 ± 75.1 | 37 | 172.4 ± 65.1 | 25 | 236.2 ± 68.1 | 25 | 0.005 |
| Mean values of Groups S (n = 32) and L (n = 36) | Comparison of paired patients between the groups | ||||||||
| Mean interval after ECFP (years) | 9.7 ± 5.9 | 32 | 7.7 ± 4.4 | 36 | 10.3 ± 4.8 | 20 | 7.7 ± 4.7 | 20 | 0.110 |
| PAP (mmHg) | 13.9 ± 2.9 | 31 | 11.7 ± 3.6 | 34 | 13.4 ± 2.9 | 19 | 13.2 ± 2.9 | 19 | 0.757 |
| VEDP (mmHg) | 10.9 ± 3.6 | 29 | 10.0 ± 3.3 | 35 | 11.3 ± 3.6 | 18 | 10.4 ± 3.4 | 18 | 0.427 |
| PVR (U/m2) | 1.2 ± 0.9 | 26 | 1.0 ± 0.7 | 28 | 1.3 ± 1.1 | 14 | 1.1 ± 0.7 | 14 | 0.639 |
| SaO2 (%) | 94.5 ± 2.2 | 29 | 94.7 ± 2.3 | 35 | 94.2 ± 1.7 | 18 | 94.5 ± 2.3 | 18 | 0.606 |
| Intra-conduit pressure (mmHg) | 14.1 ± 3.1 | 26 | 14.0 ± 4.5 | 34 | 14.9 ± 3.5 | 17 | 15.0 ± 2.4 | 17 | 0.948 |
| IVC pressure (mmHg) | 14.2 ± 3.1 | 26 | 14.2 ± 4.7 | 34 | 14.8 ± 3.5 | 18 | 15.5 ± 2.6 | 18 | 0.690 |
PAP: pulmonary artery pressure; PVR: pulmonary vascular resistance; SaO2: arterial oxygen saturation; VEDP: ventricular end-diastolic pressure; IVC: inferior vena cava.
There were no significant differences at the last follow-up catheterization between Groups S and L. There were no differences in the IVC or intra-conduit pressure between Groups S and L (Table 4).
Comparison of mortality, morbidity and reoperation
| Group S (N = 66) | Group L (N = 66) | P-value | |
|---|---|---|---|
| Mean follow-up (years) | 7.8 ± 6.0 | 9.1 ± 4.9 | 0.150 |
| PLE | 2 | 4 | 0.491 |
| Thromboembolism | 0 | 4 | 0.206 |
| Reoperation | 4 | 11 | 0.070 |
| Conduit change | 1 | 2 | |
| Conduit thromboembolectomy | 0 | 1 | |
| AV valve repair | 1 | 2 | |
| AV valve replacement | 1 | 0 | |
| AVR | 1 | 0 | |
| Subaortic muscle resection | 0 | 1 | |
| Pulmonary artery angioplasty | 0 | 4 | |
| Pulmonary vein angioplasty | 1 | 1 | |
| Catheter intervention | 11 | 6 | 0.369 |
| Collateral vessels closure | 6 | 6 | |
| Balloon pulmonary angioplasty | 5 | ||
| Conduit-related events | 1 | 5 | 0.031 |
| Mortality | 1 | 6 | 0.109 |
| Early | 0 | 3 | |
| Late | 1 | 3 |
PLE: protein-losing enteropathy; AV: atrioventricular; AVR: aortic valve replacement.
Mortality, reoperation and catheter intervention
The mean follow-up durations for Groups S and L were 7.8 ± 6.0 and 9.1 ± 4.9 years (P = 0.150). One late mortality in Group S occurred due to recurrent pulmonary vein stenosis and heart failure 1 year after the procedure. There were 3 early mortalities and 3 late mortalities in Group L due to 3 cases of septic shock after mediastinitis and 3 heart failures after ECFP. There was no significant difference in mortality between the Groups (P = 0.109) (Fig. 1). There were 3 conduit exchanges among the 408 total patients. One patient in Group S, who was diagnosed with right isomerism, underwent an atrioventricular valve repair due to progressive valve regurgitation 16 years after the procedure and received a new conduit, although there was no conduit-related problem. Two patients (1 with right isomerism and the other with pulmonary atresia with intact ventricular septum) with an 18-mm PTFE conduit in Group L underwent conduit exchange due to conduit thrombosis and stenosis 2 months and 9 years after ECFP. One patient with a 22-mm PTFE conduit in Group L underwent pulmonary angioplasty and a Fontan conduit thrombectomy 1 month after ECFP. Reoperation was performed in 4 (6.1%) and 11 (16.7%) patients in Group S (conduit exchange and AV valve repair in 1 patient, AV valve replacement in 1 patient, aortic valve replacement in 1 patient and pulmonary vein angioplasty in 1 patient) and Group L (PA angioplasty in 4 patients, conduit exchange in 2 patients, AV valve repair in 2 patients, conduit thrombectomy in 1 patient, subaortic muscle resection in 1 patient and pulmonary vein angioplasty in 1 patient), respectively (Table 4). The frequencies of patients who did not require reoperation in Groups S and L were 94.0 ± 3.4% and 79.3 ± 5.7%, respectively, over 10 years, and there was no significant difference between the groups (P = 0.070) (Fig. 1). A catheter intervention was performed in 11 patients from Group S (collateral vessel closure in 6 and balloon pulmonary angioplasty in 5) and 6 patients in Group L (collateral vessel closure in 6) (Table 4). Freedom from catheter-based intervention was present for 89.3 ± 4.8% (Group S) and 93.3 ± 3.8% (Group L) over 10 years (P = 0.369), respectively (Fig. 1).
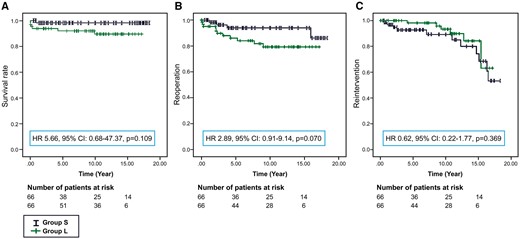
Estimated probability of freedom from mortality (A), reoperation (B) and catheter intervention (C). HR: hazard ratio; CI: confidence interval.
Cross-sectional conduit area
Thirty-seven patients in Group S and 39 patients in Group L underwent computed tomography angiography after the Fontan operation, and the mean interval between the Fontan procedure and follow-up computed tomography angiography was 9.0 ± 5.3 years in Group S and 7.7 ± 3.8 years in Group L.
The mean cross-sectional conduit area was 175.0 ± 38.1 mm2 in Group S and 236.2 ± 50.1 mm2 in Group L. The mean percent decrease in the conduit cross-sectional area of paired patients between the groups was not significantly different (Group S 14.9 ± 19.7%, Group L 24.5 ± 15.5%; P = 0.076). In addition, the indexed mean cross-sectional area of the conduits of paired patients between the groups was not significantly different (Group S 157.8 ± 79.1 mm2/m2, Group L 183.8 ± 75.8 mm2/m2; P = 0.292).
Somatic growth
There were 26 patients and 35 patients in Groups S and L, respectively, who had follow-up periods >10 years. Somatic development was evaluated according to body weight and standing height, which was related to the standard growth percentiles as described in previous reports [13, 14]. The mean patient age was 17.6 ± 2.7 and 15.8 ± 2.4 years at last follow-up in Groups S and L, respectively. The percentiles of weight, height and body mass index were as follows in Groups S and L: 42.2 ± 30.6 and 35.0 ± 33.2%, 38.9 ± 20.6 and 37.0 ± 27.3% and 46.9 ± 31 and 34.4 ± 34.7%, respectively. The comparisons of paired patients between the groups were not significantly different (Supplementary Material, Table S3). The results demonstrated a near-normal mean value of body mass index in Group S.
Liver examination
The results of the serum biochemical test in Group S (n = 20) and Group L (n = 25), including aspartate aminotransferase, alanine aminotransferase, gamma glutamyl transpeptidase, total bilirubin, platelet count and total cholesterol, as well as the results of liver ultrasonography in Groups S (n = 23) and L (n = 18), were reviewed in patients who had a follow-up period >10 years. The mean levels of gamma glutamyl transpeptidase of both groups were higher than normal range. The results are summarized in Supplementary Material, Table S1. Six patients with liver cirrhosis were detected in each group [Group S: 3 of 23 (13%), Group L: 3 of 18 (16.6%)], and coarse parenchyma was detected in 9 (39.1%) and 7 (38.3%) patients in Groups S and L, respectively, upon liver ultrasonography.
Other late complications and follow-up
Protein-losing enteropathy was observed in 2 patients from Group S and 4 patients from Group L (P = 0.491). Thromboembolism was observed in 4 patients in Group L only (P = 0.206). According to the standard 12-lead electrocardiogram obtained at the last outpatient visit, the basic cardiac rhythm was sinus rhythm for most patients in Group S (n = 62, 93.9%) and all patients in Group L. Cardiac resynchronization therapy was performed in 1 patient in Group S who had ventricular dys-synchrony. The evaluation of conduit-related events (conduit change and thromboembolism) between the groups was significantly different (Group S vs Group L:1 vs 5; P = 0.031) (Table 4, Fig. 2).
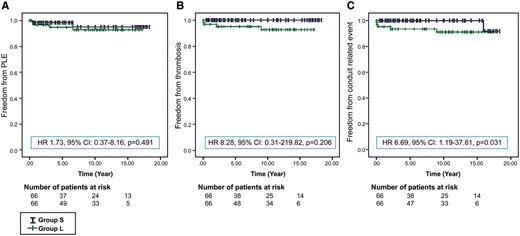
Estimated probability of freedom from protein-losing enteropathy (A), thrombosis (B) and conduit-related events (C). HR: hazard ratio; CI: confidence interval.
DISCUSSION
The ECFP has theoretical advantages over other modifications of the Fontan procedure, and excellent mid- and long-term results have been reported [3, 4, 15–17]. However, concerns remain regarding the longevity of the conduit and haemodynamic deterioration related to the lack of growth ability. When considering a patient’s somatic growth, a conduit size comparable to an adult’s IVC size is desirable. However, when a large conduit is applied to a small patient, some surgical modifications or technical aspects should be considered, because large conduits can compress the adjacent structures, such as pulmonary veins or atrium, also induce deterioration of the natural geometry of the PA. In addition, a large conduit may be haemodynamically undesirable. The mean diameter of an adult’s IVC is approximately 20 mm [7]. However, in some clinical situations, it is difficult to wait until an adult-sized conduit can be implanted. In these situations, we must be careful in selecting the conduit size based on the patient’s size, pericardial space, PA size and IVC size.
The geometry of the connection pathway for blood flow between the cavae and PAs was crucial for an energetically efficient Fontan operation, and energy degradation due to disparities in the cross-sectional flow area discourage the use of oversized conduits for ECFP. An oversized conduit, relative to the patient’s IVC size, can cause haemodynamic disturbances. Alexi-Meskishvili et al. [5] reported thrombus formation in extracardiac conduits due to oversized conduits. Ascuitto et al. [18] reported significant pressure losses in a situation in which the ‘magnitude’ of the fluid velocity was suddenly changed as the flow entered or left a large chamber or when the ‘direction’ of the fluid velocity is acutely altered as the flow negotiates a sharp bend in a vessel or conduit. Importantly, the corresponding pressure losses could be more problematic in an oversized conduit and could be significantly smaller and lead to more acutely angled pulmonary arteries in ECFP.
There have been several reports regarding Fontan haemodynamics based on a computational flow dynamic model. Some reports of the computational flow dynamic Fontan models have primarily discussed energy expenditure at the anastomosis site and pulmonary blood flow distribution [19–21]. Because the Fontan circulation is supposed to be a low-energy system without a ventricular power source, the flow stagnation and flow energy expenditure play essential roles. Itatani et al. [22] showed that larger conduits had both greater flow penetration, some of which was backflow from the superior vena cava into the conduit during the expiratory phase, and greater backflow in the lateral portion of the conduit. Furthermore, the penetrating flow and the backflow caused this stagnation. The stagnated region could be considered a high-risk area for thrombosis formation. According to the results of this study, a 16- or 18-mm conduit would be optimal from the perspective of flow stagnation.
The main problem concerning ECFP is the risk of late conduit obstruction. Amodeo et al. [23] reported a mean reduction in the internal conduit diameter of 18% during the first 6 months, with no further progression over the following 5 years. Lee et al. [2] reported that the mean percent decrease in the conduit cross-sectional area was 14.3 ± 8.5% (0.1–36.6%). There was no significant correlation between the percent decrease in the conduit and the follow-up duration. In this study, the mean percent decrease in the conduit cross-sectional area at the latest computed tomography was 12.9 ± 18.9% at a mean follow-up of 9.0 ± 5.3 years. There was no significant difference in the percent decrease between the groups. Additionally, there was no focal stenosis, and the laminar flow was well maintained in catheterized patients with a 16-mm PTFE. Furthermore, there were significant differences in the statistical analysis of conduit-related events (conduit change and thromboembolism) between the groups (P = 0.031). In our study, we thus concluded that the 16-mm conduit was not inferior to any larger conduit and that it was potentially superior (P = 0.031) not only for late conduit stenosis or obstruction but also for haemodynamics. This result probably occurred due to insignificant pressure losses, stagnation and haemodynamic disturbances, as described above.
The early elimination of cyanosis and volume overload in the functional single ventricle seems to be beneficial for smaller patients who probably need implantation with a smaller size conduit. However, whether these modifications provide better somatic development is unknown. Ono et al. [24] reported that patients with a single functional ventricle showed a deceleration of weight and height gain before the Fontan operation, whereas catch-up growth occurred in both weight and height during long-term follow-up. Weight, height and body mass index reached the 47.2 ± 35.6, 37.9 ± 30.4 and 41.6 ± 31.2 percentiles at their last report (mean follow-up 11.8 ± 4.2 years). The weight, height and body mass indexes of the 26 patients who were followed-up for >10 years in Group S reached 42.2 ± 30.6%, 38.9 ± 20.6% and 46.9 ± 31%, respectively (mean follow-up 14.5 ± 2.9 years). In addition, the weight, height and body mass indexes of the 14 patients who were adults (>18 years of age; mean age: 19.6 ± 1.2 years) at last follow-up in Group S reached 43.3 ± 33.1%, 40.3 ± 19.0% and 47.8 ± 33.01% for weight, height and body mass index, respectively. Similar to previous studies, height was more impaired than weight after the Fontan procedure [13, 14]. However, of the 2 patients in Group S and 4 patients in Group L who experienced protein-losing enteropathy, 1 patient in Group S and 3 patients in Group L showed no catch-up growth and remained below the 5th percentile for both weight and height during the follow-up period. Further studies with a longer follow-up period will be needed to confirm good adaptation in a cohort of adult-sized patients.
Recently, liver complications, including fibrosis, cirrhosis and carcinoma, were increasingly reported in post-Fontan patients [25, 26]. In the present study, when focusing on patients with a follow-up time of >10 years, the results of most routine liver biochemical tests were within the reference ranges. However, liver ultrasonography revealed liver cirrhosis and coarse parenchyma, which may reflect fibrotic progression in the liver in both groups. The diagnosis and degree of progression of liver fibrosis were difficult to determine because the abnormal findings on liver ultrasonography did not necessarily correlate with the serum levels of liver fibrosis markers. Our results were superior or similar to previous reports regarding the largest series of ECFP patients, which showed elevated serum markers of hepatic fibrosis in a substantial number of patients and hyperechoic spots in 42.3% of patients who were evaluated by liver ultrasonography [4]. However, we suggested that the hepatic conditions of patients who received the Fontan procedure be evaluated regularly.
Limitations
This study had several limitations, most of which stemmed from the study’s retrospective and observational nature. In addition, matched pairs using just age and weight might not be able to fully eliminate selection bias to explain the outcome variability. Computerized tomography and angiography were not performed in all patients during the follow-up period. This approach could have introduced selection bias in the group that underwent these investigations. Thromboembolic events appeared to have been based on clinically evident events or were detected in follow-up examinations, so some asymptomatic conduits or pulmonary thrombi may have been missed in patients who did not receive follow-up examinations. Further studies should be done with an exact liver evaluation by biopsy or FibroScan.
CONCLUSION
In conclusion, the 16-mm PTFE conduit is feasible for small-sized patients during the ECFP, and this approach has good outcomes regarding low mortality and morbidity rates and proper somatic growth. According to our results, we will continue applying 16-mm conduits for small patients rather than using larger sized conduits. However, the development of liver disease should be carefully monitored.
SUPPLEMENTARY MATERIAL
Supplementary material is available at EJCTS online.
Conflict of interest: none declared.
