


Abstract
Our goal was to compare the results and outcomes of second-stage completion in patients who had previously undergone the elephant trunk (ET) or the frozen elephant trunk (FET) procedure for the treatment of complex aortic arch and descending aortic disease.
Between August 2001 and December 2014, 53 patients [mean age 61 ± 13 years, 64% (n = 34) male] underwent a second-stage completion procedure. Of these patients, 32% (n = 17) had a previous ET procedure and 68% (n = 36) a previous FET procedure as a first-stage procedure.
The median times to the second-stage procedure were 7 (0–78) months in the ET group and 8 (0–66) months in the FET group. The second-stage procedure included thoracic endovascular aortic repair in 53% (n = 28) of patients and open surgical repair in 47% (n = 25). More endovascular interventions were performed in FET patients (61%, n = 22) than in the ET group (35%, n = 6, P = 0.117). The in-hospital mortality rate was significantly lower in the FET (8%, n = 3) group compared with the ET group (29%, n = 5, P = 0.045). The median follow-up time after the second-stage operation for the entire cohort was 4.6 (0.4–10.4) years. The 5-year survival rate was 76% in the ET patients versus 89% in the FET patients (log-rank: P = 0.11).
We observed a significantly lower in-hospital mortality rate in the FET group compared to the ET group. This result might be explained by the higher rate of endovascular completion in the FET group. We assume that the FET procedure offers the benefit of a more ideal landing zone, thus facilitating endovascular completion.
INTRODUCTION
The treatment of complex aortic diseases involving the aortic arch and the descending aorta still represents a surgical challenge. A multistage approach was, and still is, often necessary to replace extensive diseased areas of the thoracic aorta [1]. The first operation often involves replacement of the aortic arch via a median sternotomy. The introduction of the elephant trunk (ET) technique by Borst and colleagues helped to facilitate the second-stage intervention of the descending aorta, which was then performed via a lateral thoracic or thoraco-abdominal approach [2, 3]. After endovascular stent graft prostheses became available, the 2 technologies were combined, resulting in the frozen elephant trunk (FET) procedure [4, 5].
Due to progression of the primary aortic disease or a complication of the first procedure (including aneurysm, new aortic dissection, aortic rupture, aorto-oesophageal/bronchial fistula and malperfusion), some patients may require a second-stage aortic completion procedure. This intervention can be performed through a thoracic endovascular aortic repair (TEVAR) or open aortic surgery to achieve thoracic or thoraco-abdominal aortic replacement [6].
Despite the potential advantages at the time of the second-stage intervention of the FET technique over the conventional ET procedure [7–9], to our knowledge, no study in the current literature compares these 2 techniques. Some studies focus exclusively on the ET procedure and second-stage completion with both open and endoluminal repair [6, 10], open repair only [7, 11] or endovascular repair only [12]. Others describe their experience with the FET procedure and the second-stage repair with endovascular [13] or both endovascular and open repair [14].
Therefore, we designed this study to evaluate and compare the results and outcomes of second-stage aortic procedures after previous surgical replacement of the aortic arch and proximal descending aorta with the classical ET versus the FET procedure.
METHODS
Study design and general surgical considerations
We set up a retrospective clinical study with prospective follow-up. The study was in line with our hospital’s ethics policy. Our institution’s database was used to identify patients who received total aortic arch replacement. From August 2001 to December 2014, a total of 305 patients underwent total aortic arch replacement in our institution. More detailed information on the whole cohort that underwent aortic arch replacement can be found in a previous publication of our group [8]. Of these 305 patients, 97 cases were treated using the classical ET procedure and 208 subjects underwent surgery with the FET technique. A total of 53 (17%) patients required second-stage aortic completion. Only distal completions immediately extending the previous ET or FET prostheses were included (e.g. infrarenal aortic replacement or a similar procedure was not included). Of these 53 patients, 17 (32%) had received an ET prosthesis previously and 36 (68%) patients, an FET prosthesis. In the ET group, 53% (n = 9) patients already had an indication for distal aortic intervention and a second-stage operation was already planned. In the FET group, this proportion was 33% (n = 12). The preoperative patient demographics at the time of the first operation are presented in Table 1.
Patient demographics at first operation
| Entire cohort (n = 53) | ET group (n = 17) | FET group (n = 36) | P-value | |
|---|---|---|---|---|
| Characteristic | ||||
| Age (years) | 59 ± 13 | 60 ± 12 | 59 ± 13 | 0.802 |
| Male (n, %) | 34 (64%) | 8 (47%) | 26 (72%) | 0.075 |
| Weight (kg) | 83 ± 19 | 75 ± 12 | 85 ± 20 | 0.064 |
| Height (cm) | 175 ± 11 | 175 ± 10 | 175 ± 11 | 0.967 |
| Body mass index (kg/m2) | 27 ± 6 | 25 ± 3 | 28 ± 6 | 0.041 |
| Marfan syndrome (n, %) | 11 (21) | 5 (29) | 6 (17) | 0.286 |
| Previous cardiac operation (n, %) | 19 (36) | 4 (23) | 15 (42) | 0.199 |
| Cause for firstoperation | ||||
| Acute type A dissection (n, %) | 9 (17) | 4 (23) | 5 (14) | 0.383 |
| Chronic type A dissection (n, %) | 5 (9) | 0 (0) | 5 (14) | 0.106 |
| Prosthesis infection (n, %) | 1 (2) | 1 (6) | 0 (0) | 0.142 |
| Thoracic aortic aneurysm (n, %) | 38 (72) | 12 (71) | 26 (72) | 0.902 |
| Extent of thoracic aneurysm | ||||
| Aortic root (n, %) | 9 (17) | 2 (12) | 7 (19) | 0.487 |
| Ascending aorta (n, %) | 33 (62) | 12 (71) | 21 (59) | 0.390 |
| Aortic arch (n, %) | 38 (72) | 12 (71) | 26 (72) | 0.902 |
| Descending aorta (n, %) | 27 (51) | 9 (53) | 18 (50) | 0.842 |
| Thoraco-abdominal aorta (n, %) | 14 (26) | 4 (24) | 10 (28) | 0.743 |
| Suprarenal aorta (n, %) | 11 (21) | 4 (24) | 7 (19) | 0.732 |
| Infrarenal aorta (n, %) | 9 (17) | 4 (24) | 5 (14) | 0.383 |
A significance level of P < 0.05 was considered statistically significant and is highlighted in bold.
ET: elephant trunk; FET: frozen elephant trunk.
Traditionally, in the case of complex aortic disease involving the aortic arch and the descending aorta, patients received a conventional ET prosthesis. After the FET technique became available, we gradually moved towards this technique. More recently, we routinely implant an FET prosthesis.
Endovascular aortic repair
The endoluminal stent grafting technique used in our hospital has been described before [14]. The procedure was performed with the patient under general anaesthesia in the angiography suite. Arterial access was established via a small transverse inguinal skin incision and a transverse arteriotomy following the application of heparin and clamping the common femoral artery. A sheath was introduced via the arteriotomy, and a hydrophilic guidewire (Terumo, Tokyo, Japan) was introduced retrogradely to enter the aortic arch. The wire was exchanged for an Amplatz guide over a pigtail catheter after angiographic verification of the correct position. The sheath was removed, and the stent graft prosthesis was deployed after it was positioned under fluoroscopic observation. We used endovascular stent grafts from Medtronic (Ireland) or Gore (Newark, DE, USA). Sufficient overlap of the aortic arch prosthesis and the stent graft prosthesis was ensured.
Open thoracic or thoraco-abdominal repair
A detailed report of our institution’s open thoracic repair technique can be found in previous publications [14]. In brief, cerebrospinal fluid was drained the day before the operation. Extracorporeal circulation was established via femorofemoral access, and the patients were cooled to 32°C. A lateral thoracotomy was used to isolate the descending aortic replacement, and a thoraco-laparotomy with diaphragmatic detachment and retroperitoneal dissection was used for thoraco-abdominal aortic replacement. After distal and proximal clamping, the aorta was replaced with a Dacron graft prosthesis (Unigraft, Braun, Melsungen, Germany or Hemashield, Marlborough, MA, USA). Even in patients with a previously implanted FET, it is possible to clamp the aorta. Intercostal arteries were reimplanted depending on the size and backflow. In the case of thoraco-abdominal repair, the aorta was replaced in a staged fashion, and the visceral/renal arteries were reimplanted via islands or individual anastomoses. Perfusion of the visceral and renal arteries was ensured. The incision was closed in the standard fashion. After the operation, patients were transferred to our intensive care unit.
Follow-up
Individual consent was obtained from patients to allow for follow-up examinations. Follow-up was done according to common guidelines [15]. We performed follow-up examinations after the first and second interventions. Patients were scheduled for regular appointments in our outpatient clinic. Follow-up imaging with computed tomography angiography or magnetic resonance angiography were scheduled at 3 months after the operation and annually thereafter. In addition, primary care physicians and cardiologists were contacted, and examination results with echocardiography data were obtained. The follow-up after the first procedure was 100% complete.
Statistical analysis
Data analysis was performed using SPSS 22 Statistics software (IBM, Herrenberg, Germany). Normal distribution of variables was analysed with the Kolmogorov–Smirnov test. Normally distributed continuous variables were represented as mean ± standard deviation, whereas continuous variables without normal distribution were represented as median + range. Categorical variables were given as absolute numbers and proportions. Differences in categorical variables were analysed using the Fisher’s exact test due to the sample size. Kaplan–Meier analysis was used for evaluation of survival, and the log-rank test was used to test for differences. P-value <0.05 was considered statistically significant.
RESULTS
First-stage operation
We identified 53 patients with previous total aortic arch replacement who underwent second-stage aortic completion. For reference, the preoperative patient characteristics at the time of the first-stage operation are presented in Table 1. Most demographic variables were distributed evenly among the 2 groups. The operative and early postoperative data are presented in Tables 2 and 3, respectively. Of note, the early postoperative stroke rate was significantly higher in patients who underwent the ET procedure than in those who received an FET prosthesis.
Operative data at the first operation
| Entire cohort (n = 53) | ET group (n = 17) | FET group (n = 36) | P-value | |
|---|---|---|---|---|
| Operative data | ||||
| Operation time (min) | 346 ± 88 | 324 ± 94 | 356 ± 84 | 0.224 |
| Cardiopulmonary bypass time | 224 ± 67 | 217 ± 83 | 227 ± 60 | 0.619 |
| Cross-clamp time | 124 ± 56 | 121 ± 50 | 125 ± 59 | 0.792 |
| Circulatory arrest time | 56 ± 24 | 53 ± 29 | 57 ± 22 | 0.509 |
| Concomitant procedures | ||||
| Supracoronary replacement (n, %) | 24 (45) | 8 (47) | 16 (44) | 0.697 |
| Supracoronary and aortic valve replacement (n, %) | 2 (4) | 1 (6) | 1 (3) | 0.580 |
| Bentall procedure (n, %) | 11 (21) | 5 (29) | 6 (17) | 0.286 |
| Root reconstruction (n, %) | 9 (17) | 3 (18) | 6 (17) | 0.929 |
| Coronary bypass grafting (n, %) | 10 (19) | 2 (12) | 8 (22) | 0.364 |
| Mitral valve replacement (n, %) | 2 (4) | 0 (0) | 2 (6) | 0.322 |
ET: elephant trunk; FET: frozen elephant trunk.
Postoperative outcome of the first operation
| Characteristic | Entire cohort (n = 53) | ET group (n = 17) | FET group (n = 36) | P-value |
|---|---|---|---|---|
| Intensive care unit stay (days) | 8 (1–41) | 2 (1–26) | 5 (1–41) | 0.281 |
| Hospital stay (days) | 19 ± 12 | 17 ± 10 | 20 ± 13 | 0.647 |
| Rethoracotomy (n, %) | 11 (21) | 3 (17) | 8 (22) | 0.701 |
| Dialysis (n, %) | 4 (8) | 2 (12) | 2 (6) | 0.424 |
| Stroke (n, %) | 2 (4) | 2 (12) | 0 (0) | 0.036 |
| Paraplegia (n, %) | 1 (2) | 1 (6) | 0 (0) | 0.142 |
A significance level of P < 0.05 was considered statistically significant and is highlighted in bold.
ET: elephant trunk; FET: frozen elephant trunk.
Patient characteristics at and indications for second-stage intervention
The mean age of all patients at the time of second-stage completion was 61 ± 13 years (Table 4). Most demographic variables were distributed evenly between the 2 groups. However, the glomerular filtration rate was significantly higher in the FET (98 ± 51 ml/min) group compared with the ET group (70 ± 32, P = 0.043).
Preoperative patient demographics at the second intervention
| Characteristic | Entire cohort (n = 53) | ET group (n = 17) | FET group (n = 36) | P-value |
|---|---|---|---|---|
| Age (years) | 61 ± 13 | 61 ± 12 | 61 ± 14 | 0.895 |
| Weight (kg) | 79 ± 15 | 75 ± 12 | 82 ± 16 | 0.101 |
| BMI (kg/m2) | 27 ± 10 | 24 ± 3 | 27 ± 5 | 0.055 |
| COPD (n, %) | 6 (11) | 3 (18) | 3 (8%) | 0.318 |
| FEV1 in % | 71 ± 15 | 68 ± 17 | 73 ± 14 | 0.387 |
| Nicotine (n, %) | 4 (8) | 1 (6) | 3 (8) | 0.753 |
| Diabetes (n, %) | 4 (8) | 2 (12) | 2 (6) | 0.424 |
| Renal failure (n, %) | 4 (8) | 2 (12) | 2 (6) | 0.424 |
| Creatinine (µmol/l) | 96 ± 60 | 113 ± 59 | 96 ± 61 | 0.349 |
| eGFR (ml/min) | 96 ± 48 | 70 ± 32 | 98 ± 51 | 0.043 |
| NYHA Class (n, %) | ||||
| I | 6 (11) | 1 (6) | 5 (14) | 0.391 |
| II | 37 (70) | 12 (71) | 25 (69) | 0.933 |
| III | 9 (17) | 4 (24) | 5 (14) | 0.383 |
| IV | 1 (2) | 0 (0) | 1 (3) | 0.322 |
A significance level of P < 0.05 was considered statistically significant and is highlighted in bold.
ET: elephant trunk; FET: frozen elephant trunk; BMI: body mass index; COPD: chronic obstructive pulmonary disease; FEV1: forced expiratory volume in 1 s; eGFR: estimated glomerular filtration rate; NYHA: New York Heart Association.
The median time to the second-stage intervention was 7 (0–78) months for the entire cohort (Table 5). The median time to intervention of patients with a planned second-stage procedure was 118 (9–1271) days in the ET group and 61 (1–1408) days in the FET group (P = 0.848). The primary indication for surgery was distal aortic aneurysmal progression (74%). There were more aortic ruptures in patients who underwent a previous ET procedure (24%, n = 4) compared to patients who received an FET prosthesis (3%, n = 1) previously (P = 0.016). Other indications for surgery included aortic fistula, aortic dissection and malperfusion.
Operative data at the second intervention
| Characteristic | Entire cohort (n = 53) | ET group (n = 17) | FET group (n = 36) | P-value |
|---|---|---|---|---|
| Time to second intervention (months) | 7 (0–78) | 7 (0–78) | 8 (0–66) | 0.646 |
| Cause for second intervention | ||||
| Aneurysm of thoracic aorta (n, %) | 39 (74) | 11 (65) | 28 (78) | 0.314 |
| Aortic rupture (n, %) | 5 (9) | 4 (24) | 1 (3) | 0.016 |
| Fistula (n, %) | 5 (9) | 1 (6) | 4 (11) | 0.543 |
| Aortic dissection (n, %) | 3 (6) | 1 (6) | 2 (6) | 0.962 |
| Malperfusion (n, %) | 1 (2) | 0 (0) | 1 (3) | 0.488 |
| Type of second intervention | ||||
| TEVAR (n, %) | 28 (53) | 6 (35) | 22 (61) | 0.117 |
| Descending aortic replacement (n, %) | 8 (15) | 6 (35) | 2 (6) | 0.005 |
| Thoraco-abdominal aortic replacement (n, %) | 17 (32) | 5 (30) | 12 (33) | 0.888 |
| Operation time (min) | 210 ± 140 | 272 ± 128 | 180 ± 138 | 0.025 |
| Blood transfusions (units) | (0–40) | 6 (0–30) | 1 (0–40) | 0.170 |
| Fresh frozen plasma (units) | (0–36) | 6 (0–18) | 0 (0–36) | 0.245 |
| Thrombocyte transfusions (units) | (0–6) | 6 (0–5) | 0 (0–6) | 0.332 |
A significance level of P < 0.05 was considered statistically significant and is highlighted in bold.
ET: elephant trunk; FET: frozen elephant trunk; TEVAR: thoracic endovascular aortic repair.
Perioperative outcome at the second-stage intervention
In the entire cohort, 53% (n = 28) of patients were treated with endoluminal stent graft placement, whereas 47% (n = 25) underwent open repair (Table 5). More endovascular interventions were performed in patients who had the FET procedure (61%, n = 22), whereas more open repairs (65%, n = 11) were performed in those who had the ET procedure. The proportion of descending aortic replacements was significantly higher in the ET group (35%, n = 6) than in the FET group (6%, n = 2, P = 0.005). Of note, in patients who had the FET procedure, open descending aortic replacement can be easily performed in patients with a hybrid prosthesis, and the anastomosis between the stent graft and the Dacron prosthesis could be performed safely (Fig. 1).
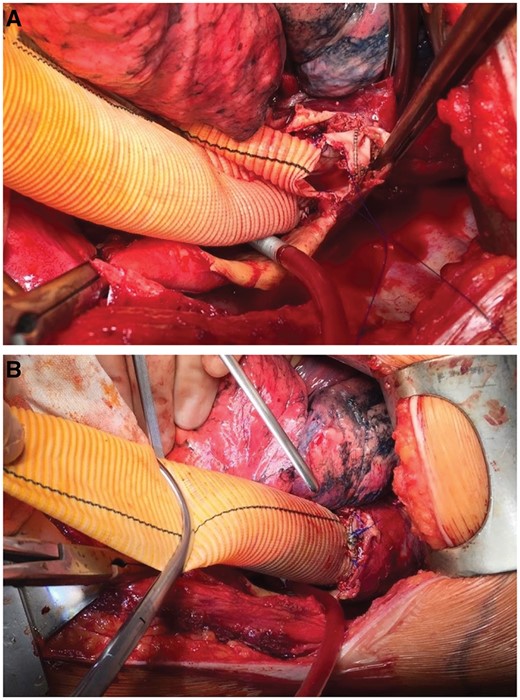
Open surgical extension of a frozen elephant trunk with a Dacron graft prosthesis. (A) The distal part of a Vascutek Thoraflex hybrid prosthesis is shown. We usually remove the last stent ring to facilitate the anastomosis. (B) The anastomosis between the stent graft portion and a straight-tube Dacron graft is shown.
The mean operation time was significantly lower in patients who had previously had an FET procedure (180 ± 138 min) compared to those who had previously had an ET procedure (272 ± 128 min, P = 0.025). The postoperative outcomes after the second-stage intervention are presented in Table 6. The median serum creatinine level was significantly lower in patients having the FET procedure (84 µmol/l) than in those having the ET procedure (138 µmol/l, P = 0.032). The in-hospital mortality rate was significantly lower in patients who underwent FET procedure (8%, n = 3) at the initial operation compared to patients with a previous ET procedure (29%, n =5, P = 0.045). Because the proportion of endovascular repairs was higher in the FET group, we also compared the in-hospital mortality rate of all patients with endovascular treatment with those who received open repair. The mortality rate was 7% (n = 2) in patients who had TEVAR and 24% (n = 6) in patients with open surgical repair (P = 0.087).
Postoperative outcome of the second intervention
| Characteristic | Entire cohort (n = 53) | ET group (n = 17) | FET group (n = 36) | P-value |
|---|---|---|---|---|
| Prolonged ventilation (n, %) | 8 (15) | 2 (12) | 6 (17) | 0.642 |
| ICU stay (days) | 3 (0–226) | 4 (0–20) | 2 (0–226) | 0.360 |
| Hospital stay (days) | 12 (0–226) | 16 (0–42) | 11 (1–226) | 0.532 |
| In-hospital mortality rate (n, %) | 8 (15) | 5 (29) | 3 (8) | 0.045 |
| Lactate (mmol/l) | 1.9 | 2.2 (1.0–13.3) | 1.5 (0.6–15.0) | 0.349 |
| AST (U/l) | 54 (14–11 093) | 45 (18–3043) | 57 (14–11 093) | 0.531 |
| Creatinine (µmol/l) | 96 (43–559) | 138 (80–559) | 84 (43–363) | 0.032 |
| Acute kidney failure (n, %) | 18 (34) | 5 (29) | 13 (36) | 0.631 |
| Dialysis (n, %) | 6 (11) | 1 (6) | 5 (14) | 0.391 |
| Stroke (n, %) | 0 (0) | 0 (0) | 0 (0) | |
| Paraplegia (n, %) | 3 (6) | 2 (12) | 1 (3) | 0.186 |
| ECMO (n, %) | 0 (0) | 0 (0) | 0 (0) |
ET: elephant trunk; FET: frozen elephant trunk; AST: aspartate transaminase; ICU: intensive care unit; ECMO: extracorporeal membrane oxygenation.
All of the 5 patients in the ET group who died underwent open repair during the second-stage completion. The causes of death of these 5 patients were as follows: 1 patient died intraoperatively of massive, unstoppable bleeding. Another patient had an intraoperative myocardial infarction due to coronary artery disease and died intraoperatively. One patient underwent the second-stage aortic completion. Although the procedure went well, the patient developed a wound infection and died of septic multiorgan failure on postoperative Day 53. One patient had an uneventful second-stage operation but developed septic multiorgan failure and died on postoperative Day 20. One patient required renal replacement therapy due to acute kidney failure and developed malignant cardiac arrhythmia due to electrolyte imbalances during dialysis. This patient died on postoperative Day 31.
The 3 patients in the FET group who died of septic multiorgan failure died on postoperative Day 7, 18 and 366, respectively. The third patient underwent the second-stage aortic completion because of an aortopulmonary fistula. Although the second-stage completion procedure went well, the patient had an oesophageal perforation and septicaemia postoperatively.
Follow-up
The completion rate for our follow-up examinations after the second-stage intervention was 100%. The median follow-up time for the entire cohort was 3.9 (0.0–10.4) years. The Kaplan–Meier survival curves of all patients are shown in Fig. 2. The 5-year survival rate was 76% in the patients who had the ET procedure versus 89% in those who had the FET procedure (log-rank: P = 0.11). There were 4 events in the ET group and 4 events in the FET group. The mean survival rates were 7.5 (95% confidence interval: 5.3–9.6) years in the ET group and 8.7 (95% confidence interval: 7.7–9.7) years in the FET group.
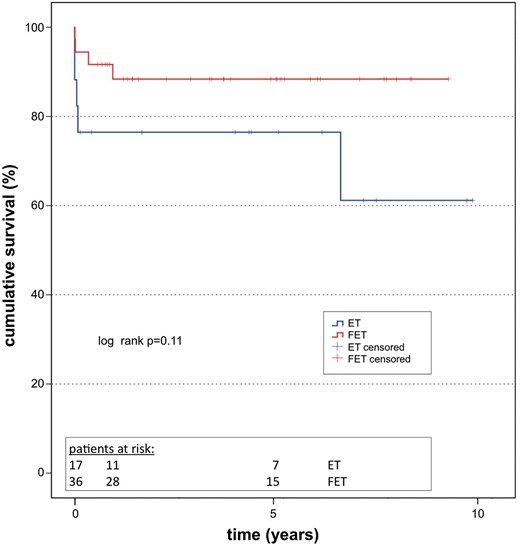
Survival. Kaplan–Meier survival curve including all patients after discharge (log rank: P = 0.652). ET: elephant trunk; FET: frozen elephant trunk.
DISCUSSION
The treatment of complex diseases of the thoracic aorta remains a surgical challenge. Despite the introduction of the FET procedure, which has the potential benefit of treating diseases of the aortic arch and the proximal descending aorta in a single step, many other aortic diseases remain that require a second-stage intervention. In these cases, it has not been clear whether the FET procedure offers any benefit over the conventional method, as far as the potential for doing away with the second-stage procedure is concerned.
First-stage operation
The first-stage operation is not the primary focus of this study. More detailed information on the first operation can be found in a previous publication by our group [8]. Regarding the first operation on the aortic arch, one disadvantage of the FET technique is its potentially higher risk of spinal cord injury due to occlusion of the intercostal arteries [16]. However, in our series, we observed no paraplegic event in the FET group, but we did have 1 incident in the ET group. We think that the use of a relatively short stent graft part can significantly reduce the risk of spinal cord injury when implanting a hybrid prosthesis.
Another criticism of the FET procedure is the potential risk of postoperative renal failure. In our study, the need for postoperative dialysis was actually higher in the patients who had the ET procedure than in those who received an FET prosthesis. Nonetheless, this difference was not statistically significant.
Interval to the second-stage intervention
The classical ET technique was designed to facilitate second-stage repair. The proportion of patients undergoing second-stage repair after the initial total arch replacement with the ET technique ranges from 12% [12] to 22% [7] to 45% [10] to 55% [6]. The FET technique has the potential to treat complex diseases in one operation, thereby decreasing the proportion of patients who need the second-stage intervention. Indeed, the available studies in the literature report a completion rate after previous FET implantation of 4% [13] to 15% [14]. In this study, the completion rate was 17%. Both the preoperative patient demographics and the indications for second-stage completion were distributed relatively evenly between the 2 groups. However, the group that had the ET procedure had more patients who presented with contained aortic rupture. The mean time to the second-stage repair was 7 months for the entire cohort and did not differ significantly between the 2 subgroups. The interval between the first- and the second-stage intervention ranged from 3.1 to 48 months in the literature [7, 10, 12, 13]. However, each of these series contained a great variability in the interval time, ranging from 19 days to nearly 18 years. We also noted this variability in our series. Although 1 patient required immediate aortic completion on the same day, the longest interval in our study was 6.5 years (78 months). This wide range is probably due to the fact that some patients already have an indication for second-stage repair at the time of the first operation, whereas other patients develop distal aortic diseases over time. Patients who already have an indication for a second-stage intervention should be treated as soon as possible after the first procedure to reduce the risk of aortic rupture [17]. The great range of the interval period, especially of the cases who require second-stage comletion after many years or even decades, leads us to the conclusion that regular, lifelong imaging follow-up is mandatory.
Aortic arch prosthesis and the second intervention
Although both the ET and the FET procedures basically require the same surgical effort and harbour the same degree of risk at the initial operation, we have observed a significantly lower in-hospital mortality rate in the group having the FET procedure. We acknowledge that the prosthesis itself probably does not affect the second-stage operation. However, the use of an FET prosthesis provides a more ideal landing zone, and we assume that this facilitates endovascular repair at the time of the second-stage completion. This observation is documented by the higher—although not significantly higher—proportion of patients having TEVAR in the group having the FET procedure.
The ET technique is still widely used in many centres. Roselli and colleagues analysed whether there is a difference between open and endovascular completion after the initial classical ET procedure [6]. In their study, they found no difference in early postoperative mortality rates between the 2 groups. We think that open repair can be performed with good results in the hands of an experienced surgeon, but open repair still contains a higher risk profile than endovascular repair.
Castrovinci et al. reported a series of patients who initially underwent the classical ET procedure [10]. At the time of the second-stage repair, the perioperative mortality rate was 9% among patients who received open repair as a second stage and 4% in those who underwent endovascular treatment. The authors claim that this outcome warrants the use of the classical ET technique. The overall in-hospital mortality rate in our series was slightly higher, but we confirmed a lower mortality rate in patients who had TEVAR (7%) compared to those who had an open repair (24%). However, this difference was not statistically significant. Further, the mean operation time was significantly shorter in the FET group, which can be explained by the more frequent use of TEVAR. On the basis of these results, we concluded that open repair is actually riskier than endoluminal treatment and that FET can help to lower the mortality rate at the second-stage intervention by facilitating the use of endovascular techniques.
Limitations
One limitation of this study is its retrospective character. Further, there might be selection bias, because there was no random assignment to the 2 groups but individual selection of the prosthesis by the surgeon performing the operation. Further, the sample size of the study is relatively small. Also, we acknowledge that the findings and conclusions of this study might suffer from selection bias, since we did not analyse all 305 patients who underwent an initial aortic arch operation but only those who received the second-stage completion. Future studies should address this question.
CONCLUSION
We observed a significantly lower in-hospital mortality rate during the second-stage completion procedure in patients who had the FET procedure compared to those who had the ET procedure. This difference might be explained by the higher rate of endovascular completion in those having the FET procedure. We assume that the FET procedure offers the benefit of a more ideal landing zone, thus facilitating endovascular completion.
Funding
This work was supported by departmental grants.
Conflictof interest: none declared.
REFERENCES
Author notes
Presented at the 30th Annual Meeting of the European Association for Cardio-Thoracic Surgery, Barcelona, Spain, 1–5 October 2016.
The first two authors contributed equally.
