


Abstract
Nodal upstaging is a quality indicator for oncological thoracic surgery and is found in up to 25% of patients with clinical stage I (cStage-I) non-small-cell lung cancer (NSCLC). In large retrospective series, lower N1 upstaging was reported after video-assisted thoracic surgery (VATS) resections. We studied the impact of central primary tumour location on nodal upstaging in cStage-I NSCLC.
Consecutive patients operated for cStage-I NSCLC were selected from a prospectively managed surgical database. Tumour location was classified as central if the lesion was visible during standard video bronchoscopy. A nodal station mapping was drawn for each patient based on final pathological examination. Univariable and additive multivariable binary logistic regression analyses were performed.
Between 2007–2014, 334 patients underwent anatomical resection for cStage-I NSCLC, either by open thoracotomy ( n = 158) or by VATS ( n = 176; conversion rate 1.7%). All patients underwent imaging with [ 18 F]-fluorodeoxyglucose positron emission tomography and computer tomography. Invasive mediastinal staging was performed in 24.6% of patients. There were more central tumours in the open group (24.1%, n = 38) compared with the VATS group (4.5%, n = 8). There was no significant difference between the number (mean ± standard deviation) of nodal stations examined (open 5 ± 1.9 vs VATS 5 ± 1.7, P = 0.99). Pathological nodal upstaging was found in 15.9% ( n = 53) of cStage-I patients. Nodal pN1 and pN2 upstaging were 13.3 and 8.2%, respectively, for the open group, and 6.3 and 4.5%, respectively, for the VATS group. In 32.6% ( n = 15/46) of patients with a central cStage-I tumour pN1, upstaging was found. A binary logistic regression model (including tumour location, technique, tumour size, gender and histology) showed that only tumour location had a significant impact on pN1 upstaging [peripheral versus central; odds ratio (OR) 5.07 (confidence interval, CI: 1.89–13.60), P = 0.001], while surgical technique had no significant impact [VATS versus open; OR 0.74 (CI: 0.31–1.78), P = 0.50].
The number of lymph node stations examined during VATS resections is similar to open resections for cStage-I NSCLC. Almost one-third of the patients with a central cStage-I NSCLC were upstaged to pN1. Tumour location was the only independent variable for pN1 upstaging in logistic regression analysis. It is a potential bias in retrospective studies and should therefore be accounted for when comparing different surgical resection techniques for cStage-I NSCLC.
INTRODUCTION
After optimal preoperative staging, 10–25% of patients with clinical stage I (cStage-I) non-small-cell lung cancer (NSCLC) are found to have unforeseen positive lymph nodes during resection [ 1 , 2 ].
Central tumours, even if they are smaller than 3 cm (cT1), have a higher incidence of both intrapulmonary or hilar (N1) or ipsilateral mediastinal (N2) lymph node involvement in comparison to peripheral lesions [ 3 , 4 ].
In a cohort of patients who underwent identical preoperative mediastinal evaluation and postoperative pathological tissue examination of equal quality, nodal upstaging can be used as a quality indicator of oncological thoracic surgery. Or, it can be used as an instrument to compare different techniques, such as thoracoscopic [video-assisted thoracic surgery (VATS)] versus open lung resections for lung cancer [ 2 , 5–8 ].
Four papers showed a lower N1 nodal upstaging with VATS compared with open surgery [ 2 , 5 , 6 , 9 ]. These retrospective studies did not include tumour location.
We hypothesized that this creates a bias as surgeons might have chosen an open approach when the tumour was centrally located. This is in line with initial feasibility reports and guidelines that excluded patients with central lesions [ 10 ]. This results in a higher prevalence of positive N1 nodes in patients operated with the open approach. The aim of this study was to investigate risk factors for nodal upstaging, including tumour location, in patients with cStage-I NSCLC from a single-centre database.
MATERIALS AND METHODS
The study was approved by the Ethics Committee at our institution and is registered at www.clincaltrials.gov (NCT01985659). Data from a prospectively managed surgical database on anatomical lung resections for bronchial carcinoma between January 2007 and June 2014 were reviewed. We selected all consecutive patients with NSCLC, excluding all patients with metastatic disease, previous major lung surgery, wedge resections, induction chemo- and/or radiotherapy, previous lymph node disease and missing [ 18 F]-fluorodeoxyglucose positron emission tomography (FDG–PET) report. Original patient files were reviewed. Staging was updated using the 7th edition of the TNM for lung tumours criteria of the American Joint Committee on Cancer [ 11 ]. Any information available before the start of the anatomical resection was considered as part of the clinical staging, including data derived from invasive mediastinal staging carried out during the same anaesthesia before VATS or thoracotomy. Lymph nodes were considered radiologically suspicious if they had a short axis of more than 1 cm at computer tomography (CT) or if they were FDG–PET positive by visual qualitative assessment (uptake higher than mediastinal blood pool).
Further analysis was done on patients with cStage-I NSCLC. Tumours were sub-divided in clinically equal or smaller than 3 cm (cT1) and larger than 3 cm (cT2a) and between squamous and non-squamous NSCLC. The designation of central tumour location was based on direct visibility of the tumour at a standard video bronchoscopy (outer diameter larger than 5 mm).
Using an intention-to-treat principle, surgical procedures were classified as open or VATS, the latter including conversions from VATS to open. Our VATS technique has been published previously [ 12 ]. A systematic lymph node dissection in accordance with the European Society of Thoracic Surgeons (ESTS) guidelines is routinely performed at our institution [ 13 ]. Separate nodal station maps were drawn for each patient after imaging, invasive mediastinal staging and final pathology. The descriptive statistics included counts and percentages for categorical variables, mean with standard deviation and median with interquartile range for, respectively, normally or non-normally distributed continuous variables. Univariable comparisons used Student's t -test, Fisher's exact test (Fisher–Freeman–Halton) and the Mann–Whitney U -test as appropriate.
An additive multivariable binary logistic regression model was used to evaluate the relation between a prespecified list of predictors (central tumour location, surgical technique, cT1 versus cT2a, gender and histology) and nodal pN1 upstaging. Odds ratio (OR) and 95% confidence interval (CI) were calculated. More specifically, risk factors have been verified for (i) pN0 versus pN1 upstaging and for (ii) negative N1 lymph nodes (N1-) versus positive N1 nodes (N1+). In the first analysis, patients with positive mediastinal nodes (pN2) are by definition excluded. We thought it was important to investigate whether the results of the analysis remained similar if performed at nodal level instead of staging level. The difference is that in the second analysis (at nodal level) patients with positive mediastinal nodes (pN2) with or without positive N1 nodes remained included.
Further, a backward selection procedure with 0.157 as critical level for the P -value was applied. This critical value corresponded to the use of the Aikake Information Criterion (AIC) for model selection. With AIC we required that the increase in model χ ² had to be larger than two times the degrees of freedom. A bootstrap resampling procedure was used to verify the stability of the final multivariable model [ 14 ]. One hundred samples were drawn with replacement from the original sample and the backward selection procedure was applied in each of these samples. For each variable, the percentage of samples wherein it was retained as predictor was reported (bootstrap importance frequency). Given the observed relation between tumour location and number of examined lymph node stations, the analysis was also performed with the number as additional predictor.
Due to the low degree of overlap between era (years since first inclusion) and surgical technique (concordance index = 0.89), era was not included as predictor in this model. The relation with era was evaluated in a univariable logistic regression model. Quadratic terms and restricted cubic splines were used to allow non-linearity (on the logit scale) in this relation (five knots have been used) [ 15 ]. P -values smaller than 0.05 were considered significant. All analyses were performed using SAS software, version 9.2 of the SAS System for Windows.
RESULTS
Study population
Our institutional database revealed 1077 consecutive anatomical lung resections between January 2007 and June 2014. After exclusions, we reviewed the files of 642 patients with NSCLC (flowchart Fig. 1 ). All patients underwent FDG–PET and CT scan. After imaging, 288 were cStage-I. Of them, 36 underwent invasive mediastinal staging [endobronchial ultrasound (EBUS) and/or cervical mediastinoscopy] due to low FDG uptake of the primary tumour or size of the tumour (cT2a). All were negative. Additionally, 46 patients with suspicious lymph nodes on imaging became cStage-I after negative invasive mediastinal staging. The overall rate of invasive mediastinal staging was 24.6%. In total 334 patients were classified as having cStage-I NSCLC at the start of the anatomical resection. The patient characteristics are summarized in Table 1 .
Patients’ characteristics
| Open | VATS | P -value | |
|---|---|---|---|
| n | 158 | 176 | |
| Age (years) | 67 ± 8 | 66 ± 9 | 0.82 |
| Gender (% male) | 77% | 59% | <0.001 |
| BMI | 26 ± 4 | 26 ± 4 | 0.86 |
| FEV1% | 82 ± 19% | 88 ± 22% | 0.010 |
| ppoFEV1% | 64 ± 18% | 70 ± 19% | <0.001 |
| FVC% | 98 ± 19% | 102 ± 20% | 0.110 |
| DLCO% | 72 ± 14% | 76 ± 18% | 0.023 |
| ppoDLCO% | 53 ± 17% | 58 ± 19% | 0.027 |
| ASA | |||
| ASA I | 3% ( n = 5) | 4% ( n = 7) | 0.38 |
| ASA II | 66% ( n = 104) | 57% ( n = 100) | |
| ASA III | 30% ( n = 47) | 38% ( n = 67) | |
| ASA IV | 1% ( n = 2) | 1% ( n = 2) | |
| ESTS predicted mortality [ 16 ] | 2 ± 2% | 2 ± 1% | 0.095 |
| ESTS predicted morbidity [ 16 ] | 17 ± 6% | 16 ± 5% | 0.041 |
| Previous malignancies | 21% ( n = 33) | 24% ( n = 42) | 0.60 |
| Cardiac comorbidities | 54% ( n = 85) | 57% ( n = 100) | 0.58 |
| Other comorbidities | 10% ( n = 16) | 7% ( n = 12) | 0.70 |
| Histology | |||
| Adenocarcinoma | 46% ( n = 73) | 67% ( n = 118) | 0.005 |
| Adenosquamous carcinoma | 4% ( n = 6) | 2% ( n = 3) | |
| Carcinoma in situ | 1% ( n = 2) | 1% ( n = 2) | |
| Large cell | 7% ( n = 11) | 3% ( n = 5) | |
| Squamous | 42% ( n = 66) | 27% ( n = 148) | |
| Clinical T | |||
| cT1a | 25% ( n = 40) | 40% ( n = 70) | <0.001 |
| cT1b | 18% ( n = 28) | 27% ( n = 48) | |
| cT2a | 57% ( n = 90) | 33% ( n = 58) | |
| Central (visible on standard bronchoscopy) | 24% ( n = 38) | 4% ( n = 8) | <0.001 |
| EBUS performed | 11% ( n = 17) | 9% ( n = 16) | 0.71 |
| VMA performed | 30% ( n = 47) | 15% ( n = 26) | 0.025 |
| Procedure | |||
| Bilobectomy | 10% ( n = 16) | 1% ( n = 2) | <0.001 |
| Lobectomy | 72% ( n = 114) | 93% ( n = 164) | |
| Sleeve lobectomy | 9% ( n = 14) | 0 | |
| Pneumonectomy | 3% ( n = 5) | 1% ( n = 2) | |
| Segmentectomy | 6% ( n = 9) | 5% ( n = 9) | |
| LN stations examined | 5 ± 2 | 5 ± 2 | 0.996 |
| Diameter of lesion (mm) (pathology) | 28 ± 14 | 23 ± 12 | <0.001 |
| Thoracic morbidity and mortality classification [ 18 ] | |||
| Grade 0 | 40% ( n = 62) | 51% ( n = 89) | 0.032 |
| Grade 1 | 13% ( n = 21) | 9% ( n =16) | |
| Grade 2 | 21% ( n = 33) | 25% ( n = 44) | |
| Grade 3a | 13% ( n = 21) | 4% ( n = 7) | |
| Grade 3b | 1% ( n = 2) | 2% ( n = 4) | |
| Grade 4 | 10% ( n = 16) | 7% ( n = 12) | |
| Grade 5 | 2% ( n = 3) | 2% ( n = 4) | |
| Hospital stay (mean, d) | 15 ± 16 | 10 ± 18 | 0.011 |
| Hospital stay (median, d) | 10 (IQR 8–15) | 7 (IQR 6–11) | <0.001 |
VATS: video-assisted thoracic surgery; BMI: body mass index; FEV1: forced expiratory volume in 1 s; ppo: predicted postoperative value; ASA: American Society of Anaesthesiologists score; ESTS: European Society of Thoracic Surgeons; EBUS: endobronchial ultrasound; VMA: video mediastinoscopy; LN: lymph node; IQR: interquartile range; FVC%: forced vital capacity; DLCO%: diffusion capacity.
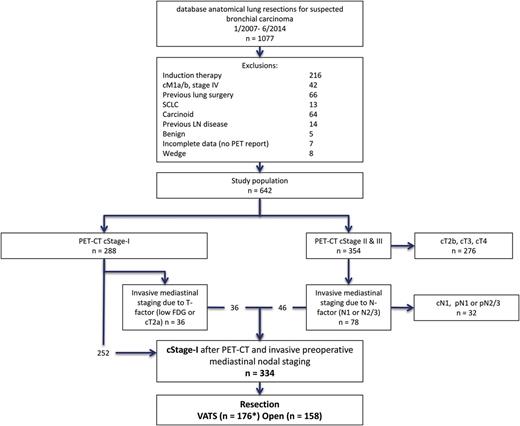
Diagram of the selection of the patient cohort ( n = 334). dBase: database; SCLC: small-cell lung cancer; PET–CT: positron emission tomography-computer tomography; cStage-I: clinical stage I; VATS: video-assisted thoracic surgery; LN: lymph node; FDG: fluorodeoxyglucose *including three converted cases to thoracotomy.
Video-assisted thoracic surgery versus open surgery
Patients underwent open thoracotomy ( n = 158) or VATS ( n = 176). The evolution over years from open surgery to VATS surgery is portrayed in Fig. 2 . The conversion rate in the VATS group was 1.7% ( n = 3), 2 for bleeding and 1 for massive adhesions. These patients were further analysed in the VATS group in an ‘intention to treat’ fashion and showed no nodal upstaging. Final resection margins were negative in all patients.
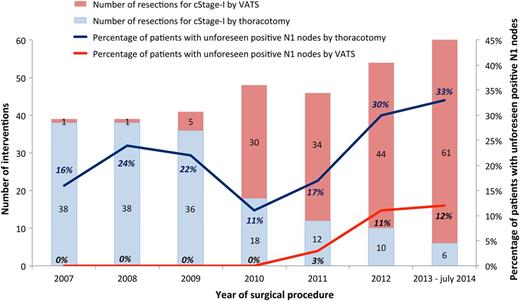
Number of interventions for cStage-I NSCLC by VATS or thoracotomy per year (left axis). Percentage of patients with unforeseen positive N1 nodes by VATS or thoracotomy (right axis). VATS: video-assisted thoracic surgery; cStage-I: clinical stage I; NSCLC: non-small-cell lung cancer.
Nodal upstaging
In 20.4% ( n = 68) pathological TNM stage was higher than the clinical TNM stage. T-factor upstaging was seen in 6.6% ( n = 22). Pathological nodal upstaging was found in 15.9% ( n = 53) of patients. In 9.6% ( n = 32) this was due to positive N1 nodes, in 4.2% ( n = 14) both N1 and N2 nodes, and in 2.1% ( n = 7) N2 nodes were positive while N1 nodes were negative. Nodal pN1 and pN2 upstaging were 13.3% ( n = 21) and 8.2% ( n = 13), respectively, for the open group, and 6.3% ( n = 11) and 4.5% ( n = 8), respectively, for the VATS group (Table 2 ). Nodal upstaging, N1 upstaging and N2 upstaging were, respectively, seen in 32.6% ( n = 15), 32.6% ( n = 15) and 0% of patients with a central tumour ( n = 46) and in 13.2% ( n = 38), 5.9% ( n = 17) and 7.3% ( n = 21) of patients with peripheral tumours ( n = 288).
Examined lymph node stations and upstaging by approach
| Open | VATS | |||
|---|---|---|---|---|
| % | n = 158 | % | n = 176 | |
| Examined nodal station [ 19 ] | ||||
| 2 | 24.8 | 39 | 24.3 | 43 |
| 3 | 1.9 | 3 | 2.8 | 5 |
| 4 | 66.9 | 105 | 61.6 | 109 |
| 5 | 33.1 | 52 | 40.7 | 72 |
| 6 | 10.2 | 16 | 19.8 | 35 |
| 7 | 73.9 | 116 | 83.6 | 148 |
| 8 | 12.1 | 19 | 4.5 | 8 |
| 9 | 44.6 | 70 | 35.6 | 63 |
| 10 | 86.6 | 136 | 88.7 | 157 |
| 11 | 82.8 | 130 | 86.4 | 153 |
| 12 | 27.4 | 43 | 29.4 | 52 |
| Upstaging | ||||
| pN0 | 78.5 | 124 | 89.2 | 157 |
| pN1 | 13.3 | 21 | 6.3 | 11 |
| pN2 | 8.2 | 13 | 4.5 | 8 |
| pN2(N1+) | 5.7 | 9 | 2.8 | 5 |
| pN2(N1−) | 2.5 | 4 | 1.7 | 3 |
| N1+ | 19 | 30 | 9.1 | 16 |
N1+: unforeseen N1 nodes (N1+), being the sum of pN1 and pN2(N1+); pN2(N1+): patients with both positive N1 and N2 nodes; pN2(N1−): patients with skip metastases, i.e. positive N2 nodes and negative N1 nodes; VATS: video-assisted thoracic surgery.
No difference (mean ± standard deviation) was detected between the number of nodal stations examined by open surgery (5 ± 1.9) or by VATS (5 ± 1.7, P = 0.99). A detailed summary of the examined lymph node stations can be found in Table 2 .
Univariable analysis
In a univariable setting, the probability for pN1 upstaging was significantly higher for central tumours, for open surgery, for squamous cell tumours and for cT2a tumours. The same was found for unforeseen N1 nodes (including pN2 with positive N1 nodes) except that squamous cell carcinoma was not significant (Table 3 ).
Univariable analyses
| A | n | Unforeseen N1+ ( n = 46) | OR (CI) | P -value | B | n | pN1 upstaging ( n = 32) | OR (CI) | P -value |
|---|---|---|---|---|---|---|---|---|---|
| Central tumour | 46 | 32.6% ( n = 15) | 4.01 (1.95; 8.25) | <0.001 | Central tumour | 46 | 32.6% ( n = 15) | 7.12 (3.24; 15.7) | <0.001 |
| Peripheral tumour | 288 | 10.8% ( n = 31) | Peripheral tumour | 267 | 6.4% ( n = 17) | ||||
| Female | 108 | 13% ( n = 14) | 0.90 (0.46; 1.77) | 0.767 | Female | 102 | 9.8% ( n = 10) | 0.93 (0.43; 2.05) | 0.865 |
| Male | 226 | 14.2% ( n = 32) | Male | 211 | 10.4% ( n = 22) | ||||
| VATS | 176 | 9.1% ( n = 16) | 0.43 (0.22; 0.82) | 0.010 | VATS | 168 | 6.5% ( n = 11) | 0.41 (0.19; 0.89) | 0.024 |
| Open | 158 | 19% ( n = 30) | Open | 145 | 14.5 ( n = 21) | ||||
| Squamous | 114 | 16.7% ( n = 19) | 1.43 (0.76; 2.70) | 0.271 | Squamous | 108 | 15.7% ( n = 17) | 2.37 (1.13; 4.95) | 0.022 |
| Non-squamous | 220 | 12.3% ( n = 27) | Non-squamous | 205 | 7.3% ( n = 15) | ||||
| cT2a | 148 | 18.9% ( n = 28) | 2.18 (1.15; 4.12) | 0.017 | cT2a | 137 | 16.1% ( n = 22) | 3.18 (1.45; 6.96) | 0.004 |
| cT1a and cT1b | 186 | 9.7% ( n = 18) | cT1a and cT1b | 176 | 5.7% ( n = 10) |
P -values from Fisher's exact test.
A: univariable analysis of risk factors for unforeseen N1 nodes versus no unforeseen N1 nodes. This is an analysis of the complete patient population ( n = 334) including patients with pN2 skip metastases in the negative group and both positive N1 and N2 nodes in the positive group;
B: univariable analysis of risk factors for pN1 upstaging versus pN0 ( n = 313). In this analysis the patients with pN2 are by definition excluded ( n = 21), even if they had both N1 and N2 positive lymph nodes ( n = 14);
OR: odds ratio; CI: confidence interval; VATS: video-assisted thoracic surgery.
Multivariable analysis
In the multivariable models only tumour location remained significant, i.e. the probability for upstaging is higher for central tumours compared with peripheral tumours (Table 4 and Fig. 3 ). The evidence for an effect of surgical technique disappeared. These conclusions also held when the number of investigated lymph node stations was considered as an additional predictor. Furthermore, in an analysis stratified by tumour location, the evidence for an effect of surgical technique was absent. In the subset of patients with a peripheral tumour, there was 5.6% (9/160) probability for pN1 upstaging after VATS compared with 7.5% (8/107) after open surgery [OR = 0.73 (CI: 0.28–1.98), P = 0.55]. In the smaller set of patients with a central tumour, there was 25% (2/8) probability for pN1 upstaging after VATS compared with 34.2% (13/38) after open surgery [OR = 0.64 (CI: 0.11–3.63), P = 0.62]. The same pattern was observed when considering unforeseen N1 nodes including pN2 with positive N1 nodes (results not shown).
Multivariable analyses of the risk factors of unforeseen positive N1 nodes or pN1 upstaging (excluding pN2 patients in the latter)
| Unforeseen positive N1 | pN1 upstaging | |||||||||
|---|---|---|---|---|---|---|---|---|---|---|
| Multivariable | Multivariable (backward) | Multivariable | Multivariable (backward) | |||||||
| Odds ratio | P -value | OR (CI) | P -value | BIF (%) | Odds ratio | P -value | OR (CI) | P -value | BIF (%) | |
| Central tumour | 3.25 (1.35; 7.85) | 0.009 | 3.25 (1.52; 6.93) | 0.002 | 92 | 5.07 (1.89; 13.6) | 0.001 | 5.56 (2.42; 12.8) | <0.001 | 99 |
| Female | 1.28 (0.61; 2.67) | 0.51 | 26 | 1.71 (0.69; 4.24) | 0.25 | 30 | ||||
| VATS | 0.58 (0.28; 1.17) | 0.13 | 0.56 (0.28; 1.13) | 0.104 | 65 | 0.74 (0.31; 1.78) | 0.50 | 28 | ||
| Squamous | 0.84 (0.39; 1.82) | 0.66 | 19 | 1.24 (0.50; 3.11) | 0.65 | 26 | ||||
| cT2a | 1.55 (0.78; 3.09) | 0.21 | 41 | 2.02 (0.85; 4.78) | 0.11 | 2.01 (0.86; 4.7) | 0.106 | 46 | ||
OR: odds ratio; CI: confidence interval; BIF: bootstrap importance frequency; VATS: video-assisted thoracic surgery.
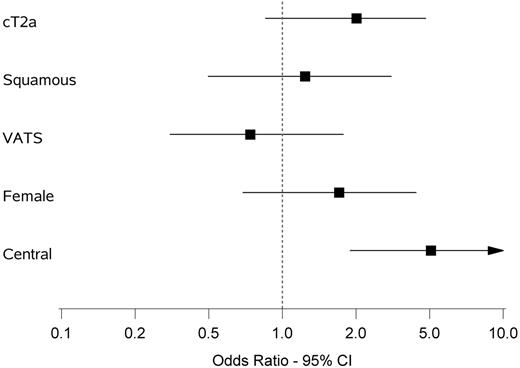
Multivariable analysis of upstaging from cN0 to pN1. Odds ratio and 95% confidence interval are shown of the following variables: cT2a versus cT1, squamous versus non-squamous, VATS versus open, female versus male, central versus peripheral location of tumour. VATS: video-assisted thoracic surgery; CI: confidence interval.
Effect of era
Based on a logistic regression model allowing non-linearity, there was a significant relation between the era and the probability of pN1 upstaging (using a quadratic term: χ ² = 6.1, df = 2, P = 0.048; using splines: χ ² = 13.9, df = 4, P = 0.008). Irrespective of the approach used to allow non-linearity, the relation was clearly not monotone, with a decrease in upstaging followed by an increase (Fig. 4 ).
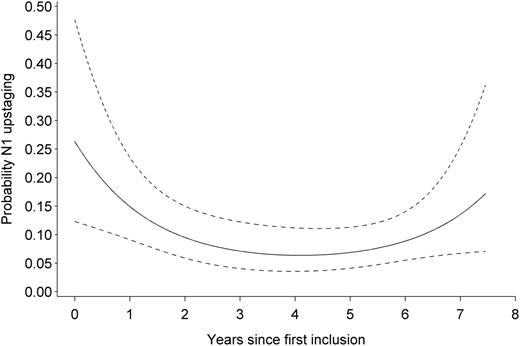
Probability of N1 upstaging during the study period. Prediction is obtained from a logistic regression model allowing a quadratic relation on the logit scale. Dashed lines represent the 95% pointwise confidence interval for the predicted values.
We found no evidence for a relation between the era and probability of positive N1 nodes (including pN2 with positive N1 nodes), neither assuming linearity ( P = 0.22), nor allowing non-linearity (using a quadratic term: χ ² = 2.7, df = 2, P = 0.257; using splines: χ ² = 7.8, df = 4, P = 0.099).
DISCUSSION
Lymph node upstaging can be used to study the quality of a new surgical technique in case of comparable study groups and equal quality of pretreatment staging and pathological examination [ 2 , 5–8 ]. Several reports have shown lower cN0 to pN1 upstaging after VATS anatomical lung resections for NSCLC compared with open surgery [ 2 , 5 , 6 , 9 ].
The main finding of our study is that central location of the tumour is a significant risk factor for cN0 to pN1 nodal upstaging at resection of cStage-I NSCLC in a multivariable analysis, while surgical technique (VATS or open) is not. Surgeons tend to negatively select patients with central tumours for VATS resections in compliance with initial VATS feasibility studies [ 10 ]. This might introduce a bias resulting in lower pN1 upstaging in the VATS group in reported retrospective studies [ 2 ]. In our series, 24% of the patients undergoing open thoracotomy for a cStage-I tumour had a central lesion versus only 4.5% in the VATS group ( P < 0.001).
At first sight, the data from our centre seem to reveal an unfavourable rate of pN1 upstaging for the minimally invasive group, despite identical number of lymph node stations examined during VATS and open surgery. Both findings are comparable with previous studies [ 5 , 6 ].
Merritt et al . published a single-centre retrospective study with 129 patients with NSCLC with clinically negative lymph nodes. All except one underwent FDG–PET scan [ 6 ]. A recently published study based on the Kentucky Cancer Registry also showed lower pN1 upstaging after VATS (5.9 vs 8.2%) in a sub-group analysis of cStage-I patients excluding non-anatomical resections (VATS n = 187, open n = 797) [ 9 ]. Data on the extent of preoperative staging were not available. Licht et al . included 1513 cStage-I patients from the Danish Lung Cancer Registry (DLCR), a mandatory database including every lung cancer patient in Denmark. After logistic regression the authors found invasive mediastinal staging, number of lymph nodes dissected, anatomic lobe and also surgical approach (VATS versus open) to be significant predictors for nodal upstaging (N1 and N2 combined). Only 24% of patients underwent a preoperative PET scan in this study, but in 66% invasive mediastinal staging was used. Multivariable survival analysis did not show difference in survival after VATS versus open surgery for cStage-I NSCLC. The authors conclude that differences in nodal upstaging must have resulted from selection for reasons not captured in the database [ 5 ].
We focused in our study on predictors of N1 staging, as one can argue that the finding of unforeseen positive mediastinal nodes (pN2) is more dependent on the quality of preoperative staging (meaning the use and quality of PET–CT and invasive mediastinal staging) in comparison with pN1 upstaging. A multivariable analysis of the predictors of pN1 upstaging alone was not performed in the study of Licht et al . In a larger study, Boffa et al . analysed the data from more than 11 531 lung resections from the voluntary database of the Society of Thoracic Surgeons (STS). They found similar incidence of pN2 upstaging, but less cN0 to pN1 upstaging in the VATS group. This was confirmed after propensity matching of 2475 pairs (6.8 vs 9%, P = 0.002) [ 2 ]. The use of PET scan was not registered. Mediastinal staging procedures were performed in 10% in the open group and 13% in the VATS group. In the paper's discussion, the authors acknowledged selection biases as the potential reason for the findings.
In all four papers, the role of central location of the tumour was not investigated and more large tumours were found in the open group compared with the VATS group [ 2 , 5 , 6 , 9 ].
Boffa et al . further mention potentially better preoperative staging in the VATS patients as other reports have shown a more frequent use of FDG–PET in VATS patients [ 2 , 20 ]. In conference discussions, the argument has been made that availability of EBUS is higher in VATS centres [ 9 ].
One of the strongest arguments of patient selection in the data of Boffa et al . was the finding of a high 17% cN0 to pN1 upstaging in patients operated through a thoracotomy by VATS-predominant surgeons (≥80% of submitted cases by VATS). This suggests that the cases with higher chance of nodal upstaging were intentionally operated on by an open technique. Similarly, in the last period (2012–14) of our study, during which 86.8% ( n = 105/121) of cStage-I patients were operated on by VATS, we found unforeseen positive N1 nodes in 31.2% ( n = 5/16) of the patients operated on by thoracotomy (Fig. 2 ).
The finding that central location is an important risk factor for N1 upstaging and the negative finding for surgical technique in a multivariable analysis do not mean we can finally conclude that VATS is as good as open surgery for intrapulmonary and hilar lymph node dissection. Indeed, the obtained ORs, although being non-significant, are still in favour of open surgery and have wide CIs. The numbers are clearly too low to exclude a type II statistical error. Moreover, the study of Boffa et al . seems to suggest that the quality of N1 lymphadenectomy is related to experience. First, in VATS patients, the percentage of N1 upstaging is correlated with the proportion of VATS over open resections performed by the database participant. Second, surgeons with ‘high proportions of VATS’ performing VATS seem to have equal N0 to N1 upstaging compared with predominantly open surgery surgeons performing open surgery (around 8%) [ 2 ]. In our own data, we found a correlation between the era and probability of N1 upstaging. There was a dip during early experience with VATS resections (Figs 2 and 4 ). Variation due to low numbers might partially explain these findings, but the effect of a learning curve should certainly not be excluded. VATS anatomical resections can be performed in many different ways. Merritt et al. described in their report a traditional ‘fissure-less’ technique with hilar dissection first and division of the fissure in the final step. We previously reported our evolution away from a hilum-first technique towards a tunnelled and stapled fissure-first technique, which allows easy removal of the N1 intrafissural nodes [ 12 ].
A secondary finding of our study is that central cStage-I tumours (100% PET–CT staged) have a 32.6% ( n = 15/46) chance of positive N1 lymph nodes during resection. Remarkably, there was no pN2 upstaging among these patients. In this group with central tumours, 45.6% ( n = 21) underwent invasive mediastinal staging. This illustrates that the rate of peroperative pN1 upstaging is less influenced by preoperative mediastinal staging in comparison with pN2 upstaging. This is in line with the fact that PET–CT has difficulties to discriminate positive lymph nodes adjacent to the tumour. We therefore think that pN1 upstaging is a better tool to grade the quality of surgical resection after optimal mediastinal staging in comparison with pN2 upstaging. Ketchedjian et al . found a 50% chance of nodal upstaging (both N1 and N2) in central T1 tumours [ 3 ]. These patients were staged between 1979 and 2002, presumably a majority without FDG–PET. The authors concluded that tumours visible on standard bronchoscopy are not good candidates for sub-lobar resections and a more aggressive therapy is warranted, including a thorough intrapulmonary and hilar lymphadenectomy [ 3 ]. Our data suggest that these statements are still true today, even with enhanced staging modalities.
The limitations of this study originate mainly from its retrospective nature: even if the quality of mediastinal staging is expected to have a small effect on peroperative N1 upstaging compared with N2 upstaging, we must acknowledge that staging techniques changed since 2007 with increasing use of EBUS and esophageal ultrasound (EUS) and corresponding relatively reduced use of mediastinoscopy.
Another consequence of the chosen study period is the increasing experience with minimally invasive techniques, translating into less selective patient allocation to VATS procedures in present days and inclusion of the learning curve of the VATS technique.
There is a lack of consensus concerning the definition of a ‘central’ lesion. The dividing line has been placed at the inner third of the lung by some authors [ 3 ]. Others define central as any lesion in contact with the intrapulmonary main bronchi, pulmonary artery, pulmonary veins or the origin of the first segmental branches [ 21 ]. We chose visibility of the tumour by standard video bronchoscopy as a marker for central location of the tumour. This is easily reproducible and less variable between observers in comparison with other classifications. It can therefore be used in large national or societal databases. We acknowledge that with the combination of all the above-mentioned criteria instead, more patients would have been allocated to the central group.
Like other investigators, we specifically did not take into account the number of lymph nodes. Indeed, potential fragmentation of the nodes and variation from one patient to another seems to make it meaningless [ 8 , 17 , 22 ]. Instead we used the number of examined lymph node stations.
As discussed by Licht et al ., conversion from VATS to thoracotomy because of reasons related to unforeseen positive lymph nodes can be a reason for lower upstaging in the VATS group, as these patients were included in the thoracotomy group. Following the intention-to-treat principle, conversions to thoracotomy were left in the VATS group. There was no nodal upstaging in the three cases with conversion.
The strength of our study is the thorough preoperative staging and the availability of full nodal data in comparison with societal databases that let us analyse both pN1 nodal upstaging but also unforeseen positive N1 nodes, including the patients with both positive N1 and N2 nodes. We used the complete dataset of a single institution, therefore avoiding potential selective data reporting bias.
CONCLUSION
Our data show a one-in-three probability of pN1 upstaging in PET–CT-staged patients with cStage-I central located NSCLC. The number of lymph node stations examined during VATS resections was similar to open resections for cStage-I NSCLC. Our results confirm the results from the DLCR and STS database that nodal upstaging in cStage-I NSCLC is lower after VATS compared with open surgery, but we found that the evidence for this difference disappears in a multivariable logistic regression analysis including tumour location. This suggests that patient selection based on central tumour location can at least partially explain the findings of previous reports with lower upstaging in the VATS group. Analysis of the evolution of N1 upstaging during the study period did show a lower upstaging in the middle period, possibly caused by the learning curve of the VATS lobectomy technique.
Retrospective studies showing lower N1 upstaging during VATS procedures should be interpreted with caution if the multivariable analysis did not include central tumour location.
Conflict of interest: none declared.
REFERENCES
APPENDIX: CONFERENCE DISCUSSION
Dr O. Pikin(Moscow, Russian Federation) : According to your report, you have compared the number of lymph node stations between the open and VATS groups. Have you compared the number of lymph nodes resected in these two groups? Maybe the reason for this upstaging was the lesser number of lymph nodes resected.
Dr Stanzi : No, we didn't. We chose not to do so because we believe that the number of lymph nodes is dependent on too many variables, such as the willingness of the pathologist to look for lymph nodes and count them. So we actually preferred to check the stations rather than the lymph nodes.
Dr D. Wood(Seattle, WA, USA) : A very nice analysis. I think it gives another explanation for some of the data that we have seen on upstaging differences between open and VATS surgery. And you propose that we now include tumour location in our databases. How would you suggest we do that? That gets into the logistics of how we are going to create definitions, and how we would capture that and put it into our large databases in a meaningful way that would be then analysable.
Dr Stanzi : We know that there are many definitions of tumour location. We went for “visibility at bronchoscopy” because it seems to be reproducible, it was among the information available to us, and is not too dependent on the observer. That could have been a risk of using one of the other available definitions such as the location of the lesion within the inner third of the lung. In that case we would need to have asked the radiologists to review each case. Our approach (visibility on bronchoscopy) is more feasible for use with large databases and it seems to be effective.
Dr R. Flores(New York, NY, USA) : You may have had it on the slide, but the variable that you looked at in the multivariate analysis, how did it analyse tumour location, inner third versus outer third?
Dr Stanzi : No. It was “visible at bronchoscopy” (so endoscopic visibility) or “not visible” with a standard bronchoscope.
Dr G. Veronesi(Milan, Italy) : Did you include in the multivariable analysis whether preoperative invasive mediastinal staging, had been performed? Because I think that if you have already staged the mediastinum with mediastinoscopy or EBUS, there is probably less risk of occult disease.
Dr Stanzi : We didn't do that because we believe that invasive mediastinal staging has an impact on the risk of N2 upstaging, but less on N1 upstaging. That is the reason why our work is actually focusing on N1: we wanted to evaluate a tool we use to analyse the quality of the resection, and we believe using N2 upstaging would have been biased by different mediastinal staging. So that is also why we didn't add invasive mediastinal staging to the multivariate model.
Author notes
Presented at the 23rd European Conference on General Thoracic Surgery, Lisbon, Portugal, 31 May–3 June 2015.
