


Abstract
Immune reaction against the α-Gal(Galα1,3-Galβ1-4GlcNAc-R) epitope is known to be one of the important factors for calcification of bioprostheses. The genetically manipulated α-Gal knock-out (KO) mice lacking the α-Gal epitope and containing anti-α-Gal antibodies may simulate an immune response against xenoantigens in primates including humans. The aims of this study were (i) to compare calcification and immune reactions of glutaraldehyde (GA)-fixed bovine with primate pericardium and (ii) to assess the differences in bovine pericardium treated with decellularization and α-galactosidase, using an α-Gal KO mouse implantation model.
Four types of GA-fixed xenogeneic tissues were implanted into α-Gal KO mice for 16 weeks (Group 1: primate pericardium, n = 14; Group 2: bovine pericardium, n = 19; Group 3: decellularized bovine pericardium, n = 20; Group 4: decellularized and α-galactosidase-treated bovine pericardium, n = 21). Serum enzyme-linked immunosorbent assays for immune response were performed before implantation and 2, 4, 8, 12 and 16 weeks after implantation. Implanted tissues were harvested and studied for histopathology and quantification of calcification.
Anti-α-Gal IgG antibody titres of Groups 2–4 increased after implantation although the titres did not change in Group 1. When compared with preimplantation titres, the increased IgG titres were highest at 8 weeks after implantation in Groups 2–4 (0.4358 ± 0.0524 vs 0.5462 ± 0.0519 in Group 2, 0.4712 ± 0.0500 vs 0.6424 ± 0.0613 in Group 3 and 0.4892 ± 0.0801 vs 0.6112 ± 0.0339 in Group 4; P = 0.028 in each group). Median calcium levels were higher in Group 2 than in Group 1 (9.21 vs 3.86 μg/mg, P < 0.001), but were not significantly higher in Groups 3 and 4 than in Group 1 (4.09 μg/mg in Group 3, P = 0.904; 5.47 μg/mg in Group 4, P = 0.210).
GA-fixed bovine pericardium showed higher calcium levels than primate pericardium. Increased IgG antibody titres in the bovine but not in the primate group suggested that an immune response was involved in implanted tissue. Differences in calcium levels of bovine pericardium treated with decellularization and α-galactosidase were insignificant compared with primate pericardium, suggesting those treatments to be effective methods in preventing calcification of the bioprostheses.
INTRODUCTION
Bioprostheses have advantages over mechanical prostheses, including less thrombogenicity and no lifelong anticoagulation therapy. However, application of bioprotheses in cardiovascular surgery has the limitations of dystrophic calcification and low durability. Bioprosthetic tissues are commonly fixed with glutaraldehyde (GA) to increase tissue stability and reduce antigenicity but are prone to calcification. Free aldehyde groups of GA, tissue phospholipids and residual non-viable connective tissue cells of the bioprosthetic tissue have been studied as some of the multiple factors involved in the calcification process [ 1 , 2 ]. Detoxification with amino acids to block the free aldehyde groups [ 3 , 4 ], removal of bioprosthetic tissue phospholipids with various alcohol solutions [ 5 , 6 ] and use of other cross-linking agents [ 2 , 7 ] have been used in the past to suppress such factors in the calcification process.
It was reported that humans and certain non-human primates had naturally occurring antibodies to the most important pig antigen, Galα1,3-Galβ1-4GlcNAc-R (α-Gal) epitope, and the antibodies could initiate hyper-acute rejection of pig organs [ 8 ]. Therefore, attempts such as detergent-based decellularization treatment or α-galactosidase treatment have been developed to remove the α-Gal epitope to avoid immune reactions between xenoreactive antibodies and the α-Gal epitope of bioprostheses, the major barriers in xenotransplantation [ 9–12 ]. To simulate an immune response against xenoantigen in humans, the genetically manipulated α-Gal knock-out (KO) mice lacking the α-Gal epitope and containing anti-α-Gal antibodies were used in this study. Additionally, primate pericardial tissue was used as a control group because it did not express the α-Gal epitope and would not evoke an immune response when implanted in α-Gal KO mice.
The aims of this study were (i) to compare calcification and immune reactions of GA-treated bovine pericardial tissue with GA-treated primate pericardial tissue; and (ii) to assess the differences of calcification and immune reactions in decellularized and α-galactosidase-treated bovine pericardial tissue, using an α-Gal KO mouse implantation model for all groups.
MATERIALS AND METHODS
Tissue preparation
Fresh primate pericardial tissue of Rhesus monkeys (5–10 kg, Chinese) was obtained from the Seoul National University Hospital primate research centre, and fresh bovine pericardial tissue was obtained from the local slaughterhouse. The fresh primate and bovine pericardial tissues were placed in cold phosphate-buffered saline (PBS, 0.1 M, pH 7.40) and transported to the laboratory. On arrival, they were rinsed with normal saline and cleared of adherent fat and areolar tissue.
Decellularization
Decellularization [ 13 ] was performed prior to GA tissue fixation. Tissues were washed with cold saline, and then treated with 0.1% peracetic acid with 4% (v/v) ethanol in distilled water for 1 h (for bioburden reduction), followed by vigorous washing with distilled water for one additional hour. After the procedure, tissues were incubated in a hypotonic solution with 0.25% sodium dodecylsulphate for 24 h, and then washed with distilled water for 12 h. The tissues were then treated with 0.5% triton X-100 hypotonic solution for 24 h and with isotonic solution for 24 h, and then washed with distilled water for 12 h. Finally, the tissues were treated with hypertonic solution for 6 h and PBS buffer solution for 1 h. All the processes were performed at 4°C.
α-Galactosidase preparation and treatment
We used α-galactosidase derived from Bacteroides thetaiotaomicron. The gene for the α-galactosidase from B. thetaiotaomicron (designated BtGal110B) was amplified from the corresponding genomic DNAs by polymerase chain reaction and was introduced into the pET28a vector for expression of the His6-tagged proteins using appropriate restriction sites for protein expression in Escherichia coli Rosetta2 (DE3) (Novagen, Madison, WI, USA). Escherichia coli was grown in Luria-Bertani media supplemented with 34 μg/ml chloramphenicol and 30 μg/ml kanamycin, induced at an A600 nm∼0.6 with 1 mM isopropyl-1-thio-β- d -galactopyranoside. The harvested cell pellet was lysed in a lysis buffer (50 mM NaH2PO4, 300 mM NaCl and 10 mM imidazole) using the Ultrasonicator (Misonix, Inc., Farmingdale, NY, USA). The crude lysates were centrifuged for 20 min at 13 000 rpm and 4 °C, and the expressed protein was purified using Nickel-NTA agarose column (Qiagen, Valencia, CA, USA) according to the manufacturer's instruction. After treatment with 0.5% triton X-100 hypotonic solution for decellularization, tissues were treated with isotonic solution containing α-galactosidase (0.1 U/ml) for 24 h.
Glutaraldehyde fixation
All tissues were fixed in PBS-buffered 0.5% GA solution for 3 days, and then further fixed in 0.25% GA solution with 75% ethanol and 5% octanol for 2 additional days. All the treatments were performed at room temperature. After the fixation process, the tissues were again incubated in 0.25% GA for 1 week and then in 0.1 M glycine for 1 day.
Experimental groups
Group 1 (GA-fixed primate pericardium, n = 14): primate pericardial tissue was fixed in GA solution without decellularization or α-galactosidase treatment (Fig. 1 ).
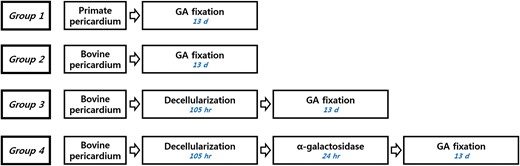
Flow diagram of the tissue treatment process (GA: glutaraldehyde; d: days; hr: hours ) .
Group 2 (GA-fixed bovine pericardium, n = 19): bovine pericardial tissue was fixed in GA solution without decellularization or α-galactosidase treatment.
Group 3 (Decellularized GA-fixed bovine pericardium, n = 20): bovine pericardial tissue was fixed in GA solution after decellularization.
Group 4 (Decellularized and α-galactosidase-treated, GA-fixed bovine pericardium, n = 21): bovine pericardial tissue was fixed in GA solution after decellularization and α-galactosidase treatment.
α-Gal knock-out mouse subcutaneous implantation
A total of 24 α-Gal KO mice were obtained from the Center for Animal Resource Development, Seoul National University College of Medicine. Six α-Gal KO mice (C57BL/6, 16 weeks old, 22–34 g) per group were used. After the mice were anaesthetized and shaved, four subcutaneous pouches were created in the dorsal area of each mouse. Each group had its treated tissue samples (8 × 8 mm each) implanted into each pouch for a total of 24 tissue samples per group, and the wounds were closed with 6/0 nylon sutures. Sixteen weeks after implantation, mice were euthanized by CO 2 asphyxiation and the tissue samples were harvested. During the breeding period, some mice died before 90 days of implantation and a few tissue samples were lost because a mouse dug the implanted tissue of another mouse out and ate it.
The study protocol was approved by the Institutional Animal Care and Use Committee of Clinical Research Institute, Seoul National University Hospital (IACUC No. 12-0107). The animal housing facility was accredited by the Association for the Assessment and Accreditation of Laboratory Animal Care International.
Enzyme-linked immunosorbent assay
Anti-α-Gal serum IgM and IgG antibodies were measured by enzyme-linked immunosorbent assay (ELISA) before implantation and 2, 4, 8, 12 and 16 weeks after implantation. Blood samples of ∼0.4 ml per mouse were collected by infraorbital venous plexus sampling. Synthetic α-Gal epitopes linked to bovine serum albumin (α-Gal-BSA; Dextra, Reading, UK) were used as a solid-phase antigen. Diluted serum samples (1:40 for IgM and 1:20 for IgG) were measured. Secondary antibodies used were horseradish peroxidase-conjugated rabbit anti-mouse IgM (Jackson ImmunoResearch, West Grove, PA, USA) or goat anti-mouse IgG (Jackson ImmunoResearch, West Grove, PA, USA) at 1:10 000 and 1:5000 dilutions to detect anti α-Gal serum IgM and IgG antibodies, respectively. The colour reaction was developed with tetramethylbenzidine solution (BD Biosciences, San Diego, CA), and absorbance was measured in an ELISA reader at 450 nm. The titre of anti-α-Gal antibody was defined as the reciprocal of serum dilution which yielded an optical density of 1.0.
Microscopic examination
Tissue samples harvested after implantation were examined with light microscopy. Harvested tissue samples were fixed in 10% formalin, embedded in paraffin wax, cut into 2–4 µm thick sections, and stained with haematoxylin–eosin (H-E). The structure of collagen fibres, degree of inflammatory cellular reaction and calcification were examined.
Calcium analysis
Harvested tissue samples (taken from a maximum of 24 samples for each group) were washed with normal saline, dried at 70°C for 24 h and weighed. Samples were then hydrolysed with 5.0 N HCl solution. Calcium levels of the hydrolysate were measured colorimetrically by the O -cresolphthalein complexone method, using an automatic chemistry analyser, Hitachi 7070 (Hitachi Ltd, Tokyo, Japan), and were expressed as μg/mg dry weight.
Low-density X-ray study
Low-density X-ray images of the harvested tissue samples were taken, and the degree of calcification was analysed by visual inspection.
Statistical analysis
Statistical analysis was performed with the SPSS software package (version 20.0; SPSS, Inc., Chicago, IL, USA). Data were expressed as mean ± standard deviation for parametric data or median (interquartile range) for non-parametric data. The normality test was done using the Kolmogorov–Smirnov test. A P -value of <0.05 was considered statistically significant. Comparisons between groups were performed using the Mann–Whitney U -test and Kruskal–Wallis tests. The Wilcoxon signed-rank test and repeated-measures analysis of variance (ANOVA) were used to assess the significance of differences at each time interval within the groups and between groups.
RESULTS
Enzyme-linked immunosorbent assay
Anti-α-Gal IgM antibody titres did not show significant changes immediately after subcutaneous implantation when compared with preimplantation levels in all groups (Fig. 2 , Tables 1 and 2 ). Also, there were no differences in IgM titres among the groups at various time points in the study.
Titres of anti-α-Gal IgM antibodies by group at preimplantation and 2, 4, 8, 12 and 16 weeks after implantation
| Groups | P -value | Preimplantation | 2 weeks | 4 weeks | 8 weeks | 12 weeks | 16 weeks |
|---|---|---|---|---|---|---|---|
| 1 | 0.1575 ± 0.1009 | 0.1906 ± 0.3122 | 0.1677 ± 0.1252 | 0.1735 ± 0.0668 | 0.1779 ± 0.1733 | 0.1697 ± 0.1579 | |
| *P | 0.753 | 0.600 | 0.463 | 0.917 | 0.917 | ||
| **P | |||||||
| 2 | 0.1092 ± 0.0522 | 0.1174 ± 0.0728 | 0.1510 ± 0.2379 | 0.1365 ± 0.1062 | 0.1437 ± 0.0356 | 0.1157 ± 0.0570 | |
| *P | 0.753 | 0.753 | 0.463 | 0.463 | 0.917 | ||
| **P | 0.485 | 0.589 | 0.065 | 0.394 | 0.937 | 0.699 | |
| 3 | 0.1563 ± 0.1006 | 0.1848 ± 0.2777 | 0.1820 ± 0.0429 | 0.1635 ± 0.0866 | 0.1472 ± 0.0950 | 0.1029 ± 0.1044 | |
| *P | 0.917 | 0.345 | 0.917 | 0.753 | 0.173 | ||
| **P | 0.937 | 0.937 | 0.180 | 0.937 | 1.000 | 0.394 | |
| 4 | 0.1487 ± 0.1943 | 0.1546 ± 0.1137 | 0.1506 ± 0.1116 | 0.1658 ± 0.1071 | 0.1551 ± 0.0486 | 0.1328 ± 0.0830 | |
| *P | 0.463 | 0.917 | 0.249 | 0.345 | 0.600 | ||
| **P | 0.485 | 0.394 | 0.818 | 0.818 | 0.937 | 0.937 |
* P -values compare the antibody titres of postimplantation with those of preimplantation.
** P -values compare antibody titres of Groups 2–4 with those of Group 1 at each respective time period.
Titres of anti-α-Gal IgG antibodies by group at preimplantation and 2, 4, 8, 12 and 16 weeks after implantation
| Groups | P -value | Preimplantation | 2 weeks | 4 weeks | 8 weeks | 12 weeks | 16 weeks |
|---|---|---|---|---|---|---|---|
| 1 | 0.4512 ± 0.0538 | 0.4682 ± 0.0722 | 0.5461 ± 0.0789 | 0.4669 ± 0.0783 | 0.4919 ± 0.0425 | 0.4090 ± 0.1161 | |
| *P | 0.600 | 0.058 | 0.917 | 0.116 | 0.917 | ||
| **P | |||||||
| 2 | 0.4358 ± 0.0524 | 0.4615 ± 0.0581 | 0.5465 ± 0.0599 | 0.5462 ± 0.0519 | 0.4447 ± 0.0164 | 0.3819 ± 0.0720 | |
| *P | 0.345 | 0.028 | 0.028 | 0.753 | 0.173 | ||
| **P | 0.699 | 0.937 | 0.818 | 0.065 | 0.041 | 0.310 | |
| 3 | 0.4712 ± 0.0500 | 0.1840 ± 0.0514 | 0.5686 ± 0.0493 | 0.6424 ± 0.0613 | 0.4812 ± 0.0190 | 0.3659 ± 0.0777 | |
| *P | 0.028 | 0.028 | 0.028 | 0.917 | 0.028 | ||
| **P | 0.485 | 0.818 | 1.000 | 0.002 | 0.589 | 0.485 | |
| 4 | 0.4892 ± 0.0801 | 0.5011 ± 0.0709 | 0.5764 ± 0.0639 | 0.6112 ± 0.0339 | 0.4905 ± 0.0318 | 0.3477 ± 0.0948 | |
| *P | 0.249 | 0.046 | 0.028 | 0.917 | 0.028 | ||
| **P | 0.485 | 0.394 | 0.589 | 0.002 | 0.937 | 0.394 |
* P -values compare the antibody titres of postimplantation with those of preimplantation.
** P -values compare antibody titres of Groups 2–4 with those of Group 1 at each respective time period.
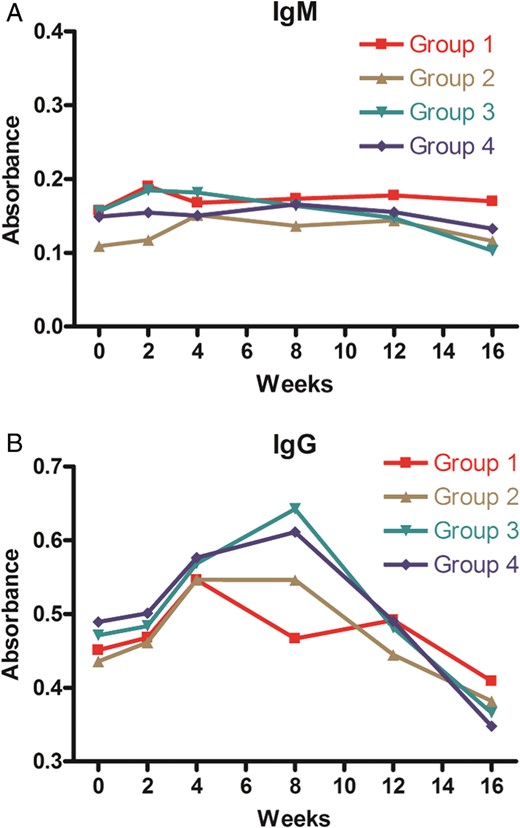
Titres of anti-α-Gal antibodies. Anti-α-Gal IgM and IgG antibody titres are depicted according to groups. Each data point represents mean values of optical density at preimplantation and 2, 4, 8, 12 and 16 weeks after implantation. Error bars were removed in order to aid clarity.
Immediately after implantation, anti-α-Gal IgG antibody titres showed higher levels than preimplantation in Groups 2–4 but the titres did not change significantly in Group 1. When compared with preimplantation levels, the titres increased at 4 weeks ( P = 0.028) and 8 weeks ( P = 0.028) in Group 2. The titres increased at 4 weeks ( P = 0.028) and 8 weeks ( P = 0.028) in Group 3, and increased at 4 weeks ( P = 0.046) and 8 weeks ( P = 0.028) in Group 4. When compared with preimplantation titres, the increased IgG titres were highest at 8 weeks in Groups 2–4 ( P = 0.028 in each group).
Anti-α-Gal IgG titres showed statistically significant differences among the groups at 8 weeks after implantation ( P = 0.001). IgG titres were significantly higher in Groups 3 and 4 than in Group 1 ( P = 0.002, P = 0.002, respectively), and IgG titres in Group 2 were higher with marginal significance than in Group 1 ( P = 0.065).
Microscopic examination
H-E staining showed inflammatory cellular infiltrates disrupting collagen fibres at 16 weeks after implantation in all groups (Fig. 3 ). Group 1 had fewer inflammatory cells than the other groups. Arrays of collagen fibres were denser in Groups 1 and 2 (without decellularization) than in Groups 3 and 4 (with decellularization), and decreased calcific deposits in implanted tissues were observed after decellularization and α-galactosidase treatment.
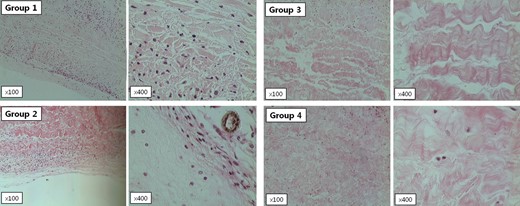
Light microscopic findings (×100 and ×400) of harvested tissue from α-Gal KO mice. All tissues underwent H–E staining. Primate pericardial tissue (Group 1) showed fewer inflammatory cells than bovine pericardial tissue (Group 2), and decellularization and α-galactosidase treatment (Groups 3 and 4) did not significantly increase calcific deposits in the implanted tissue.
Calcium quantification
There were significant differences in calcium quantification among the groups ( P = 0.034). Median calcium levels were significantly higher in Group 2 than in Group 1 (3.86 vs 9.21 μg/mg, P < 0.001). However, median calcium levels were not significantly increased in Groups 3 and 4 when compared with Group 1 (4.09 μg/mg in Group 3, P = 0.904; 5.47 μg/mg in Group 4, P = 0.210) (Table 3 ).
Median calcium levels of tissue implanted into α-Gal KO mice
| Groups | Sample number ( n ) | Ca (μg/mg) | *P | |
|---|---|---|---|---|
| 1 | Primate pericardium; 0.5% GA | 14 | 3.86 (3.625, 4.516) | – |
| 2 | Bovine pericardium; 0.5% GA | 19 | 9.21 (7.329, 13.453) | <0.001 |
| 3 | Bovine pericardium; Decell + 0.5% GA | 20 | 4.09 (2.833, 9.794) | 0.904 |
| 4 | Bovine pericardium; Decell + α-galactosidase + 0.5% GA | 21 | 5.47 (4.105, 7.326) | 0.210 |
* P -values compare the calcium levels of tissue in Groups 2–4 with those in Group 1.
Low-dose X-ray study
The low-dose X-ray study revealed results similar to those in the calcium quantification study. More radio-opaque calcifications were shown in Groups 2–4 than in Group 1 (Fig. 4 ).
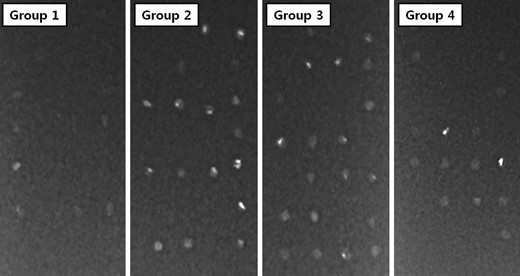
Low-dose X-ray results of tissue implanted into α-Gal KO mice. Groups 2–4 showed more radio-opaque calcifications than Group 1.
DISCUSSION
The present study in an α-Gal KO mouse implantation model revealed three main findings. Firstly, anti-α-Gal IgG antibody titres increased in the bovine pericardial tissue groups, unlike the primate group which did not express the α-Gal epitope, and were highest at 8 weeks after implantation. Secondly, GA-fixed bovine pericardial tissue showed significantly higher calcium levels than GA-fixed primate pericardial tissue. Thirdly, decellularization and α-galactosidase treatment did not significantly increase calcium levels in bovine pericardial tissue when compared with primate pericardial tissue.
Bioprostheses, which are typically made of porcine or bovine tissues, have several clinical advantages over mechanical prostheses; however, their vulnerability to calcification limits their clinical application and usability. Calcification of bioprostheses results from multiple factors, including immunologic, chemical and mechanical factors [ 14 ]. To prevent dystrophic calcification and prolong the durability of bioprostheses, several treatment methods have been studied, including fixation of the tissues using GA, decellularization with surfactants and α-galactosidase treatment [ 2 , 7 , 9–12 ]. Although the exact mechanism leading to degeneration of the implanted bioprosthesis has not yet been fully understood, the inflammatory and thrombogenic changes observed in explanted bioprostheses suggested an immune response, not simply related to surgical trauma [ 15 ]. One histopathological study comparing autologous tissue valves and heterologous pericardial bioprostheses explanted due to structural deterioration demonstrated a higher biocompatibility of autologous tissue valves [ 15 ]. On the contrary, xenoreactive immune responses including Galα1,3-Galβ1-4GlcNAc-R (α-Gal) epitopes and anti-α-Gal antibodies have been found to be important factors in bioprosthesis failure [ 9 , 16 ]. The α-Gal epitope is uniquely expressed in mammals, with the exception of Old World monkeys, apes and humans, probably due to evolutionary reasons [ 17 ]. Mammals that do not express the α-Gal epitope have high titres of antibodies against the α-Gal epitope, but mammals (e.g. pigs and cows) that express the α-Gal epitope do not provoke an anti-α-Gal immune response. To simulate an immune response against xenoantigens in humans, a genetically manipulated α-Gal KO mouse has been used because it does not express the α-Gal epitope and produces antibodies against the α-Gal epitope [ 18 , 19 ].
In the present study, anti-α-Gal IgG antibody titres increased after implantation, and were significantly higher in Groups 2–4 than in Group 1, particularly at 8 weeks after implantation. These findings were similar to a previous study that demonstrated a significantly increased α-Gal-specific IgG 3 months after implantation of bioprostheses [ 20 ]. Since α-Gal KO mice provide an immunological environment similar to the human body, a weaker inflammatory response against primate pericardial tissue than bovine pericardial tissue might occur. In contrast to another study which showed a significant increase of naturally occurring cytotoxic IgM antibodies directed towards α-Gal in patients with porcine valve implantation [ 9 ], anti-α-Gal IgM antibody titres did not show significant changes after implantation when compared with preimplantation levels in both bovine and primate pericardial tissue groups. Our results of increased IgG antibodies without changes of IgM antibodies may have arisen from the small sample size. However, it could be suggested that a more chronic immune response took place at xenotransplantation because IgG antibodies played a role in chronic immune response. In the present study, the antibody titres of Group 2 were not the highest among the groups. That may have resulted from the small number of samples, or from some differences in the fine specificity of natural anti-α-Gal antibodies recognizing various ‘facets’ of an α-Gal epitope in its 3D form [ 17 ]. There is also the possibility that anti-α-Gal antibodies reacted with the BSA of the α-Gal-BSA complex, but not with the α-Gal component during the ELISA, thereby influencing the results of the study. The present study showed that anti-α-Gal IgG antibody titres decreased at 16 weeks after implantation. That may have been due to a postimmune reaction of α-Gal antigen degradation, since ∼60% of foreign antigens have been found to be degraded and resorbed by 3 months [ 21 ]. Microscopic findings, low-dose X-ray results and calcium quantification results in the present study similarly suggested that bovine pericardial tissue showed higher calcification than primate pericardial tissue. Previous studies demonstrated that the interactions between α-Gal epitopes and anti-α-Gal antibodies increased calcification [ 16 , 22 ]. Our study also suggested an immune mechanism as one of major causes of calcification. Among the differently treated bovine pericardial tissues, decellularized and α-galactosidase-treated bovine pericardial tissue did not have significantly increased calcium levels compared with primate pericardial tissue.
LIMITATIONS OF THE STUDY
There are limitations to the present study that must be recognized. Firstly, the number of samples was small and the duration of tissue implantation was relatively short. Secondly, tissue treatments between groups were overlapped, and the effect of a specific treatment could not be analysed individually. Thirdly, the tissues were implanted subcutaneously and were not in direct contact with blood, which would be the case with in vivo implantation. However, the immune response does not necessarily require direct contact with blood. We expected that subcutaneous tissue implantation in mice would be able to reflect in vivo immune response against the xenogeneic tissues.
CONCLUSION
Increased IgG antibody titres in the bovine but not in the primate group suggested that an immune response was involved in the implanted tissue. Decellularization and α-galactosidase treatment of GA-fixed bovine pericardial tissue decreased calcification, and could be effective methods in preventing degenerative failure of bioprostheses.
Funding
This study was supported by a grant of the Korean Health Technology R&D Project, Ministry of Health & Welfare, Republic of Korea (A040004-006).
Conflict of interest: none declared.
REFERENCES
