


Abstract
Lung cancer is the most common cause of cancer-related deaths worldwide. Survival is highly dependent on surgery. Video-assisted thoracoscopic surgery (VATS) is increasingly chosen over open thoracotomy (OT) because of the possible benefits of the minimally invasive approach. Consequently, our aim was to compare the 30-day morbidity and mortality for lung cancer patients operated by VATS lobectomy or lobectomy by OT.
Data were obtained from prospective national and regional databases, including patients who underwent lobectomy for lung cancer in the eastern part of Denmark from 1 January 2005 to 31 December 2011. All patients operated before 2009 were re-staged according to the latest International Association for the Study of Lung Cancer lung cancer classification. Patient characteristics, comorbidities, pathology and operative data were assessed using an independent samples t -test, Pearson's χ2 , Fisher’s exact test and Mann–Whitney test. Morbidity was assessed using multinomial logistic regression adjusted for gender, age, cancer stage, forced expiratory volume in 1 s (FEV1), year of surgery and Charlson comorbidity score.
In total, 1379 patients underwent lobectomy, 785 patients via VATS and 594 patients via thoracotomy. The two groups were similar in gender and FEV1. The patients operated by VATS were older ( P < 0.001), and had a lower Charlson comorbidity score ( P = 0.034), higher frequency of adenocarcinomas ( P < 0.001) and lower cancer stage ( P < 0.001). Among the VATS patients, 285 (36.3%) and among the thoracotomy patients, 288 (48.5%) had minor complications ( P < 0.001); and 157 (20.0%) VATS patients and 212 (35.7%) thoracotomy patients had major complications ( P < 0.001). The 30-day mortality rate was 1% in the VATS group and 1.5% in the thoracotomy group ( P = 0.47). Multinomial logistic regression analysis showed that the prevalence of both minor [odds ratio (OR) = 1.51; 95% confidence interval (Cl) = 1.18–1.96] and major complications (OR = 1.91, 95% Cl = 1.44–2.53) was significantly higher for patients who underwent lobectomy via thoracotomy compared with VATS.
Patients undergoing lobectomy via VATS were less likely to have at least one minor complication within the first 30 postoperative days and less likely to have at least one major complication, compared with patients operated by thoracotomy. These findings remained after adjusting for gender, age, FEV1, cancer stage, year of surgery and Charlson comorbidity score.
INTRODUCTION
Lung cancer is the most common cause of cancer-related deaths worldwide [ 1 ], causing ∼4000 deaths in Denmark every year [ 2 ]. Survival is highly dependent on surgery [ 3 , 4 ]. For many years, the standard approach was an open thoracotomy (OT). In the 1990s, minimally invasive surgery was adapted to lobectomies and the first lobectomy by video-assisted thoracoscopic surgery (VATS) was performed in 1991 [ 5 ]. For the past two decades, VATS has been increasingly used worldwide; however, the frequency varies between countries as well as between institutions [ 3 ]. In Denmark, more than 51% of patients are operated by VATS today [ 6 ]. Controversy remains regarding the place of VATS in the treatment of lung cancer. Only a few small randomized trials have been conducted comparing VATS to OT and it is unlikely that more will be performed, due to the general acceptance of the safety and efficacy of VATS. VATS has been shown to be associated with fewer complications, shorter hospital stay and less surgical morbidity [ 7 , 8 ]; however, some studies found no difference between VATS and OT [ 9 , 10 ]. Consequently, our aim was to compare the 30-day morbidity and mortality of anatomic resection of primary lung cancer between VATS and OT.
MATERIALS AND METHODS
All patients operated between 1 January 2005 and 31 December 2011, in the eastern part of Denmark, were included in the study. In accordance with Danish law, consents were obtained from the Danish Health and Medicine Authority, and the Danish Data Protection Agency. Patients were identified using the Danish Lung Cancer Register, which is a mandatory national register holding information on all patients diagnosed with lung cancer in Denmark [ 2 ]. All data were collected prospectively. Pre-, intra- and postoperative data were collected in a database on patients with primary lung cancer undergoing lobectomy and bilobectomy. All procedures were performed by thoracic surgeons or residents, supervised by a board-certified thoracic surgeon. The VATS procedures were performed by a standardized three-port anterior approach described by Hansen et al . [ 11 ]. The OT procedure was performed by the operating surgeon by either the muscle sparing anterior approach or the postero-lateral approach. Two centres (Rigshospitalet and Gentofte Hospital) performed the surgeries during 2005–08 and the treating centre was determined by the geographic residence of the patient. Gentofte Hospital was the only centre offering VATS to treat lung cancer; therefore the surgical approach was determined both by the treating centre and by patient characteristics as described in Hansen et al . [ 11 ]. Contraindications to the VATS approach were T3 or T4 tumours, tumours larger than 6 cm, tumours visible in the bronchus by bronchoscopy within 2 cm of the origin of the lobe to be resected and where a possible Sleeve resection might be needed, and centrally placed tumours in the hilum and adherent to vessels. From 2009 to 2011, all patients were operated at Rigshospitalet, due to aggregation of the two departments. They were operated by either VATS or OT.
In Denmark, follow-up is possible through a personal identification number linking patients to national registries which hold information on all hospital admissions and deaths. As a quality control of our database, hospital charts were reviewed in 2013 for all patients in the 30-day postoperative period and missing data were added to the database. All tumour node and metastasis were transformed to the 7th edition of The International Association for the Study of Lung Cancer by re-evaluation of the pathology reports from 1 January 2005 to 1 December 2009 using the National Pathology Report System (CGI) [ 12 ].
Baseline variables included: comorbidities and type of surgery, and patient demographics: gender, age, Charlson comorbidity score [ 13 ], forced expiratory volume in 1 s (FEV1), lobe resected, cancer stage and histology (adenocarcinoma, squamous, carcinoid, non-small-cell lung cancer (large cell, adenosquamous, sarcomatoid), and small-cell lung cancer). The outcomes of interest were 30-day mortality and morbidity, i.e. perioperative complications and postoperative complications. Complications were divided into minor and major as presented in Table 3 . The VATS procedures that were converted to OT were analysed with the VATS group.
All statistic analyses were performed with the Statistical Package for the Social Sciences 19.0 statistical analysis software (SPSS, Chicago, IL, USA). All continuous variables were reported with means and standard deviations and compared by independent samples t -tests or by medians and range and compared with the Mann–Whitney test. All categorical variables were expressed as frequencies and compared by Person’s χ2 or Fisher’s exact test. The multivariate analysis was performed by multinomial logistic regression with adjustment for gender, age, cancer stage, FEV1, year of surgery and Charlson comorbidity score. All tests were two-sided and considered significant when P < 0.05.
RESULTS
In total 1379 patients with primary lung cancer underwent anatomic pulmonary resection from 2005 to 2011. VATS was performed on 785 (56.9%) patients and OT on 594 (43.1%) patients. Approximately 30% of the patients were operated by VATS in the beginning of the study period and the number increased to 80% by the end of 2011 (Fig. 1 ).
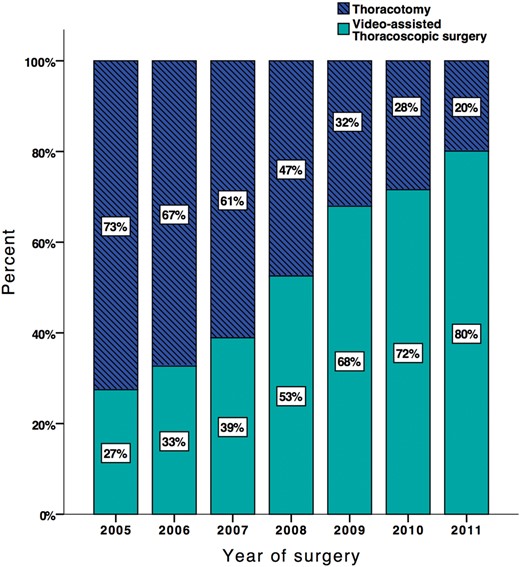
Percentage of operations per year divided by surgery method: video-assisted thoracoscopic surgery and thoracotomy, N = 1379.
No differences were seen in gender and FEV1 between patients operated by VATS and OT. Patients operated by VATS were older ( P < 0.001), and had a lower Charlson comorbidity score ( P = 0.034), a higher frequency of adenocarcinomas ( P < 0.001), smaller tumours ( P < 0.001) and a lower cancer stage ( P < 0.001) (Table 1 ).
Preoperative clinical data in the thoracotomy group and in the VATS group, reported as percentages, mean and SD or medians and range
| Clinical data | Thoracotomy group | VATS group | P -value* |
|---|---|---|---|
| Cases | 594 (43.1%) | 785 (56.9%) | |
| Sex | |||
| Male (mean) | 307 (45.1%) | 373 (56.9%) | |
| Female (mean) | 287 (41.1%) | 412 (58.9%) | 0.125 |
| Age (years; mean) | 64 (SD 10) | 66 (SD 9) | <0.001 |
| Charlson comorbidity score (median) | 1 (0–10) | 0 (0–9) | 0.034 |
| FEV1 litre per second (median) | 2.18 (0.95–4.64) | 2.10 (0.96–4.63) | 0.178 |
| Tumour size (millimetre) (median) | 38 (0–190) | 24 (4–95) | <0.001 |
| Lobectomy | |||
| RUL | 282 (62.0%) | 173 (38.0%) | <0.001 |
| RML | 20 (32.8%) | 41 (67.2%) | |
| RLL | 123 (46.4%) | 142 (53.6%) | |
| LUL | 145 (42.8%) | 194 (57.2%) | |
| LLL | 96 (47.1%) | 108 (52.9%) | |
| RUL + RML | 13 (56.5%) | 10 (43.5%) | |
| RLL + RML | 24 (75%) | 8 (25%) | |
| Histology type | |||
| Adenocarcinoma | 304(36.2%) | 536 (63.8%) | <0.001 |
| Squamous carcinoma | 182 (53.4%) | 158 (46.6%) | |
| NSCLC | 70 (57.9%) | 51 (42.1%) | |
| Small-cell carcinoma | 1 (14.3%) | 6 (85.7%) | |
| Carcinoid | 33 (50%) | 33 (50%) | |
| pTNM stage | |||
| 1a | 101 (28.4%) | 255 (71.6%) | <0.001 |
| 1b | 162 (33.4%) | 323 (66.6%) | |
| 2a | 114 (52.3%) | 104 (47.7%) | |
| 2b | 79 (76.7%) | 24 (23.3%) | |
| 3a | 99 (63.9%) | 56 (36.1%) | |
| 3b | 19 (65.5%) | 13 (40.6%) | |
| 4 | 19 (65.5%) | 10 (34.5%) | |
FEV1: forced expiratory volume in 1 s; RUL: right upper lobe; RML: right middle lobe; RLL: right lower lobe; LUL: left upper lobe; LLL: left lower lobe; NSCLC: non-small-cell lung cancer; pTNM: pathology tumour, node and metastasis; VATS: video-assisted thoracoscopic surgery; SD: standard deviation.
*Two-sided P -value, compared by χ2 test for categorical variables and t -test or the Mann–Whitney U -test for continuous variables.
In comparison with OT, the patients operated by VATS had less perioperative blood loss: 100 vs 300 ml ( P < 0.001), and a shorter operating time: 125 vs 155 min ( P < 0.001). They had more N2 stations removed: 3.21 vs 2.77 ( P < 0.001), had their chest tube removed earlier: 3.00 vs 4.00 days ( P < 0.001), and had a shorter postoperative stay: 5.00 vs 7.00 ( P < 0.001) (Table 2 ).
Peri- and postoperative clinical parameters in the thoracotomy group and in the VATS group, reported as percentages, mean and SD or medians and range
| Clinical parameters | Thoracotomy group | VATS group | P -value* |
|---|---|---|---|
| Intraoperative blood loss (ml; median) | 300 (0–11 000) | 100 (0–3500) | <0.001 |
| Operating time (median) | 155 (55–405) | 125 (42–360) | <0.001 |
| Lymph node station 2 dissection (number; mean) | 2.77 (SD 1.19) | 3.21 (SD 1.05) | <0.001 |
| Postoperative pleural cavity drainage (day; median) | 4.00 (1–100) | 3.00 (0–101) | <0.001 |
| Postoperative stay (days; median) | 7.00 (2–61) | 5.00 (1–65) | <0.001 |
| Conversions to thoracotomy | – | 35 (4.5%) | |
| Re-do operation | 31 (5.2%) | 33 (4.2%) | 0.375 |
| Reason for re-do operation | |||
| Bleeding | 17 (2.9%) | 14 (1.8%) | 0.449 |
| Torsion of the lobe | 1 (0.2%) | 1 (0.1%) | |
| Prolonged air leakage | 5 (0.8%) | 10 (1.3%) | |
| Decortication | 1 (0.2%) | 3 (0.4%) | |
| Surgery not radical | 2 (0.3%) | 0 | |
| Other | 5 (0.8%) | 5 (0.6%) | |
VATS: video-assisted thoracoscopic surgery; SD: standard deviation.
*Two-sided P -value compared by χ2 test for categorical variables and t -test or the Mann–Whitney U -test for continuous variables.
A total of 285 VATS patients (36.3%) and 288 thoracotomy patients (48.5%) had minor complications, P < 0.001. Patients operated by VATS had a lower frequency of atrial fibrillation, pneumonia, infections of unknown specification, seroma and decubitus ulcers. A total of 157 VATS patients (20.0%) and 212 thoracotomy patients (35.7%) had major complications, P < 0.001. Patients operated by VATS had a lower frequency of blood transfusions, renal failure, costa fractures, sepsis, need for intensive care treatment, recurrent laryngeal nerve paresis and wound revision (Table 3 ).
Postoperative complications in the thoracotomy group and in the VATS group, reported as percentages
| Complication | Thoracotomy group | VATS group | P -value |
|---|---|---|---|
| Minor complications | 288 (48.5%) | 285 (36.3%) | <0.001 |
| Atrial fibrillation | 89 (15.0%) | 55 (7.0%) | <0.001 |
| Pneumonia | 63 (10.6%) | 59 (7.5%) | 0.045 |
| Decubitus a | 4 (0.7%) | 0 | 0.034 |
| Infection without specification | 50 (8.4%) | 21 (2.7%) | <0.001 |
| Seroma | 29 (4.9%) | 0 | <0.001 |
| Major complications | 212 (35.7%) | 157 (20.0%) | <0.001 |
| Transfusion | 138 (23.2%) | 55 (7.0%) | <0.001 |
| Renal failure | 17 (2.9%) | 10 (1.3%) | 0.014 |
| Dialysis | 5 (0.8%) | 1 (0.1%) | |
| Costa fracture a | 8 (1.3%) | 1 (0.1%) | 0.006 |
| Sepsis | 9 (1.5%) | 3 (0.4%) | 0.025 |
| Intensive care unit | 24 (4.0%) | 12 (1.5%) | 0.004 |
| Recurrent nerve paresis | 18 (3.0%) | 11 (1.4%) | 0.037 |
| Wound revision a | 4 (0.7%) | 0 | 0.034 |
Two-sided P -value. Minor complications with a P -value > 0.05: Prolonged air leak (more than 7 days), extra drain, pleuracentesis, wound infection, gastritis, atelectasis, fungal infection, urinary tract infection and chylothorax. Major complications with a P -value > 0.05: Re-admission, pulmonary oedema, empyema, GI bleeding, gastroscopy, acute myocardial infarction, peripheral thrombosis, pressure pneumothorax, ventilator, tracheotomy, permanent need of oxygen, bronco-pulmonary fistula, cardiac arrest, pacemaker, pulmonary embolism, ileus, apoplexia and oesophageal perforation.
VATS: video-assisted thoracoscopic surgery.
a Fisher’s exact test.
b More than 7 days.
The multinomial logistic regression analysis adjusted for cancer stage, age, Charlson comorbidity score, gender, year of surgery and FEV1 (Tables 4 and 5 ) showed an odds ratio (OR) for both minor and major complications significantly higher for patients who underwent OT compared with VATS [adjusted OR = 1.51, 95% confidence interval (Cl) = 1.18–1.96] and (adjusted OR = 1.91; 95% Cl = 1.44–2.53). Stratified analyses on stage, gender and age showed that patients with Stage 1 lung cancer undergoing OT had an adjusted OR for minor and major complications of 1.55 (95% Cl = 1.09–2.21, P = 0.014) and 1.89 (95% Cl = 1.28–2.78, P = 0.001), respectively, compared with patients undergoing VATS. The adjusted ORs for Stage II patients were 1.82 (95% Cl = 1.08–3.07, P = 0.024) and 2.03 (95% Cl = 1.16–3.58, P = 0.014). Male and female patients undergoing OT had an adjusted OR of, respectively, 1.65 (95% Cl = 1.16–2.36, P = 0.005) and 1.47 (95% Cl = 1.00–2.14, P = 0.048) for minor complications and, respectively, 2.27 (95% Cl = 1.53–3.35, P < 0.001) and 1.64 (95% Cl = 1.07–2.51, P = 0.023) for major complications compared with VATS. Patients below and above the age of 70 undergoing OT had an adjusted OR of, respectively, 1.48 (95% Cl = 1.08–2.03, P = 0.015) and 1.54 (95% Cl = 0.98–2.41, P = 0.063) for minor complications, and 1.70 (95% Cl = 1.19–2.43, P = 0.004) and 2.22 (95% Cl = 1.37–3.58, P = 0.001) for major complications compared with VATS. The 30-day mortality rate was also higher in the thoracotomy group [1.5% (9 patients)] compared with the VATS group [1% (8 patients)] although not significant ( P = 0.47).
Unadjusted and adjusted odds ratios and 95% CIs for minor complications by multinomial logistic regression a
| Variable | Unadjusted odds ratio | 95% Cl | Adjusted odds ratio b,c | 95% CI | P -value b |
|---|---|---|---|---|---|
| Surgical approach | |||||
| VATS | 1 | 1 | |||
| Thoracotomy | 1.65 | 1.33–2.05 | 1.51 | 1.18–1.96 | 0.001 |
| Age | 1.01 | 0.99–1.02 | 1.00 | 0.99–1.02 | 0.708 |
| Gender | |||||
| Male | 1 | 1 | |||
| Female | 0.65 | 0.53–0.81 | 0.57 | 0.44–0.75 | 0.001 |
| Charlson comorbidity score | 1.16 | 1.06–1.27 | 1.10 | 1.01–1.22 | 0.025 |
| Cancer stage | |||||
| 1a | 1 | 1 | |||
| 1b | 1.03 | 0.78–1.36 | 0.97 | 0.72–1.29 | 0.258 |
| 2a | 1.10 | 0.78–1.55 | 0.96 | 0.67–1.37 | 0.972 |
| 2b | 1.24 | 0.79–1.93 | 0.98 | 0.61–1.58 | 0.848 |
| 3a | 1.24 | 0.85–1.82 | 1.10 | 0.74–1.65 | 0.791 |
| 3b | 2.24 | 1.07–4.68 | 1.96 | 0.92–4.19 | 0.799 |
| 4 | 1.08 | 0.50–2.33 | 1.07 | 0.48–2.37 | 0.879 |
| FEV1 | 1.14 | 0.97–1.32 | 1.36 | 1.11–1.67 | 0.003 |
| Year of surgery | |||||
| 2005 | 1.35 | 0.88–2.06 | 1.08 | 0.68–1.96 | 0.751 |
| 2006 | 2.13 | 1.34–3.24 | 1.67 | 1.07–2.61 | 0.024 |
| 2007 | 1.16 | 0.78–1.73 | 0.93 | 0.61–1.41 | 0.711 |
| 2008 | 0.93 | 0.62–1.39 | 0.81 | 0.53–1.23 | 0.318 |
| 2009 | 1.09 | 0.74–1.59 | 1.08 | 0.73–1.60 | 0.699 |
| 2010 | 0.95 | 0.66–1.35 | 0.89 | 0.62–1.28 | 0.519 |
| 2011 | 1 | 1 | |||
VATS: video-assisted thoracoscopic surgery; FEV1: forced expiratory volume in 1 s; 95% CIs: 95% confidence intervals.
a The odds of having one or more minor complications compared with no complications.
b Adjusted for age, gender, FEV1, stage, year of surgery and Charlson comorbidity score.
c Log likelihood for the adjusted analysis = 1794.81.
Unadjusted and adjusted odds ratios and 95% CIs for major complications by multinomial logistic regression a
| Variable | Unadjusted odds ratio | 95% Cl | Adjusted odds ratio b,c | 95% Cl | P -value b |
|---|---|---|---|---|---|
| Surgical approach | |||||
| VATS | 1 | 1 | |||
| Thoracotomy | 2.22 | 1.74–2.83 | 1.91 | 1.44–2.53 | <0.001 |
| Age | 1.02 | 1.01–1.04 | 1.02 | 1.00–1.03 | 0.029 |
| Gender | |||||
| Male | 1 | 1 | |||
| Female | 0.72 | 0.57–0.92 | 0.62 | 0.47–0.84 | 0.002 |
| Charlson comorbidity score | 1.15 | 1.05–1.26 | 1.08 | 0.98–1.19 | 0.025 |
| Cancer stage | |||||
| 1a | 1 | 1 | |||
| 1b | 1.26 | 0.92–1.74 | 1.24 | 0.88–1.73 | 0.397 |
| 2a | 1.43 | 0.98–2.10 | 1.17 | 0.78–1.75 | 0.983 |
| 2b | 1.81 | 1.12–2.92 | 1.39 | 0.83–2.32 | 0.942 |
| 3a | 1.59 | 1.04–2.43 | 1.40 | 0.89–2.20 | 0.642 |
| 3b | 1.17 | 0.51–2.71 | 0.87 | 0.37–2.05 | 0.727 |
| 4 | 1.32 | 0.57–3.10 | 1.44 | 0.60–3.46 | 0.403 |
| FEV1 | 1.34 | 1.04–1.50 | 1.37 | 1.08–1.72 | 0.005 |
| Year of surgery | |||||
| 2005 | 1.82 | 1.14–2.93 | 1.39 | 0.83–2.32 | 0.205 |
| 2006 | 2.35 | 1.48–3.72 | 1.70 | 1.04–2.78 | 0.027 |
| 2007 | 1.79 | 1.15–2.78 | 1.38 | 0.86–2.21 | 0.172 |
| 2008 | 1.72 | 1.10–2.70 | 1.49 | 0.93–2.40 | 0.083 |
| 2009 | 0.89 | 0.56–1.42 | 0.88 | 0.54–1.43 | 0.478 |
| 2010 | 1.13 | 0.74–1.72 | 1.03 | 0.67–1.59 | 0.838 |
| 2011 | 1 | 1 | |||
VATS: video-assisted thoracoscopic surgery; FEV1: forced expiratory volume in 1 s; 95% CIs: 95% confidence intervals.
a The odds of having one or more major complications compared with no complications.
b Adjusted for age, gender, FEV1, stage, year of surgery and Charlson comorbidity score.
c Log likelihood for the adjusted analysis = 1505.40.
DISCUSSION
In this large study, we found that patients operated by VATS had significantly lower prevalence of both minor and major complications, which included atrial fibrillation, pneumonia, renal failure, sepsis, costa fracture and need for intensive care unit, even after adjustment for other risk factors. Similar findings were reported in other studies [ 9 , 14–17 ]. Our multivariate analysis showed that the surgery method had larger impact on the prevalence of complications than gender, age, cancer stage, comorbidity, year of surgery and FEV1. Furthermore, the surgery method was minimally affected by adjustment, suggesting that it is an important factor in determining the OR of having both minor and major complications. Our stratified analysis did not change the ORs significantly supporting the hypothesis.
Despite evidence of the feasibility of VATS in treatment of lung cancer, great variability remains when it comes to choosing the surgical approach. In this large study, the frequency of VATS lobectomy increased from 30 to 80% throughout the study period. In the USA from 6 up to 80% of patients are operated by VATS, depending on the hospital and whether the operation is performed by a thoracic-, vascular- or general surgeon [ 10 , 14 ]. This indicates that VATS has not gained a widespread acceptance amongst surgeons. It could be due to a long learning curve, perceived longer operation time or lack of experience in management of intraoperative complications [ 10 , 18 ]. The fact that many studies are conducted at high-volume teaching hospitals may make surgeons at rural hospitals question the generalizability of these studies, and therefore hesitate to choose the VATS procedure. Nevertheless, Phillips et al . and Paul et al . found that improved outcome was not limited to thoracic surgeons or teaching hospitals, respectively, and that high-volume hospitals had equivalent complication rates to low-volume hospitals [ 14 , 15 ], suggesting that more operations could be performed by VATS.
The factors determining which surgical method was selected for the patients cannot be accounted for by our study design, as we did not do a randomized controlled trial and therefore selection bias cannot be disregarded. In Denmark, the treating hospital is determined by the geographic residence of the patient, limiting selection bias such as race and income, which have been shown to affect the type of surgery chosen for the patient [ 10 , 14 , 15 ]. We used the multivariate analysis to account for factors known to affect the type of surgery. Furthermore, our baseline cohort was very similar, with few exceptions. Patients operated by VATS were older, and had a lower cancer stage, slightly lower Charlson comorbidity score, smaller tumours and a higher frequency of adenocarcinoma. These findings are in accordance with several studies [ 9 , 15 , 19 , 20 ]; however, confounding by indication cannot be disregarded due to these differences. The multi-institutional- and the national studies by Philips et al . and Paul et al ., respectively, did not include cancer stage [ 14 , 15 ]. Furthermore, many studies have been limited to Stage 1 lung cancer [ 16 , 17 , 19 , 21 ]. Cancer stage could be a predictor for intraoperative complications; a higher stage is often associated with a larger and more centrally placed tumour, making the risk of damaging the large vessels greater when dissecting the lobe. This may explain our finding that OT is associated with a larger operative blood loss and a greater need for blood transfusion [ 22 , 23 ]. We accounted for tumour heterogeneity in our multivariate analysis by adjusting for cancer stage and by excluding Stages 1 and 2 in our subanalysis.
We found both the duration of surgery and the postoperative stay to be shorter for the VATS group. These findings were reported in several studies [ 14 , 21 , 22 ]. Philips et al . found that OT was in favour of VATS with regard to duration of surgery. This could be explained by the heterogeneous group of surgeons representing thoracic-, general- and vascular surgery. Another important point is the difference in the frequency of VATS between the participating centres [ 15 ]. Several studies have found VATS to be associated with less surgical trauma, reduced pain and reduced costs [ 7 , 8 , 14 , 16 , 19 , 22 , 24 ], suggesting a great potential in choosing the VATS procedure in the treatment of lung cancer. This may potentially be of great importance for patients, thereby being able to start chemotherapy within 6 weeks as recommended and possibly tolerate the treatment better.
A common criticism of VATS is that proper lymph node sampling may not be possible [ 16 ]. Merritt et al . showed that a higher number of lymph nodes were dissected with OT compared with VATS [ 19 , 23 ]. A study found a higher frequency of postoperative upgrading of N -stage from N0 to N1/N2. This could be a result of the number of lymph nodes dissected [ 20 ]. In our study, however, we found that the number of N2 lymph node stations dissected were in fact higher in the VATS group, indicating that the oncological principles were upheld.
The conversion rate at our centre was 4.6%; however, studies have reported much higher rates [ 9 , 15 , 19 , 22 ]. Several studies excluded converted patients [ 8 , 14 , 21 ], which could skew the complication rate in favour of VATS—in this study the converted patients were analysed with the VATS group.
In our study, we found a higher 30-day mortality in the OT group; however, this has not shown to be significant. Our findings are in accordance with several studies [ 8 , 14 , 15 , 19 ]. A large-scale study with longer follow-up is necessary to assess the possible associations with mortality.
Our study has several limitations. First, despite our prospective data collection, the size of the study cohort and our multivariate regression analysis, it cannot replace a randomized clinical trial. Second, our database is administrative and therefore is highly dependent on the quality of data entered. However, hospital charts were reviewed in 2013 for all patients, both for our centres and for any other hospital admission. This allowed us to collect missing data and correct misclassifications, which strengthens the quality of our database. Third, the study is limited to short-term patient outcomes, and so further studies have to be conducted, to assess long-term outcomes and oncological efficacy. Fourth, there have been advances in the surgery methods during the study period, making year of surgery a possible confounder for 30-day morbidity and mortality. In our study, there was a difference in the chosen surgery method dependent on the year; therefore, year of surgery might favour the outcome of VATS over OT. To minimize bias, we adjusted for year of surgery in our multinomial analysis.
In conclusion, patients undergoing lobectomy via VATS were less likely to have at least one minor complication within the first 30 postoperative days and less likely to have at least one major complication, compared with patients operated by thoracotomy. These findings remained after adjusting for gender, age, FEV1, cancer stage, year of surgery and Charlson comorbidity score. Our findings are potentially of clinical importance since VATS patients may be able to start chemotherapy within the recommended time period, thereby potentially reducing their progression-free survival and overall survival. We are planning a follow-up of this cohort to look at these factors.
Funding
All funding to the data collection and statistical analysis was provided by the Department of Cardio-Thoracic Surgery, Rigshospitalet, Blegdamsvej 9, 2100 CopenhagenØ, Denmark.
Conflict of interest: Rene Petersen and Henrik Jessen are speakers at Covidien.
REFERENCES
