


Abstract
Right ventricular (RV) failure is a major cause of morbidity and mortality after left ventricular assist device (LVAD) placement and remains hard to predict. We hypothesized that partial surgical exclusion of the RV with a modified Glenn shunt during LVAD treatment would reduce RV stroke work.
An LVAD was implanted in eight pigs and a modified Glenn shunt was constructed. A conductance pressure–volume catheter was placed in the right ventricle through the apex. Haemodynamic data and pressure–volume loops were obtained at the following time periods: (i) baseline, (ii) open shunt, (iii) LVAD with closed shunt and (iii) LVAD and open shunt.
During LVAD therapy, the right atrial (RA) pressure increased from 9 mmHg (9–9) to 15 mmHg (12–15), P = 0.01. RV stroke volume increased from 30 ml (29–40) to 51 ml (42–53), P < 0.01. Also, RV stroke work increased to 708 mmHg ml (654–1193) from 535 mmHg ml (424–717), P = 0.04, compared with baseline. During LVAD therapy in combination with a Glenn shunt, the RA pressure decreased from 15 mmHg (12–15) to 10 mmHg (7–11) when compared with LVAD therapy only, P = 0.01. A decrease in RV stroke work from 708 mmHg ml (654–1193) to 465 mmHg ml (366–711), P = 0.04, was seen when the LVAD was combined with a shunt, not significantly different from the baseline value (535 mmHg ml). The developed pressure in the right ventricle decreased from 29 mmHg (26–32) to 21 mmHg (20–24), P < 0.01. The pressure–volume loops of the RV show a significant reduction of RV stroke work during the use of the shunt with LVAD treatment.
A modified Glenn shunt reduced RV volumes, RV stroke work and RA pressure during LVAD therapy in an experimental model of heart failure in pigs.
INTRODUCTION
Left ventricular assist device (LVAD) treatment has become the standard therapy for end-stage heart failure, most often as a bridge to transplant but also as destination therapy. Despite the clinical and physiological benefits of LVAD therapy, right ventricular (RV) failure of varying degree occurs in ∼20% of patients, and causes substantial morbidity and mortality [ 1–3 ].
In addition, the lack of donor hearts is an increasing issue leading to prolonged LVAD therapy in a number of patients and thereby increased risk for late RV failure. LVAD treatment might also worsen pre-existent or subclinical RV failure, and in many patients, RV failure becomes clinically evident once LVAD support has been initiated.
The standard therapy for RV failure includes inotropic support and right ventricular assist device (RVAD). Although results with RVAD therapy have improved over time to even include long-term treatment in selected cases, the fact still remains that patients in need of RVAD have reduced survival and complications include bleeding, infection and multiple organ failure. Several studies have been conducted with the purpose of establishing risk factors or risk scores for identification of patients at a high risk for RV failure, but many aspects of this problem still remain unsolved.
One of the important preoperative risk factors for RV failure on the LVAD is a preoperative low RV stroke work (RVSW), which prevents the RV from adapting to the increased haemodynamic burden on it when LVAD therapy is initiated.
Surgical exclusion of RV volume has been proven possible in the staged palliation of congenital heart defects when there is no left ventricular impairment and the pulmonary vascular resistance (PVR) is low [ 4 ]. This principle has been used for decades, with a Glenn shunt followed by the Fontan procedure or total cavopulmonary connection [ 5 ]. Moreover, some case reports describe successful relief of ischaemic RV failure in adults undergoing heart surgery by volume unloading of the RV with a shunt [ 6–8 ]. With regard to LVAD patients with preoperative low or normal PVR, volume unloading of the RV with a shunt could be an additional strategy in ∼40% of the candidates [ 9 , 10 ] when managing intraoperative RV failure.
This study investigates the possibility of using the strategy with a modified Glenn shunt to reduce the increased volume load on the RV induced by LVAD treatment in an experimental model. We hypothesize that partial surgical exclusion of the RV volume with a Glenn shunt during LVAD treatment would reduce RV stroke work.
MATERIALS AND METHODS
The study was approved by the Uppsala University Ethical Committee on Laboratory Animal Research. All animals received humane care in compliance with the European Convention on Animal Care and the Principles of Laboratory Animal Care. These principles are formulated by the National Society for Medical Research and the ‘Guide for the Care and Use of Laboratory Animals’ prepared by the Institute of Laboratory Animal Resources and published by the National Institutes of Health (NIH Publication No. 86-23, revised 1996). The study comprised eight pigs of Swedish country breed with a mean weight of 34 kg (31–39).
Anaesthesia
The method of anaesthesia has been described in previous studies of ours [ 11 , 12 ]. The animals were intubated and thereafter ventilated with 40% oxygen through a Siemens Servo-i ventilator (Maquet GmbH & Co., KG, Rastatt, Germany). Ventilation was volume controlled and aimed for an arterial pCO 2 between 5.0 and 5.5 kPa. Moreover, a positive end-expiratory pressure of 5 cm was used. General anaesthesia was induced by a subcutaneous injection of xylazine (Rompun® 2.2 mg/kg, Bayer A/S, Lyngby, Denmark), and tiletamine/zolazepam (Zoletil 100® 6.0 mg/kg, Virbac S.A., Carros, France). Anaesthesia was then maintained by infusion of a buffered glucose carrier (Rehydrex® with glucose 25 mg/ml, Fresenius Kabi AB, Uppsala, Sweden), fentanyl 0.04 mg/kg/h (Fentanyl 50 µg/ml, B Braun Medical AB, Danderyd, Sweden), ketamine 30 mg/kg/h (Ketaminol Vet® 100 mg/ml, Intervet AB, Stockholm, Sweden), midazolam 0.1 mg/kg/h (Midazolam Hameln 1 mg/ml, AlgolPharma AB, Kista, Sweden) and pancuronium bromide 0.3 mg/kg/h (Pavulon® 2 mg/ml, Schering-Plough AB, Stockholm, Sweden).
Body temperature was stabilized with a heating pad, aiming for a core temperature of 37°C. A silicone catheter was used to catheterize the urinary bladder.
The jugular vein was catheterized (BD Careflow 17 G) for blood sampling, monitoring of central venous pressure and administration of drugs. A pulmonary artery (PA) catheter (BD Criticath™ Pulmonary Artery/Thermodilution Catheter) was inserted through the right jugular vein and placed into the pulmonary artery. Continuous monitoring of the arterial blood pressure with a pressure transducer (BD Careflow 20G; Becton-Dickinson AB, Stockholm, Sweden) was undertaken with a catheter in the left femoral artery.
Surgical preparation
A median sternotomy was performed. The pericardium was opened and pericardial stay sutures were placed. The azygos and hemiazygos veins were ligated. Pressure transducer catheters were surgically placed in the right atrium (RA) and the RV. The catheters were connected to a monitoring system (Dräger Infinity Delta). A 5-French 12-electrode pressure–volume conductance catheter (Ventri-Cath, Millar Instruments, MI, USA) was introduced in the RV apex and advanced to a level just below the pulmonary valve. The catheter was fixed with a purse-string suture and connected to the Millar Pressure Volume Systems (MPVS) Ultra analysing system. Proper catheter positioning was determined by monitoring individual segmental pressure–volume loops. Extra ventricular segments were excluded from analysis. Animals were heparinized with a bolus of 7500 IU once.
The modified Glenn shunt was created by connecting the superior vena cava (SVC) to the main PA with a 12 mm Dacron vascular graft (Gelsoft™, Vascutek Inchinnan, Scotland, UK). A side-biting clamp was placed first on the SVC and then on the main PA and thereafter the vessels were opened longitudinally and anastomosed with a 4-0 running suture. The clamp was released and the patency of the shunt was evaluated with a 12 mm ultrasonic flow probe (VeriQ Perivascular 12 mm, MediStim ASA, Oslo, Norway). The graft was then closed with a vascular clamp. When the shunt was put in use, the vascular clamp was removed from the shunt, and the SVC was then clamped below the shunt, directing all blood from the SVC to the main PA through the modified Glenn shunt (Fig. 1 ).
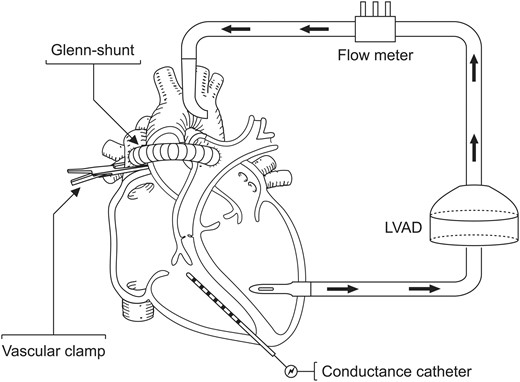
Animal preparation; a modified Glenn shunt was created between the SVC and the main pulmonary artery. A left ventricular assist device was implanted. Pressure volume loops were obtained throughout the experimental model in pigs ( n = 8).
The left ventricular apex was cannulated with a 28-Fr venous cannula (Malleable Single Stage Venous Cannula, Edwards Lifesciences) and a 16-Fr arterial cannula (FemFlex, Edwards Lifesciences) was inserted into the ascending aorta. The cannulas were secured with purse-string sutures. The left ventricular apex cannula was connected to the inflow tubing of a preprimed Bio-Pump (Medtronic). The aortic cannula was deaired and connected to the outflow tubing of the Bio-Pump. A Bio-Pump flow probe connector (Medtronic) was connected via the tubing to the aortic cannula.
Measurements
Standard lead II electrocardiogram (ECG), heart rate (HR), mean systemic arterial blood pressure (MAP), RA pressure, RV pressure, LA pressure and PA pressure were monitored continuously and recorded. Cardiac output (CO) was measured to 3.3 l/min (range, 2.8–3.4) at baseline using the thermodilution technique. The pressure–volume catheter was calibrated for blood resistivity using a rho-cuvette (Millar Instruments, MI, USA) and the alpha-value was calculated using the thermodilution-derived CO for each animal. Pressure–volume loops from the RV were recorded for 25 consecutive heartbeats with the ventilation suspended at end-expiration. Haemodynamic measurements and pressure–volume curves were recorded at the following time periods: (i) at baseline, (ii) at shunting, (iii) with the LVAD and a closed Glenn shunt and (iv) with the LVAD and an open Glenn shunt. The CO values presented in the results are derived from the pressure–volume curves.
Blood samples were collected at the same time points for blood gas analysis. Arterial blood gases, haemoglobin concentration (Hb) and mixed venous oxygen saturation (SvO 2 ) were measured with an ABL 500 Radiometer, Medical ApS, Bronshoj, Denmark.
Experimental protocol
Shunt
The clamp on the vascular graft was released and the SVC was clamped at the junction with the RA to direct all blood flow from SVC to the main PA. Shunt flow was measured with a 12 mm ultrasonic flow probe. The Glenn shunt was opened for 20 min and thereafter measurements were performed.
Left ventricular assist device
The Glenn shunt was closed and the clamp on the SVC was released. The LVAD was started and set to a flow corresponding to the baseline CO of each animal measured with the thermodilution technique. This was continued for 20 min and thereafter measurements were performed.
Left ventricular assist device combined with a modified Glenn shunt
The clamp on the Glenn shunt was released and the SVC was clamped at the junction with the RA to direct all blood flow from SVC to the main PA. Shunt flow was measured with a 12 mm ultrasonic flow probe. Measurements were recorded after 20 min of stabilization.
Data analysis and statistical methods
For pressures (i.e. SVCP, RAP, mPAP and MAP), HR, LVAD flow and Glenn-shunt flow, the value for each pig was calculated as the mean of all measurements for each treatment period, and data are expressed as medians with interquartile ranges in brackets. For blood gas measurements (i.e. pH, PO 2 , PCO 2 , SBE, SaO 2 , SvO 2 and Hb) the data are expressed as medians with interquartile ranges in brackets, based on the value obtained for each pig in each treatment period.
Data analysis of the pressure–volume loops was performed using Lab Chart™ software (AD Instruments Pty Ltd, Bella Vista, NSW, Australia). As there was no calibration for parallel conductance, the baseline RV ejection fraction was estimated to be 0.6 and the volumes were calibrated according to this figure. With regard to conductance catheter-derived values, the mean value of the loops for each pig in each treatment period was used. The data are expressed as medians with interquartile ranges in brackets. Statistical analysis was conducted using the statistical software R (v. 3.1.1). Non-parametric tests were used due to the small sample size. Comparison was done between (i) baseline versus LVAD and (ii) LVAD versus LVAD and modified Glenn shunt, using the Wilcoxon signed-rank test. P -values ≤0.05 were considered statistically significant.
RESULTS
All eight pigs survived the experiment and were included in the study.
Baseline
All animals were in a stable haemodynamic state at baseline. The MAP was 86 mmHg (74–99), SvO 2 was 58% (46–62) and CO was 2.8 l/min (2.3–3.2), as depicted in Table 1 . RA pressure was 9 mmHg (9–9) (Fig. 2 ). Systolic RV pressure was 31 mmHg (28–33) and diastolic RV pressure was 7 mmHg (6–7) at baseline. RV end-diastolic volume was 50 ml (49–67) and RV stroke volume was 30 ml (29–40), as shown in Figs 3 and 4 . Moreover, RV stroke work at baseline was 535 mmHg ml (442–717) (Fig. 5 ). The pressure development (Pdev) in the RV was 26 mmHg (22–28), as shown in Fig. 6 . The representative pressure–volume loops at baseline are shown in Fig. 7 .
The phases of the experimental study on LVAD in combination with a modified Glenn shunt, n = 8
| Parameter | Baseline | Modified Glenn-shunt | LVAD | LVAD + modified Glenn-shunt | Baseline vs LVAD, P -values | LVAD vs LVAD + modified Glenn-shunt, P -values |
|---|---|---|---|---|---|---|
| MAP (mmHg) | 86 (74–99) | 96 (86–101) | 98 (88–103) | 84 (74–89) | 0.04 | 0.02 |
| RVCO (l/min) | 2.8 (2.2–3.2) | 2.9 (2.1–3.9) | 4.8 (3.7–5.8) | 3.4 (2.8–4.2) | <0.01 | <0.01 |
| CO (l/min) | 2.8 (2.2–3.2) | 3.4 (2.7–4.4) | 4.8 (3.7–5.8) | 4.0 (3.3–4.7) | <0.01 | 0.02 |
| SVCP (mmHg) | 9 (9–9) | 20 (20–24) | 14 (13–14) | 18 (18–23) | 0.01 | 0.01 |
| RVEDP (mmHg) | 7 (6–7) | 6 (6–7) | 6 (6–7) | 6 (6–7) | 0.46 | 0.31 |
| RVESP (mmHg) | 31 (28–33) | 28 (27–29) | 35 (32–39) | 28 (26–29) | 0.19 | <0.01 |
| mPAP (mmHg) | 18 (17–19) | N/A | N/A | N/A | N/A | N/A |
| RVESV (ml) | 20 (20–27) | 16 (12–23) | 24 (11–34) | 22 (14–29) | 0.84 | 0.95 |
| RVEDV (ml) | 50 (49–67) | 51 (39–61) | 85 (55–88) | 60 (48–69) | 0.05 | 0.05 |
| RVSV (ml) | 30 (29–40) | 32 (21–40) | 49 (42–53) | 34 (33–38) | <0.01 | <0.01 |
| RVSW (mmHg ml) | 535 (424–717) | 461 (271–718) | 708 (654–1193) | 465 (366–711) | 0.04 | 0.02 |
| HR (beats/min) | 84 (76–91) | 93 (90–98) | 90 (89–101) | 93 (90–108) | 0.08 | 0.46 |
| LVAD (l/min) | N/A | N/A | 3.3 (2.9–4.0) | 3.3 (2.9–4.0) | N/A | 1.00 |
| Modified Glenn-shunt (l/min) | N/A | 0.57 (0.48–0.74) | N/A | 0.58 (0.43–0.70) | N/A | N/A |
| pH | 7.47 (7.47–7.48) | 7.46 (7.45–7.48) | 7.46 (7.45–7.49) | 7.46 (7.44–7.48) | 0.55 | 0.64 |
| PO 2 (kPa) | 43 (42–44) | 41 (40–44) | 42 (39–43) | 43 (40–43) | 0.08 | 0.31 |
| PCO 2 (kPa) | 5.5 (5.2–5.6) | 5.5 (5.2–5.5) | 5.5 (5.2–5.8) | 5.5 (5.2–5.9) | 0.31 | 0.74 |
| SBE (mmol/l) | 5.8 (5.0–6.0) | 4.8 (3.8–6.0) | 5.2 (4.0–6.4) | 6.0 (4.0–6.6) | 0.62 | 0.27 |
| SaO 2 (%) | 99 (98–99) | 100 (99–100) | 99 (99–99) | 100 (99–100) | 0.73 | 0.53 |
| SvO 2 (%) | 58 (46–62) | 52 (43–56) | 64 (58–70) | 46 (35–55) | 0.02 | <0.01 |
| Hb (g/l) | 77 (70–82) | 74 (65–77) | 51 (48–57) | 57 (55–60) | <0.01 | 0.18 |
Values presented as median with interquartile range in brackets. P -values calculated with the Wilcoxon signed-rank test.
MAP: mean arterial pressure; RVCO: right ventricular cardiac output; CO: RVCO combined with flow in the modified Glenn shunt; SVCP: superior vena cava pressure; RVEDP: right ventricular end-diastolic pressure; RVESP: right ventricular end-systolic pressure; mPAP: mean pulmonary artery pressure; RVESV: right ventricular end-systolic volume; RVEDV: right ventricular end-diastolic volume; RVSV: right ventricular stroke volume; RVSW: right ventricular stroke work; HR: heart rate; LVAD: left ventricular assist device; SBE: standard base excess.
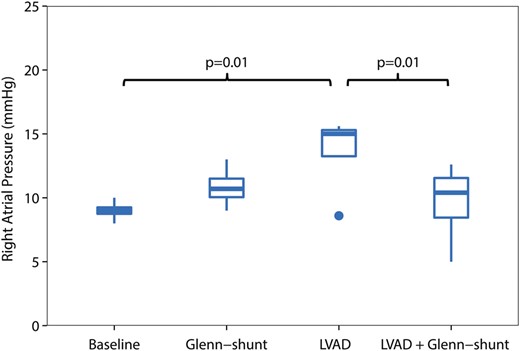
Right atrial (RA) pressure (mmHg), during the four periods of the study ( n = 8). LVAD: left ventricular assist device; Shunt: modified Glenn shunt.
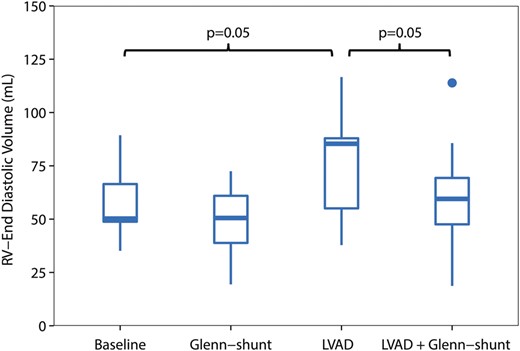
Right ventricular end-diastolic volume (RVEDV) (ml), during the four periods of the study ( n = 8). LVAD: left ventricular assist device; Shunt: modified Glenn shunt.
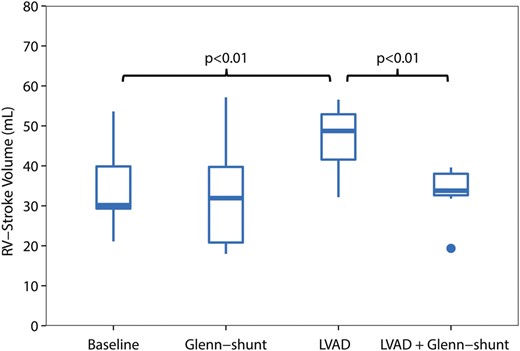
Right ventricular stroke volume (RVSV) (ml) during the four periods of the study ( n = 8). LVAD: left ventricular assist device; Shunt: modified Glenn shunt.
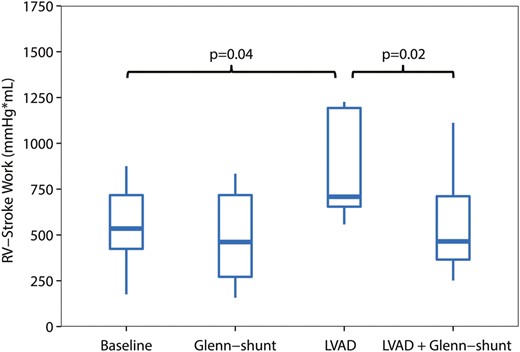
Right ventricular stroke work (RVSW) (mmHg ml), during the four periods of the study ( n = 8). LVAD: left ventricular assist device; Shunt: modified Glenn shunt.
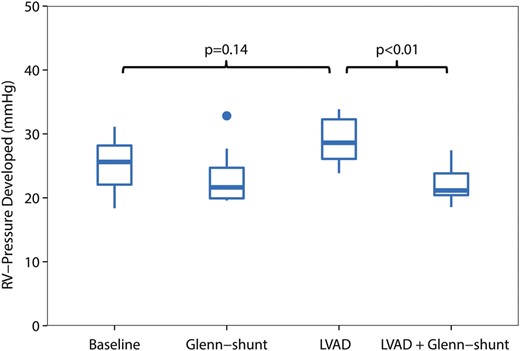
Right ventricular developed pressure (mmHg) during the four periods of the study ( n = 8). LVAD: left ventricular assist device; Shunt: modified Glenn shunt.
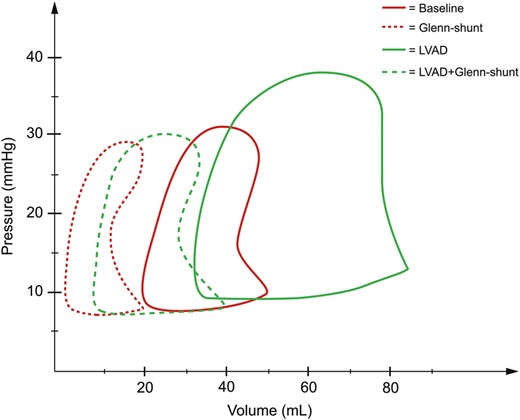
Pressure (mmHg) and volume (ml) loops derived from the right ventricle during the four periods of the study ( n = 8). LVAD: left ventricular assist device; Shunt: modified Glenn shunt.
A modified Glenn shunt without left ventricular assist device
The median flow in the shunt was 0.57 l/min (0.48–0.74), Table 1 . There were no significant changes in the MAP, SvO 2 , RA or RV pressure during the phase of Glenn shunting when compared with baseline, Table 1 . Moreover, the RV pressure–volume loops did not change significantly during shunting, there was, however, a trend towards decreased RV stroke work, as shown in Figs 5 and 7 .
Left ventricular assist device therapy without shunt
During LVAD therapy alone (with a closed shunt), the pump flow was 3.3 l/min (2.9–4.0). The MAP increased from 86 mmHg (74–99) to 98 mmHg (88–103) ( P = 0.04), and SvO 2 increased from 58% (46–52) to 64% (58–70) ( P = 0.02) when LVAD therapy alone was compared with baseline values; Table 1 . LVAD therapy increased the RA pressure from 9 mmHg (9–9) to 15 mmHg (12–15) ( P = 0.01) (Fig. 2 ), and RV end-diastolic volume from 50 ml (49–67) to 85 ml (55–88) ( P = 0.05) (Fig. 3) . In addition, there was an increase in the RV stroke volume from 30 ml (29–40) to 51 ml (42–53) ( P < 0.01) (Fig. 4 ). RV stroke work increased from the baseline value at 535 mmHg ml (424–717) to 708 mmHg ml (654–1193) ( P = 0.04), as shown in Fig. 5 . Finally, there was no increase in the development of pressure in the RV during LVAD therapy from 26 mmHg (22–28) to 29 mmHg (26–32) ( P = 0.14) (Fig. 6 ). The pressure–volume loops for LVAD alone significantly shifted to the right when compared with baseline, as shown in Fig. 7 .
Left ventricular assist device therapy combined with modified Glenn shunt
The LVAD flow was not altered as the shunt was opened. There was a reduction in the MAP with the LVAD and Glenn shunt from 98 mmHg (88–103) to 84 mmHg (74–89) when compared with LVAD therapy alone ( P = 0.02); Table 1 . Also, there was a decrease in SvO 2 from 64% (58–70) with the LVAD alone to 46% (35–55) with the LVAD and shunt ( P < 0.01); Table 1 .
Furthermore, the RA pressure decreased from 15 mmHg (12–15) with the LVAD only to 10 mmHg (7–11) with the LVAD and Glenn shunting ( P = 0.01) (Fig. 2 ). Opening of the shunt also resulted in a decrease in RV end-diastolic volume from 85 ml (55–88) to 60 ml (48–69) ( P < 0.05) (Fig. 3 ). There was also a decrease in RV stroke volume from 49 ml (42–53) with the LVAD only to 34 ml (33–38) ( P < 0.01) when the shunt was opened, as shown in Fig. 4 .
The decrease in RV stroke work from 708 mmHg ml (654–1193) with the LVAD only to 465 mmHg ml (366–711) ( P < 0.02) with the LVAD and shunt resulted in a value of RV stroke work not significantly different from the baseline value at 535 mmHg ml (Table 1 and Fig. 5 ). Finally, the developed pressure in the RV decreased from 29 mmHg (26–32) to 21 mmHg (20–24) ( P < 0.01) when LVAD therapy was combined with Glenn shunting, as shown in Fig. 6 . Finally, the pressure–volume loops for the LVAD combined with a shunt significantly shifted back to become comparable with the baseline when compared with those for LVAD therapy alone (Fig. 7 ).
DISCUSSION
The main finding of this study was that the increase in the RV workload induced by the LVAD could be reduced with a modified Glenn shunt. The RV workload during LVAD therapy together with a modified Glenn shunt was comparable with the RV workload at baseline without LVAD therapy.
The pressure and volume response of the RV during LVAD therapy are poorly described. To our knowledge, this is one of the first studies conducted on the changes in pressure and volume conditions of the RV induced by LVAD therapy evaluated with a conductance catheter. Our primary aim was to evaluate strategies for reversal of the increased RV workload with the creation of a shunt, which we believe is novel and therefore prompted us to carry out our study.
Several studies have been conducted in the areas of outcome and patient risk factors for RV failure after LVAD placement [ 2 , 13–15 ], but there are few reports regarding the actual physiological changes and mechanisms leading to RV failure in these patients, and experimental research in this field is scarce. In severe RV failure in LVAD patients, there is decreased contractility and inability of the RV to produce adequate filling of the LVAD due to volume overload and distension in a vicious circle. The treatment of this clinical problem includes three main areas of focus: (i) assurance of RV coronary blood flow by adequate blood pressure, (ii) inotropes and (iii) reduction of the RV afterload by limiting pulmonary vasoconstriction. The surgical option for severe RV failure is the RVAD, a method that unloads the RV completely. Our study suggests that a complementary strategy for volume unloading of the RV might be shunting of the SVC blood flow directly to the pulmonary bed with a Glenn shunt, thereby accomplishing a reduction of RV stroke work.
Effects of left ventricular assist device therapy on right ventricular function
RV dysfunction during LVAD therapy is partly regarded as a continuation of preoperative inadequate RV function. Moreover, the burden of the surgical procedure such as bleeding, transfusion and haemodynamic instability might contribute to this. It is also suggested that morphological changes in the ventricular geometry during LVAD therapy contribute to RV dysfunction [ 16 , 17 ]. When LVAD therapy was initiated in our study, the right-sided volumes and workload were significantly increased as could be expected in a healthy RV, and the CO to be handled by the RV was increased by 75%. Even in this experimental setting, with normal RV function, LVAD therapy leads to a significant dilatation of the right ventricle, as shown by the increase in RV end-diastolic volume, as well as a marked elevation of central venous pressures. As expected, LVAD therapy by itself increased RV pressures and volume load, regardless of preoperative RV function and volumes.
Effects of a modified Glenn shunt during LVAD therapy
Earlier studies have shown that a reduced preoperative RV stroke work index is a major determinant of RV failure. It is therefore crucial to minimize the RV workload during LVAD treatment, in order to reduce the risk of inducing RV failure. Volume unloading of the RV is a cornerstone in therapy needed to avoid distension and thereby backward failure [ 18 ].
In our study, opening of the shunt reversed the increase in RV stroke work induced by LVAD therapy. Previous studies have tested this concept and shown a potential benefit of Glenn shunting in ischaemic RV failure [ 12 , 19 ] and during experimental LVAD use in simulated biventricular failure [ 20 ]. In the experimental study on LVAD therapy by Succi et al. [ 20 ], the effect of a modified Glenn shunt was compared with a control group. They showed that RV pressure could be reduced by the use of a shunt. However, right-sided volumes were never assessed and a complete evaluation of RV pressures and volumes was not undertaken. In our study, the actual unloading of the RV was evaluated with analyses of changes in pressures and volumes and we believe that this adds additional information regarding the potential of the shunt in combination with the LVAD. Moreover, in the study on experimental ischaemic RV failure by Danton et al . [ 19 ] the shunt was evaluated with pressure–volume loops and was shown to reduce right ventricular end-diastolic volume and pressure, and reverse secondary LV dysfunction. Their study did not, however, include the use of an LVAD.
Clinical implications
The creation of a modified Glenn shunt with temporary closing of the SVC just before the connection with the right atrium is a simple and reversible method of unloading the failing RV, and it can be reversed if RV function improves. One important clinical aspect is the fact that the Glenn shunt is only a solution in patients with low PVR; however, the proportion of such patients among LVAD candidates is not easily defined, while the proportion of such patients among preoperative candidates has been shown to be ∼40%. Also, the indication for a modified Glenn shunt in clinical use is definitely difficult to clearly establish. Nevertheless, we believe that elevated central venous pressures between 15 and 20 mmHg after LVAD insertion could be of some guidance. When compared with LVAD therapy alone, the shunt decreased central venous pressures from 15 to 10 mmHg. This aspect is of high clinical interest in LVAD patients since there are several reports indicating that venous congestion is a very strong determinant of worsening renal function in heart failure patients [ 21 , 22 ]. Some borderline patients with moderately increased venous pressures may require prolonged intensive care, dialysis and inotropes, which might interfere with, or put their clinical improvement at risk. However, one must be aware that a consequence of a modified Glenn shunt might be increased pressure in the SVC and backward cerebral oedema, a known drawback from the field of congenital heart surgery. However, the potential for alleviation of venous congestion by shunting can hopefully both improve organ functions in destination therapy candidates and optimize organ function for LVAD patients awaiting heart transplantation.
Limitations
This model has several important limitations. First, it is important to be aware that the experimental situation in this study is not fully comparable to the RV failure that appears in the clinical LVAD situation. However, the model was constructed to primarily investigate the haemodynamic changes induced by a shunt on RV volume overload; and therefore the response of a normal RV is necessary to accomplish the groundwork for future models. Secondly, the long-term patency of the shunt has not been evaluated, and in a clinical scenario the use of a classical bidirectional Glenn shunt would be more attractive to avoid foreign graft material. Also, the size of the shunt has to be regarded as a possible restriction if higher values of shunt flow are needed. Therefore, sizing of the shunt has to be taken into consideration if clinical use is considered. Furthermore, a modified Glenn shunt dependent on the pressure gradient between the SVC and the pulmonary capillary bed would not be a possible solution in patients with a high trans-pulmonary resistance. Although not widely used in RV analysis, conductance catheter measurements have proven to be reliable with regard to the right ventricle [ 23 , 24 ].
CONCLUSIONS
A significant reduction of the RV stroke work was achieved when a modified Glenn shunt was used in combination with LVAD therapy when compared with LVAD therapy alone. The creation of a Glenn shunt can be an additional strategy of unloading acute RV failure in LVAD candidates. The strategy might also relieve venous congestion in patients with moderate RV dysfunction.
Funding
Funding was received from the Institution of Surgical Sciences, Uppsala University.
Conflict of interest: none declared.
REFERENCES
