


Abstract
Several new classifications have been proposed for revision of the N descriptors for non-small-cell lung cancer (NSCLC), but external validation is required. The aim of this study was to validate various newly proposed nodal classifications and to compare the discrimination abilities of these classifications.
A retrospective analysis was conducted of 1487 patients who underwent complete resection with systematic lymph node dissection for NSCLC between 2000 and 2008. Four nodal classifications based on the following categories were analysed: zone-based classification (single-zone N1, multiple-zone N1, single-zone N2 and multiple-zone N2), number-based classification (the number of metastatic lymph nodes; 1–2, 3–6 and ≥7), rate-based classification (ratio of the number of metastatic lymph nodes to the total number of resected lymph nodes; ≤15, 15–40 and >40%) and the combination of location- and number-based classification (N1: 1–3, N1: ≥4, N2: 1–3 and N2: ≥4). Concordance (C)-index and net reclassification improvement (NRI) index were used to assess the discrimination abilities of the models.
In multivariate analysis, all of the newly proposed classifications were independent predictors ( P < 0.001) of overall survival (OS) after adjustment for significant variables (age, tumour histology and pathological T status). The C-indices of the classifications based on the nodal zone, nodal number, rate and location alongside the number of metastatic lymph nodes were 0.6179, 0.6280, 0.6203 and 0.6221, respectively; however, the differences in the C-indices were statistically insignificant. Compared with the zone-based classification, the NRI for OS of classifications based on the nodal number, rate and location with number were 0.1101, 0.0972 and 0.0416, respectively.
All four proposed classifications based on the nodal zone, nodal number, rate and the combination of location and number are prognostically valid and could serve as future N descriptors after complete resection of NSCLC. The discrimination ability was not significantly different among the four proposed classifications, although the number-based classification tended to have a higher predictive ability compared with the zone-based classification. Future studies with an in-depth discussion are needed to clarify optimal future N descriptors for NSCLC.
INTRODUCTION
Accurate staging of lymph node involvement is a critical aspect in the initial management of patients with non-metastatic non-small-cell lung cancer (NSCLC) and influences decisions on the appropriateness and timing of surgery, radiation and systemic therapy [ 1 ]. In the 7th edition of the TNM Classification of Malignant Tumors, the N descriptor for NSCLC remains the same as in the 6th edition and depends solely on the anatomical extent of lymph node involvement [ 2 ]. In contrast, the number of involved lymph nodes is included in the definition of pathological N factors in breast, stomach, oesophageal and colorectal cancer [ 3 ].
Nonetheless, patients suffering from pathological N1 or N2 disease in NSCLC have been known to exhibit prognostic heterogeneity. In addition, it has become increasingly evident that many patients can have different prognoses even with the same N status, especially those in the N2 group. It is therefore necessary to refine the currently used pathological N descriptors, and alternative nodal classification methods have already been proposed [ 4 ].
For this reason, the International Association for the Study of Lung Cancer (IASLC) committee tested the prognostic significance of a four-category classification of the nodal spread into N0, single-zone N1, multiple zones N1/single zone N2 and multiple zones N2. The analysis demonstrated a stepwise decremental prognosis along the four nodal groups, suggesting that the overall disease burden, rather than just the anatomical location of the lymph node involvement, may influence the outcome [ 1 ]. Unfortunately, the results could not be validated, and the International Staging Committee prudently decided to maintain the current N descriptors until future analyses of larger and more homogeneous databases become available.
Several studies have proposed other N classification methods for subdivision of nodal-positive NSCLC based on the number of metastatic lymph nodes, the rate of the number of metastatic lymph nodes to the total number of resected lymph nodes and a combination of location and number of metastatic lymph nodes [ 4–8 ]. The authors of previous articles have offered reasonable classifications; however, external validation is lacking. Furthermore, the revision of the N descriptors for NSCLC is a controversial subject and a heated debate regarding the solution for N descriptors is now taking place [ 4 , 9 ].
Therefore, in the present study, we aimed to apply various classification systems to our patients to validate newly proposed classifications for the revision of N descriptors for NSCLC. We then compared the discrimination abilities of these systems to determine optimal N descriptors for completely resected NSCLC.
MATERIALS AND METHODS
Patients
Between January 2000 and December 2008, 2335 consecutive patients who underwent surgery for NSCLC were selected for inclusion from a prospectively collected patient database at Asan Medical Center, Seoul, Korea. Of these, patients who received preoperative chemoradiation therapy; who underwent sublobar resection (biopsy, wedge resection and segmentectomy), incomplete resection (R1 and R2 resection) or incomplete lymph nodal dissection (number of resected lymph nodes less than six); who had histology other than adenocarcinoma, squamous cell carcinoma or adenosquamous cell carcinoma and/or who had other malignancies were excluded from this study. Consequently 1487 patients who underwent complete resection with systematic lymph node dissection were included, and 526 patients with pathologically confirmed lymph node metastasis were analysed (Fig. 1 ). This study was approved by the Institutional Review Board of Asan Medical Center.
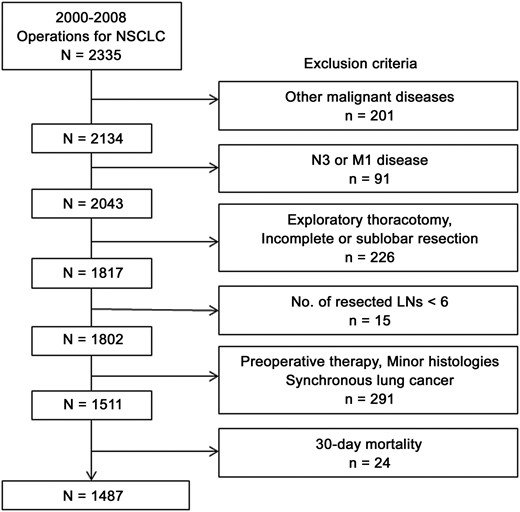
Patients included in this study. LN: lymph node; NSCLC: non-small-cell lung cancer.
Pre- and postoperative staging
Initial staging was based on medical history, physical examination, complete blood counts, blood chemistry with electrolytes, chest X-ray, computed tomography (CT) of the chest and upper abdomen, biopsy, bronchoscopy, pulmonary function testing and radionuclide bone scanning. From January 2002, 18 F-fluorodeoxyglucose (FDG) positron emission tomography (PET) was added to these routine modalities. Brain CT or magnetic resonance imaging was performed in clinically indicated cases. After surgery, patients were staged according to the American Joint Committee on Cancer (AJCC) 7th edition [ 10 ]. A chest CT scan was performed every 6 months during the first 2 years after surgery, and every 1 year thereafter or at any time when disease recurrence was clinically suspected. Treatment modalities and chemotherapeutic regimens in relapsed cases were at the discretion of the attending physician.
Study design
We searched the literature through PubMed for new proposals of N descriptors in NSCLC and selected four representative articles that categorized N descriptors based on the metastatic nodal zone [ 2 ], the number of metastatic lymph nodes [ 4 ], the rate of the number of metastatic lymph nodes to the total number of resected lymph nodes [ 1 ] and a combination of the number and location of metastatic lymph nodes [ 6 ]. In the first classification, based on the zone of metastatic lymph nodes, which was proposed by Rusch and Crowley as part of the IASLC Lung Cancer Staging Project in 2007, lymph node stations are grouped together into six ‘zones’: peripheral or hilar for N1 nodes, and upper or lower mediastinal, aortopulmonary and subcarinal for N2 nodes [ 11 ]. In addition, patients are categorized into four groups: absence of metastatic nodes (N0), single-zone N1 (N1a), multiple-zone N1 or single-zone N2 (N1b or N2a) and multiple-zone N2 disease (N2b) [ 1 ]. In the second classification, which was proposed by Wei et al . in 2011 [ 4 ], patients are divided into four categories according to the number of metastatic lymph nodes: absence of metastatic nodes (N0), metastasis in one to two nodes (N1–2), metastasis in three to six nodes (N3–6) and metastasis in seven or more nodes (N≥7). In the third classification, which was validated by Ito et al . in 2013 [ 5 ], the patients are divided into four categories according to the ratio of the number of metastatic lymph nodes to the total number of resected lymph nodes: absence of metastatic nodes (R0%), below 15% (R≤15%), more than 15% and below 40% (R15–40%) and more than 40% (R>40%). In the fourth classification, which was proposed by Saji and Tsuboi in 2013 [ 6 ], patients are divided into four categories according to the combination of the location and number of metastatic lymph nodes: absence of metastatic nodes (N0), N1 with one to three nodes positive (N1: 1–3), N1 with more than four nodes positive or N2 with one to three nodes positive (N1: ≥4 or N2: 1–3) and N2 with more than four nodes positive (N2: ≥4).
Statistical methods
Overall survival (OS) was defined as the time from the date of surgery to death from any cause. Freedom from recurrence (FFR) was defined as the time from the date of surgery to recurrence. The association of OS or FFR and the proposed classifications were estimated using the Kaplan–Meier method and assessed using the log-rank test.
Patients' characteristics
| Variables | No. (%) | Variables | No. (%) |
|---|---|---|---|
| Age (median, range) | 62 (17–86) years | Procedures | |
| Sex | Lobectomy | 1212 (81.5%) | |
| Male | 1042 (70.1%) | Bilobectomy | 106 (7.1%) |
| Female | 445 (29.9%) | Pneumonectomy | 169 (11.4%) |
| Histology | Pathological T status | ||
| ADC | 856 (57.6%) | Tis/T1a | 224 (15.1%) |
| ADSqCC | 615 (41.3%) | T1b | 263 (17.7%) |
| SqCC | 16 (1.1%) | T2a | 608 (40.9%) |
| Lobe | T2b | 156 (10.5%) | |
| Right upper | 436 (29.3%) | T3 | 193 (13.0%) |
| Right middle | 117 (7.9%) | T4 | 43 (2.9%) |
| Right lower | 352 (23.7%) | No. of resected lymph nodes | |
| Left upper | 323 (21.7%) | Median | 26 |
| Left lower | 259 (17.4%) | Range | 6–75 |
ADC: adenocarcinoma; SqCC: squamous cell carcinoma, ADSqCC: adenosquamous carcinoma.
Comparisons of the proposed classifications
| Variables | No. of patients (%) | Age (mean ± SD) | Sex (F : M) | Cell type (ADC/SqCC/ADSqCC) | pT status (T1/T2/T3/T4) | No. of resected LN (median, range) |
|---|---|---|---|---|---|---|
| UICC/AJCC 7th edition | ||||||
| N0 | 961 (64.6%) | 61.2 ± 9.2 | 313 : 648 | 593/361/7 | 377/463/106/14 | 25 (6–75) |
| N1 | 263 (17.7%) | 61.5 ± 9.8 | 54 : 209 | 95/161/7 | 50/155/45 | 28 (9–67) |
| N2 | 263 (17.7%) | 58.6 ± 9.9 | 78 : 185 | 168/93/2 | 60/146/41 | 28 (9–62) |
| Zone-based classification | ||||||
| N0 | 961 (64.6%) | 61.2 ± 9.2 | 313 : 648 | 593/361/7 | 377/463/106/14 | 25 (6–75) |
| N1a | 234 (15.7%) | 61.8 ± 9.5 | 47 : 187 | 81/146/7 | 47/136/39 | 28 (9–67) |
| N1b or N2a | 214 (14.4%) | 58.4 ± 10.3 | 56 : 158 | 127/87/0 | 46/120/36 | 28 (9–62) |
| N2b | 78 (5.3%) | 59.2 ± 9.2 | 29 : 49 | 55/21/2 | 17/45/11 | 27 (9–62) |
| Number-based classification | ||||||
| N0 | 961 (64.6%) | 61.2 ± 9.2 | 313 : 648 | 593/361/7 | 377/463/106/14 | 25 (6–75) |
| N1–2 | 283 (19.0%) | 61.7 ± 9.4 | 59 : 224 | 124/153/6 | 63/157/50 | 27 (9–65) |
| N3–6 | 151 (10.2%) | 58.5 ± 10.9 | 48 : 103 | 79/71/1 | 29/91/22 | 29 (9–67) |
| N≥7 | 92 (6.2%) | 59.0 ± 9.1 | 25 : 67 | 60/30/2 | 18/53/14 | 30 (11–61) |
| Rate-based classification | ||||||
| R0% | 961 (64.6%) | 61.2 ± 9.2 | 313 : 648 | 593/361/7 | 377/463/106/14 | 25 (6–75) |
| R≤15% | 366 (24.6%) | 60.7 ± 9.7 | 85 : 281 | 160/199/7 | 74/210/66/16 | 28 (9–67) |
| R15–40% | 116 (7.8%) | 58.5 ± 10.7 | 27 : 89 | 65/50/1 | 26/66/13/11 | 26 (9–61) |
| R>40% | 44 (3.0%) | 58.1 ± 8.9 | 20 : 24 | 38/5/1 | 10/25/7/2 | 26.5 (11–49) |
| Location with number-based classification | ||||||
| N0 | 961 (64.6%) | 61.2 ± 9.2 | 313 : 648 | 593/361/7 | 377/463/106/14 | 25 (6–75) |
| N1: 1–3 | 229 (15.4%) | 61.2 ± 9.9 | 48 : 181 | 85/137/7 | 46/136/38/9 | 27 (9–65) |
| N1: ≥4 or N2: 1–3 | 148 (10.0%) | 60.4 ± 9.4 | 33 : 115 | 73/75/0 | 30/81/28/9 | 28 (6–79) |
| N2: ≥4 | 149 (10.0%) | 57.8 ± 10.0 | 51 : 98 | 105/42/2 | 34/84/20/11 | 28 (11–61) |
SD: standard deviation; ADC: adenocarcinoma; SqCC: squamous cell carcinoma; ADSqCC: adenosquamous carcinoma; LN: lymph node; UICC: Union for International Cancer Control; AJCC: American Joint Committee on Cancer.
Multivariate analyses comparing overall survival or freedom from recurrence and the C-indices of proposed classifications
| No. | Multivariable 1 | Multivariable 2 | Multivariable 3 | Multivariable 4 | Multivariable 5 | C-index | 95% CI | |||||||||||||||||
|---|---|---|---|---|---|---|---|---|---|---|---|---|---|---|---|---|---|---|---|---|---|---|---|---|
| HR | 95% CI | P -value | HR | 95% CI | P -value | HR | 95% CI | P -value | HR | 95% CI | P -value | HR | 95% CI | P -value | ||||||||||
| OS | ||||||||||||||||||||||||
| UICC/AJCC 7th edition | ||||||||||||||||||||||||
| N1 | 263 | 1 | 0.6073 | 0.5763 | 0.6382 | |||||||||||||||||||
| N2 | 263 | 1.450 | 1.154 | 1.821 | 0.001 | |||||||||||||||||||
| Zone | ||||||||||||||||||||||||
| N1a | 234 | 1 | 0.6179 | 0.5874 | 0.6484 | |||||||||||||||||||
| N1b or N2a | 214 | 1.464 | 1.140 | 1.881 | 0.003 | |||||||||||||||||||
| N2b | 78 | 1.947 | 1.417 | 2.674 | 0.000 | |||||||||||||||||||
| Number | ||||||||||||||||||||||||
| N1–2 | 283 | 1 | 0.6280 | 0.5982 | 0.6577 | |||||||||||||||||||
| N3–6 | 151 | 1.556 | 1.209 | 2.001 | 0.001 | |||||||||||||||||||
| N≥7 | 92 | 2.176 | 1.631 | 2.902 | 0.000 | |||||||||||||||||||
| Rate | ||||||||||||||||||||||||
| R≤15% | 366 | 1 | 0.6203 | 0.5907 | 0.6498 | |||||||||||||||||||
| R15–40% | 116 | 1.449 | 1.109 | 1.894 | 0.007 | |||||||||||||||||||
| R>40% | 44 | 2.516 | 1.764 | 3.589 | 0.000 | |||||||||||||||||||
| Location and number | ||||||||||||||||||||||||
| N1: 1–3 | 229 | 1 | 0.6221 | 0.5920 | 0.6523 | |||||||||||||||||||
| N1: ≥4 or N2: 1–3 | 148 | 1.446 | 1.103 | 1.896 | 0.008 | |||||||||||||||||||
| N2: ≥4 | 149 | 1.907 | 1.451 | 2.508 | 0.000 | |||||||||||||||||||
| Age | 526 | 1.022 | 1.010 | 1.034 | 0.000 | 1.022 | 1.010 | 1.034 | 0.000 | 1.022 | 1.010 | 1.034 | 0.000 | 1.023 | 1.011 | 1.035 | 0.000 | 1.022 | 1.010 | 1.035 | 0.000 | |||
| Histology | ||||||||||||||||||||||||
| ADC | 263 | 1 | 1 | 1 | 1 | |||||||||||||||||||
| ADSqCC | 9 | 3.512 | 1.744 | 7.072 | 0.000 | 3.666 | 1.828 | 7.351 | 0.000 | 3.499 | 1.748 | 7.006 | 0.000 | 3.691 | 1.829 | 7.449 | 0.000 | 3.903 | 1.932 | 7.884 | 0.000 | |||
| SqCC | 254 | 0.749 | 0.590 | 0.951 | 0.018 | 0.770 | 0.609 | 0.974 | 0.030 | 0.805 | 0.631 | 1.027 | 0.081 | 0.780 | 0.614 | 0.992 | 0.043 | 0.795 | 0.625 | 1.010 | 0.061 | |||
| Pathological T status | ||||||||||||||||||||||||
| T1a | 36 | 1 | 1 | 1 | 1 | |||||||||||||||||||
| T1b | 74 | 1.180 | 0.661 | 2.108 | 0.575 | 1.073 | 0.600 | 1.918 | 0.812 | 1.069 | 0.598 | 1.912 | 0.821 | 1.185 | 0.663 | 2.118 | 0.567 | 1.156 | 0.646 | 2.070 | 0.626 | |||
| T2a | 229 | 1.786 | 1.062 | 3.004 | 0.029 | 1.615 | 0.958 | 2.721 | 0.072 | 1.651 | 0.980 | 2.780 | 0.060 | 1.779 | 1.058 | 2.994 | 0.030 | 1.753 | 1.040 | 2.956 | 0.035 | |||
| T2b | 72 | 2.139 | 1.215 | 3.768 | 0.008 | 1.831 | 1.033 | 3.245 | 0.038 | 1.905 | 1.078 | 3.367 | 0.027 | 2.037 | 1.152 | 3.601 | 0.014 | 2.026 | 1.146 | 3.580 | 0.015 | |||
| T3 | 86 | 2.432 | 1.387 | 4.265 | 0.002 | 2.153 | 1.225 | 3.785 | 0.008 | 2.191 | 1.248 | 3.848 | 0.006 | 2.344 | 1.335 | 4.115 | 0.003 | 2.375 | 1.353 | 4.168 | 0.003 | |||
| T4 | 29 | 1.707 | 0.859 | 3.395 | 0.127 | 1.510 | 0.757 | 3.012 | 0.242 | 1.558 | 0.780 | 3.111 | 0.209 | 1.677 | 0.842 | 3.338 | 0.141 | 1.586 | 0.796 | 3.161 | 0.190 | |||
| FFR | ||||||||||||||||||||||||
| UICC/AJCC 7th edition | ||||||||||||||||||||||||
| N1 | 263 | 1 | 0.6221 | 0.587 | 0.6572 | |||||||||||||||||||
| N2 | 263 | 1.653 | 1.278 | 2.138 | 0.000 | |||||||||||||||||||
| Zone | ||||||||||||||||||||||||
| N1a | 234 | 1 | 0.6386 | 0.6037 | 0.6735 | |||||||||||||||||||
| N1b or N2a | 214 | 1.564 | 1.173 | 2.085 | 0.002 | |||||||||||||||||||
| N2b | 78 | 2.724 | 1.925 | 3.854 | 0.000 | |||||||||||||||||||
| Number | ||||||||||||||||||||||||
| N1–2 | 283 | 1 | 0.6466 | 0.6117 | 0.6816 | |||||||||||||||||||
| N3–6 | 151 | 1.694 | 1.275 | 2.250 | 0.000 | |||||||||||||||||||
| N≥7 | 92 | 2.650 | 1.937 | 3.625 | 0.000 | |||||||||||||||||||
| Rate | ||||||||||||||||||||||||
| R≤15% | 366 | 1 | 0.6405 | 0.6054 | 0.6756 | |||||||||||||||||||
| R15–40% | 116 | 1.593 | 1.195 | 2.124 | 0.002 | |||||||||||||||||||
| R>40% | 44 | 3.438 | 2.346 | 5.039 | 0.000 | |||||||||||||||||||
| Location and number | ||||||||||||||||||||||||
| N1: 1–3 | 229 | 1 | 0.6392 | 0.6040 | 0.6743 | |||||||||||||||||||
| N1: ≥4 or N2: 1–3 | 148 | 1.387 | 1.013 | 1.900 | 0.041 | |||||||||||||||||||
| N2: ≥4 | 149 | 2.233 | 1.657 | 3.011 | 0.000 | |||||||||||||||||||
| Age | 526 | 0.991 | 0.979 | 1.003 | 0.152 | 0.990 | 0.978 | 1.003 | 0.134 | 0.992 | 0.980 | 1.004 | 0.201 | 0.991 | 0.978 | 1.003 | 0.142 | 0.991 | 0.979 | 1.004 | 0.180 | |||
| Sex | ||||||||||||||||||||||||
| Male | 394 | 1.044 | 0.779 | 1.399 | 0.773 | 1.067 | 0.795 | 1.431 | 0.668 | 1.010 | 0.753 | 1.355 | 0.946 | 0.989 | 0.739 | 1.323 | 0.938 | 1.036 | 0.773 | 1.388 | 0.815 | |||
| Histology | ||||||||||||||||||||||||
| ADC | 263 | 1 | 1 | 1 | 1 | 1 | ||||||||||||||||||
| ADSqCC | 9 | 2.861 | 1.304 | 6.275 | 0.009 | 3.060 | 1.390 | 6.738 | 0.005 | 2.860 | 1.315 | 6.220 | 0.008 | 2.744 | 1.261 | 5.972 | 0.011 | 3.077 | 1.397 | 6.777 | 0.005 | |||
| SqCC | 254 | 0.594 | 0.442 | 0.797 | 0.001 | 0.614 | 0.457 | 0.826 | 0.001 | 0.588 | 0.439 | 0.787 | 0.000 | 0.645 | 0.478 | 0.871 | 0.004 | 0.624 | 0.464 | 0.840 | 0.002 | |||
OS: overall survival; FFR: freedom from recurrence; HR: hazard ratio; CI: confidence interval; UICC: Union for International Cancer Control; AJCC: American Joint Committee on Cancer; ADC: adenocarcinoma; SqCC: squamous cell carcinoma, ADSqCC: adenosquamous carcinoma.
The discriminatory abilities of the models were assessed by using concordance (C)-indices. Harrell et al . proposed C-indices as measures of the general predictive power of a general regression model, in a survival model with a possibly right-censored outcome, which was interpreted as a lifetime [ 12 , 13 ]. Cox proportional hazards models were also used to adjust for confounding variables such as age, sex, tumour histology and pathological T status, with proposed N descriptors represented by indicator variables. Statistical significance was set at P = 0.05, and the SAS software version 9.3 (SAS Institute, Cary, NC, USA) was used. In addition, the net reclassification improvement (NRI) was calculated for any changes in estimated prediction probabilities that imply a change from one category to another according to the method described by Pencina et al. [ 14 ].
RESULTS
Patients' characteristics
Patients' baseline characteristics are summarized in Table 1 . The median age was 62 years (range, 17–86), and 1042 patients (70.1%) were men. Lobectomy was performed in 1212 (81.5%) patients, and 1471 (98.9%) patients were pathologically confirmed as having adenocarcinoma or squamous cell carcinoma. The median number of total resected lymph nodes was 26 (range, 6–75).
Comparisons of the proposed classifications and Kaplan–Meier analyses
Patients' characteristics according to the five classifications are summarized in Table 2 . OS and FFR curves were stratified by the classifications based on the 7th edition of the AJCC cancer staging system (Fig. 2 A), nodal zone of metastatic nodes (Fig. 2 B), number of metastatic nodes (Fig. 2 C), rate of metastatic nodes (Fig. 2 D) and a combination of location and number of metastatic nodes (Fig. 2 E).
Multivariable analyses using Cox proportional hazards models and C-indices of the proposed classifications
In univariate analysis for OS, patient age ( P = 0.002), tumour histology ( P = 0.001) and pathological T staging ( P = 0.024) as well as proposed N status were identified as significant prognostic factors associated with OS after surgical resection. In multivariate analysis, proposed N descriptors based on the nodal zone, nodal number and rate of metastatic lymph nodes were significant factors for OS after adjusting for patient age, tumour histology and pathological T status (Table 3 ). The C-indices for the OS of the classifications based on the current nodal system, nodal zone, nodal number, rate and location with the number of metastatic lymph nodes were 0.6073 [95% confidence interval (CI): 0.5763–0.6382], 0.6179 (95% CI: 0.5874–0.6484), 0.6280 (95% CI: 0.5982–0.6577), 0.6203 (95% CI: 0.5907–0.6498) and 0.6221 (95% CI: 0.5920–0.6523), respectively. The C-index of the classification based on the number of metastatic lymph nodes was the highest, although the differences in the C-indices among the proposed classifications were not statistically significant (Table 3 ).
In univariate analysis for FFR, patient age ( P = 0.006), sex ( P = 0.008) and tumour histology ( P < 0.001) as well as proposed N status were identified as significant prognostic factors associated with FFR after surgical resection. In multivariate analysis, the proposed N descriptors based on the nodal zone, nodal number and the rate of metastatic lymph nodes were significant factors for FFR after adjusting for patient age, tumour histology and pathological T status (Table 3 ). The C-indices for FFR of the classifications based on the current nodal system, nodal zone, nodal number, ratio and location with the number of metastatic lymph nodes were 0.6221 (95% CI: 0.587–0.6572), 0.6386 (95% CI: 0.6037–0.6735), 0.6466 (95% CI: 0.6117–0.6816), 0.6405 (95% CI: 0.6054–0.6756) and 0.6392 (95% CI: 0.6040–0.6743), respectively. The C-index of the classification based on the number of metastatic lymph nodes was the highest; however, the differences in the C-indices between proposed classifications were not statistically significant (Table 3 ).
Net reclassification improvement indices of classifications compared with the zone-based classification
Compared with the zone-based classification, the NRI for OS of classifications based on the nodal number, rate and location with number were 0.1101, 0.0972 and 0.0416, respectively (Table 4 ).
Comparisons of net reclassification improvement indices of proposed classifications and zone-based classification.
| Crosstab for events ( n = 339) | Crosstab for non-events ( n = 187) | ||||||||||
|---|---|---|---|---|---|---|---|---|---|---|---|
| Number-based classification | |||||||||||
| Zone-based classification | N1–2 | N3–6 | N≥7 | N1–2 | N3–6 | N≥7 | |||||
| N1a | 99 | 35 | 1 | N1a | 86 | 11 | 2 | Improvement of sensitivity | (35 + 1 + 28)/339 − (56 + 4 + 12)/339 | ||
| N1b or N2a | 56 | 57 | 28 | N1b or N2a | 37 | 28 | 8 | Improvement of specificity | (37 + 1 + 8)/187 − (11 + 2 + 8)/187 | ||
| N2b | 4 | 12 | 47 | N2b | 1 | 8 | 6 | Net reclassification improvement | 0.1101 | ||
| Rate-based classification | |||||||||||
| Zone-based classification | R≤15% | R15–40% | R>40% | R≤15% | R15–40% | R>40% | |||||
| N1a | 130 | 5 | 0 | N1a | 92 | 7 | 0 | Improvement of sensitivity | (5 + 8)/339 − (81 + 6)/339 | ||
| N1b or N2a | 81 | 52 | 8 | N1b or N2a | 52 | 21 | 0 | Improvement of specificity | (52 + 3 + 11)/187 − (7)/187 | ||
| N2b | 0 | 6 | 57 | N2b | 3 | 11 | 1 | Net reclassification improvement | 0.0972 | ||
| Location- and number-based classification | |||||||||||
| Zone-based classification | N1: 1–3 | N1: ≥4 or N2: 1–3 | N2: ≥4 | N1: 1–3 | N1: ≥4 or N2: 1–3 | N2: ≥4 | |||||
| N1a | 118 | 17 | 0 | N1a | 94 | 5 | 0 | Improvement of sensitivity | (17 + 55)/339 − (12 + 6)/339 | ||
| N1b or N2a | 12 | 74 | 55 | N1b or N2a | 5 | 44 | 24 | Improvement of specificity | (5 + 2)/187 − (5 + 24)/187 | ||
| N2b | 0 | 6 | 57 | N2b | 0 | 2 | 13 | Net reclassification improvement | 0.0416 | ||
DISCUSSION
The purpose of this study was to validate various proposed classifications based on the nodal zone, nodal number, rate of the number of metastatic lymph nodes to the total number of resected lymph nodes and a combination of location and number by applying them to our patient population. The results of our study demonstrated that the four proposed classifications are valid and provide excellent survival stratification. Moreover, significant differences between new N descriptors of each classification were found in a multivariate analysis after adjusting for significant variables (pathological T status, patient age and cell type for OS; patient age, sex and cell type for recurrence).
The four proposed classifications cited in this study include the concept of quantifying metastatic lymph nodes. However, these classifications can be further classified into two categories based on the consideration of anatomical location of the metastatic lymph nodes. The zone-based classification and the location alongside the number-based classification consider a combination of anatomical location and quantity of metastatic lymph nodes. In contrast, the number-based and the rate-based classifications do not consider anatomical location.
Authors of the zone-based classification proposed by the IASLC grouped six ‘zones' from lymph node stations [ 15 ], because of differences in nomenclature between the Naruke and the Mountain-Dressler of the American Thoracic Society (MD-ATS) lymph node map [ 1 ]. This makes it simple to analyse an international database and stratify pathological N1- or N2-disease [ 1 ]. The authors suggested the concept of single- or multiple-zone for the prognostic stratification on the basis of the current N descriptors. Although this classification was not adopted in the 7th revision of TNM staging guidelines, a validation study is still worthy enough.
On the other hand, authors of the classifications based on a combination of location and number of metastatic nodes suggest the number of metastatic lymph nodes for stratification as the basis of current N descriptors. They specified the cut-off point of metastatic lymph nodes as four on the basis of their previous analyses [ 6 ]. Interestingly, the result of our study confirmed that the OS rate of the ’N1: ≥4’ group was poorer than that of the ‘N2: 1-3’ group ( P = 0.036) and the difference in OS rate between the ’N1: ≥4’ and ‘N2: ≥4’ groups was not statistically significant ( P = 0.564, data are not shown in Fig. 2 ). These results correspond with the results of a previous original study that reported no statistically significant difference between the ‘N1: ≥4’ and ‘N2: 1–3’ categories and that ‘N2: 1–3’ was associated with better prognosis than ‘N1: ≥4’ [ 7 ]. These results indicate that the quantification of metastatic lymph nodes should be included in prognostic models. Regarding preoperative treatments, the above two classifications can supplement the weak points of numerically based classifications, because existing clinical guidelines based on the current N descriptors can be used to determine preoperative and postoperative treatments. A possible disadvantage of these two classifications is that they can be complex to use. Nonetheless, we believe that these disadvantages can be surmounted.


Overall survival and freedom from recurrence curves stratified by the classifications based on ( A ) the 7th edition of the AJCC cancer staging system; ( B ) the nodal zone of metastatic nodes; ( C ) the number of metastatic nodes; ( D ) the rate of metastatic nodes and ( E ) a combination of location and number of metastatic nodes. UICC: Union for International Cancer Control; AJCC: American Joint Committee on Cancer; OS: overall survival; FFR: freedom from recurrence.
The two classifications included in the latter category, namely the number-based and rate-based classifications, exclusively consider the quantity of metastatic nodes without considering anatomical location. In the number-based classification, patients are stratified based on the number of metastatic nodes. This classification is simple to use and can easily obtain more accurate prognostic stratifications. In addition, these classifications are a more objective measure than location-based classifications, because errors can be made in determining the location of metastatic nodes. Despite these advantages, there are also some disadvantages [ 4 ]. An adequate number of retrieved lymph nodes are essential to evaluate the prognostic significance of the number of metastatic lymph nodes. In addition, preoperative clinical staging cannot be established using this classification. Thus, number-based classifications cannot aid in determining optimal treatment before surgery. In addition, some lymph nodes are inevitably removed in fragments, especially in the N1 region, which could lead to an overestimation of the number of metastatic nodes [ 4 ].
In rate-based classifications, authors use the ratio of the number of metastatic lymph nodes to the total number of resected lymph nodes. Therefore, in cases with a constant number of metastatic lymph nodes, the rate decreases as the number of totally resected lymph nodes increases. Although the number of totally resected lymph nodes reflects the extensiveness of lymph node dissection, the rate of metastatic nodes can be overestimated in cases in which few lymph nodes have been resected. An adequate number of retrieved lymph nodes are therefore an essential component of these classification systems.
As mentioned above, each classification has advantages and disadvantages. For statistical comparisons, we calculated the C-index and NRI index as a means of assessing discriminatory and predictable ability in each model. In the C-index analysis, the discrimination ability increases as the C-index gets close to 1.0. The NRI index is the sum of the improvements in sensitivity in the event group and specificity in the non-event group. An NRI index larger than 0 indicates that the new classification has a better predictive ability than the established classification used for comparison. In our study, number-based classification showed better discriminatory and predictive ability on survival than other classifications; however, the differences were not significant.
In addition, establishing the new staging classification is a separate issue from stratifying the clinical prognosis. Authors who support the importance of anatomical location-based classifications insist that stage classification should include consideration of the anatomical extent of disease, rather than be based on a prognostic prediction model, and they insist that the purpose of stage classification is to provide a framework that can be applied consistently worldwide to clearly define patient tumour burden and classify patients into clinically useful groups [ 9 ]. It is very unlikely that a TNM system would completely abandon the concept of tumour location. Nonetheless, the results of various retrospective articles, including our results predicting prognosis after surgical resection, can help the international staging committee clarify optimal future N descriptors.
To the best of our knowledge, this is the first study that attempts to validate various classifications for the revision of N descriptors for NSCLC and that statistically compares the discriminatory and predictive abilities of proposed classifications. However, our current study has important limitations stemming from its retrospective analysis of observational data from a single institution. In addition, we did not consider the effect of adjuvant therapies in multivariate analysis due to a lack of relevant data.
In conclusion, our present study findings demonstrate that stratification according to the four proposed classifications is prognostically valid after complete resection of NSCLC. The discrimination ability was not significantly different among the newly proposed classifications, although number-based classifications tended to show better discriminatory and predictive ability compared with zone-based classifications. Future studies with an in-depth discussion are needed to clarify optimal future N descriptors for NSCLC.
ACKNOWLEDGEMENTS
The authors thank Sun Ok Kim from the Department of Biostatistics for statistical analysis. In addition, we especially thank the IASLC and the authors of the cited articles who have inspired us to take the initiative to assess and validate possible future lung cancer staging systems.
Conflict of interest: none declared.
REFERENCES
APPENDIX. CONFERENCE DISCUSSION
Dr U. Pastorino(Milan, Italy): This is a very interesting paper. It is a large series from one centre, and the quality of nodal staging appears to be very good intraoperatively as the average resected node is 25 for N0; and 28, 29 for N Plus. So you did a good job.
Certainly, having the chance to compare five different methods in the same population and showing that in all of them it works well is, in itself, a good result and helpful for the committee that is going to evaluate how to approach a problem of nodal burden.
I have two questions for you. The first question is related to the selection.
In the paper, you said that you came out with 1500 cases, out of 2300 consecutive cases, so there is a major selection process. One thing that is not clear to me is: was clinical N2 disease excluded or included in this analysis?
Dr Lee: In our institution, when we anticipate single-station clinical N2 disease on preoperative evaluation, we perform surgery first. In contrast, however, if mediastinal lymph nodes are anticipated to be involved in multiple stations, we do preoperative chemoradiation first. So in this study, patients with clinical N2 disease were included.
Dr Pastorino: It is included with one station only?
Dr Lee: No. All patients with clinical N2 disease were included; however, most patients with clinical N2 disease were single station N2 disease.
Dr Pastorino: The second question is related to the comparison of the three methods.
Obviously, it is very unlikely that a TNM will abandon completely the concept of a location, because it has a major implication, particularly on the preoperative assessment in the decision to operate, how to operate, where and how to use induction, so it is very unlikely you can really abandon.
So the option could be to implement and combine a number of nodes with the site, and you do it. But the problem in your analysis is that N2 disease turns out to have a better survival than N1 disease with 4 or more nodes.
How do you interpret this result that N2 disease does better than N1 with 4 or more nodes?
Dr Lee: The last article published from the University of Tokyo which I cited suggested that the classification of nodal stage takes into consideration a combination of location and number of metastatic lymph nodes. In agreement with this study result, I found that N1 involvement with metastatic lymph nodes of more than 4 has a poorer prognosis than N2 involvement with metastatic lymph nodes of 1 to 3.
So I believe that overall disease burden, manifested as a number of metastatic nodes is more important than the location of the metastatic lymph nodes. However, the staging classification is a separate issue from predicting prognosis after surgery. So the international staging committee should discuss whether the number of lymph nodes involved should be considered in the new classification of nodal staging.
Dr Pastorino: Yes, but in your paper, N1 with the 4 Plus is worse than N2 with the 4 Plus, which is a little bit more difficult to understand. However, having said that, you cannot expect to use this classification to decide the preoperative management. It can only be done after. So how do you envision this classification to improve the management of adjuvant?
Dr Lee: There are pros and cons when we choose the number-based classification, just as you mentioned, it is very difficult to determine the pre- and post-operative therapies when we use the number-based classifications. So I also doubted about whether the classification number is always good.
So, further studies and clinical trials will be required to discover the optimal pre- and postoperative therapies criteria.
Dr A. Habib(Birmingham, United Kingdom): It is a very interesting study, I really am fascinated. This question is a little bit more statistical.
How did you manage to exclude the variables of age, sex and other confounding comorbidities to rule out their impact on survival?
Dr Lee: To adjust other significant variables, we used a multivariable analysis, using the Cox proportional regression model.
Author notes
Presented at the 28th Annual Meeting of the European Association for Cardio-Thoracic Surgery, Milan, Italy, 11–15 October 2014.
