


Abstract
Several alternative transapical (TA) aortic prostheses for aortic valve implantation (AVI) have recently become available. Data directly comparing the performance of these different TA-AVI valves, however, are sparse. Therefore, we sought to analyse the performance of the better-established balloon-expandable SAPIEN XT™ valve system, and compare it with the recently approved self-expandable ACURATE TA™ system by means of propensity score (PS) analysis.
Samples from a total of 310 consecutive patients treated with transapical transcatheter aortic valve implantation (TAVI) were included (2010–2014). The ACURATE valve was implanted in 40% ( n = 131), SAPIEN in 60% ( n = 179). To adjust for baseline differences, 1:1 PS matching was used, and resulted in 103 matched pairs. In addition to demographical and clinical variables, potential anatomical confounders (calcification grade: computed tomography (CT) Agatston score; annulus diameter: CT-effective diameter) were included within the PS estimation.
For ACURATE- versus SAPIEN-treated patients, the mean age was 83.1 ± 5.4 vs 79.8 ± 9.5 ( P < 0.001). Mean Society of Thoracic Surgeon scores were 7.7 ± 4.6 vs 8.1 ± 6.0 ( P = 0.56). PS matching resulted in bias reduction <0.2, indicating excellent balance and allowing for valid outcome comparison. Device success, 30-day mortality rate and 1-year survival were comparable. Pacemaker and 30-day neurological event rates were not significantly different. The need for post-ballooning was significantly higher in the self-expandable group (40% vs 9%; P < 0.001). Echocardiography upon discharge demonstrated excellent functional outcomes regarding residual paravalvular leaks (ACURATE: 3% vs SAPIEN: 4%, P = 1.0) with slightly higher mean gradients in the ACURATE group (12 ± 5 mmHg vs 10 ± 5 mmHg, P = 0.003).
The two transapical TAVI devices demonstrated comparable haemodynamic performance and clinical outcome. The self-expandable valve required more frequent post-ballooning without affecting the safety profile.
INTRODUCTION
Transcatheter aortic valve implantation (TAVI) is an accepted treatment modality for high-risk elderly patients with severe symptomatic aortic stenosis. Transcatheter-based aortic valve prostheses can be delivered either antegrade (transapical TA) or retrograde (transfemoral TF and other transvascular routes). Potential advantages of the TA approach are the short distance from the left ventricular apex to the target resulting in unmatched precise control of the devices, the avoidance of retrograde arch crossing especially in cases of severe calcification and the applicability of the technique in almost all patients independent of the vascular status.
During the early years of the rapidly evolving TAVI technology, only two transcatheter systems were commercially available: the balloon-expandable SAPIEN™ and the self-expanding CoreValve™ prostheses. As the latter does not allow for TA deployment, for years only one TAVI device was available for antegrade implantation. More recently, several new transapical TAVI prostheses have been developed, and approved for the European market [ 1 ]. One of these new valve concepts is the Symetis ACURATE™ device, which has shown promising outcomes in the early feasibility trials [ 2 ]. Data comparing the performance of the well-established SAPIEN™ device with the more recently introduced systems are not yet available.
Therefore, we analyse here our clinical experience with the new ACURATE™ prosthesis, and compare it with the ‘standard’ SAPIEN™ valve in a PS-matched study to balance for potential confounders.
METHODS
Patients
From December 2010 until March 2014, 310 patients with symptomatic aortic stenosis were scheduled for native transapical aortic valve implantation (TA-AVI) using either a balloon-expandable Edwards SAPIEN XT™ (Edwards Lifesciences, Irvine, CA, USA) or self-expandable ACURATE TA™ (Symetis, Ecublens, Switzerland) prosthesis (Fig. 1 ). Indication for TAVI was discussed within an interdisciplinary team, and all procedures were performed by a heart team. There are currently no guidelines to aid in choosing one valve over another. In cases of borderline short distances of the coronary ostia, the ACURATE device was favoured. Borderline large aortic annulus (28 mm) was a reason to choose the SAPIEN™ 29-mm prosthesis. Other than these specific factors, valve selection was balanced between both systems to gain further clinical experience. The local institutional ethics committee approved this study.
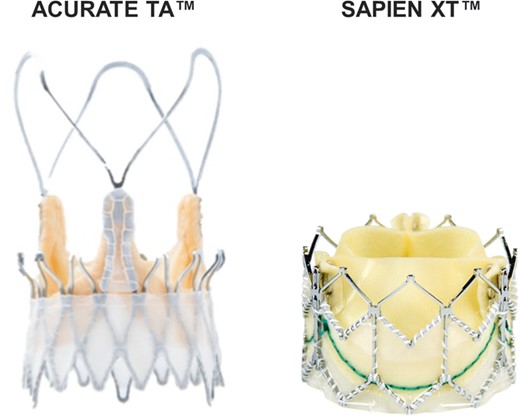
The ACURATE TA™ and the SAPIEN XT™ aortic valve prostheses.
Study end point definitions
The primary study end points were haemodynamic valve performance, requirement for balloon redilatation, need for pacemaker implantation, 30-day mortality rate, 1-year survival rate and occurrence of neurological events.
Secondary study end points were the amount of contrast dye, fluoroscopy time, valve-in-valve rescue procedure, left ventricular ejection fraction at discharge, necessity for conversion and procedure time.
Transient ischaemic attack (TIA) was defined as any new focal neurological deficit that resolved completely within 24 h. Any new, longer-lasting deficit was considered to be a stroke.
Cardio-computed tomography measurements
Prior to TAVI, multislice computed tomography examinations of the aortic valve and the thoracic aorta were accomplished with a dual source 2 × 64 slice scanner (Siemens Medical Solutions, Erlangen, Germany) as previously described [ 3 ].
Implantation technique
All procedures were performed either in a fully equipped and modified catheterization laboratory or more recently in a hybrid operative room. TA access was gained as described previously [ 4 ]. An advanced imaging modality (Siemens Syngo ValveGuide software) was utilized based on either the conventional preoperative CT raw data or intraoperative DynaCT scans [ 5 , 6 ].
The SAPIEN XT™ system was implanted following the standard technique as previously described in detail. Briefly, a stiff guidewire was placed in an antegrade fashion followed by balloon valvuloplasty (BAV) using the balloon provided within the SAPIEN™ set. For the more recent procedures, we used a ‘direct valve stenting’ technique without BAV (52% of the patients analysed in this study), as described by our group [ 3 ].
The ACURATE™ valve has recently been introduced in Europe, and is based on a self-expanding nitinol stent housing a regular porcine tissue valve. The system is designed to be implanted in a unique two-step technique using a sheathless delivery system. Details of the design and characteristics of the system have been previously described in detail [ 2 ]. In contrast to the balloon-expandable device, predilatation was performed in all cases employing the ACURATE™ valve.
Functional results were assessed by aortic root angiography and transoesophageal echocardiography in all patients. Balloon redilatation was performed only if a relevant paravalvular leak was observed despite optimal valve position. In cases where there was residual relevant leak potentially caused by suboptimal prosthesis position, a second valve was implanted as a rescue valve-in-valve procedure [ 7 ].
After routine apical and chest wall closure patients were extubated on the table, and transferred to an intermediate care unit following an ultra-fast-track protocol.
Follow-up
All patients underwent transthoracic echocardiographic examination before discharge. The mean follow-up time was 209 days.
Statistics
In Table 1 continuous data are presented as means ± standard deviation. Proportions are expressed as percentages. Comparison of baseline variables was performed with the Welch two sample t -test or the χ2 test with Yates' continuity correction depending on the underlying data type.
Baseline data of patients before and after propensity score matching
| Unmatched ( n = 310) | Matched ( n = 206) | |||||
|---|---|---|---|---|---|---|
| ACURATE ( n = 131) | SAPIEN ( n = 179) | P -values | ACURATE ( n = 103) | SAPIEN ( n = 103) | P -values | |
| Demographics and basic clinical data | ||||||
| Age (years) | 83 ± 5 | 80 ± 10 | <0.001 | 83 ± 5 | 83 ± 5 | 0.5 |
| Male sex (%) | 41 | 54 | 0.03 | 44 | 42 | 0.8 |
| BMI (kg/m 2 ) | 27 ± 5 | 27 ± 5 | 0.94 | 27 ± 5 | 27 ± 5 | 0.7 |
| GFR (ml/min/1.73 m 2 ) | 62 ± 26 | 60 ± 28 | 0.58 | 62 ± 27 | 62 ± 27 | 1.0 |
| NYHA ≥ III (%) | 91 | 93 | 0.44 | 91 | 91 | 1.0 |
| STS-PROM (%) | 7.70 ± 4.6 | 8.05 ± 6.0 | 0.56 | 7.95 ± 4.8 | 7.94 ± 5.3 | 1.0 |
| Imaging and invasive measurements | ||||||
| Pmean (mmHg) | 43 ± 16 | 41 ± 16 | 0.25 | 44 ± 16 | 42 ± 14 | 0.4 |
| EF (%) | 55 ± 11 | 51 ± 14 | 0.005 | 55 ± 11 | 55 ± 12 | 1.0 |
| Interventricular septum (mm) | 13 ± 2 | 13 ± 3 | 0.93 | 13 ± 2 | 13 ± 2 | 0.9 |
| Agatston score (AU) | 2849 ± 1416 | 2864 ± 1422 | 0.93 | 2777 ± 1377 | 2728 ± 1276 | 0.8 |
| Effective system annulus (mm) | 23.6 ± 2.0 | 24.3 ± 2.1 | 0.003 | 23.7 ± 2.0 | 23.8 ± 2.0 | 0.7 |
| Clinical history | ||||||
| s. p. syncope (%) | 13 | 17 | 0.35 | 14 | 16 | 0.5 |
| s. p. cardiac decompensation (%) | 34 | 40 | 0.23 | 34 | 36 | 0.8 |
| IDDM (%) | 6 | 6 | 0.85 | 8 | 6 | 0.6 |
| COPD (%) | 18 | 23 | 0.25 | 20 | 20 | 1.0 |
| Atrial fibrillation (%) | 40 | 32 | 0.19 | 37 | 39 | 0.8 |
| Hypertension (%) | 96 | 97 | 0.62 | 97 | 97 | 1.0 |
| Hypercholesterolaemia (%) | 41 | 51 | 0.09 | 48 | 48 | 0.9 |
| CAD (%) | 69 | 76 | 0.21 | 69 | 69 | 1.0 |
| Myocardial infarction (%) | 20 | 29 | 0.06 | 24 | 22 | 0.8 |
| MR ≥ 2+ (%) | 21 | 18 | 0.64 | 21 | 17 | 0.5 |
| AR ≥ 2+ (%) | 15 | 19 | 0.39 | 16 | 12 | 0.3 |
| TR ≥ 2+ (%) | 9 | 13 | 0.24 | 11 | 11 | 1.0 |
| Stroke (%) | 17 | 16 | 0.89 | 16 | 15 | 0.9 |
| ICA stenosis (%) | 12 | 19 | 0.10 | 15 | 14 | 0.7 |
| Pacemaker (%) | 14 | 17 | 0.46 | 15 | 15 | 0.8 |
| PCI (%) | 41 | 39 | 0.71 | 41 | 43 | 0.8 |
| Prior CABG surgery (%) | 22 | 34 | 0.03 | 24 | 23 | 0.9 |
| Prior AVR surgery (%) | 0 | 4 | 0.008 | 0 | 0 | 1.0 |
CAD: coronary artery disease; ICA: internal carotid artery; s.p.: status post; AR: aortic valve regurgitation; AVR: aortic valve replacement; Pmean : mean transvalvular gradients; BMI: body mass index; CABG: coronary artery bypass crafting; COPD: chronic obstructive pulmonary disease; EF: left ventricular ejection fraction; GFR: glomerular filtration rate; HTN: arterial hypertension; IDDM: insulin-dependent diabetes mellitus; MR: mitral regurgitation; NYHA: New York Heart Association stages of heart failure; PAOD: peripheral arterial occlusive disease; PCI: percutaneous coronary intervention; STS-PROM: Society of Thoracic Surgeons risk predicted risk of mortality; TR: tricuspid regurgitation.
K-level categorical baseline covariates were dichotomized as specified in Table 1 . Missing values were handled by 5-fold multiple imputation [ 8 ]. To increase comparability of groups [ 9 ], propensity score (PS) 1-to-1 matching was utilized with the nearest-neighbour algorithm without replacement and a 0.2 caliper setting [ 9 , 10 ]. An iterative approach was used to model the PS by logistic regression such that the best balance among groups was obtained. PS models included the following preoperative data: sex, age, body mass index, glomerular filtration rate, Society of Thoracic Surgeons risk predicted risk of mortality, delta Pmean , ventricular septum thickness, ejection fraction, Agatston score of the aortic valve, systolic effective aortic annulus diameter (CT-based), aortic regurgitation ≥2+, mitral regurgitation ≥2+, tricuspid regurgitation ≥2+, New York Heart Association stadium ≥ III, history of syncope, history of acute cardiac decompensation, insulin-dependent diabetes, chronic obstructive pulmonary disease, arterial hypertension, coronary artery disease, myocardial infarction, hypercholesterolaemia, internal carotid artery stenosis, any type of stroke, atrial fibrillation, prior pacemaker implantation, prior PCI and any previous cardiac surgery.
Analysis of outcomes was first performed after sufficient covariate balance between the groups was obtained [ 11 ]. The matched pair outcome data were tested with the appropriate statistical methods: categorical outcomes with the exact McNemar's test [ 12 ], continuous outcomes with either a paired t -test or the Wilcoxon sign-rank test depending on the distribution and time-to-event data with the stratified log-rank test.
Multiple imputation was performed with the ‘mice’ R package [ 13 ]. Balance checking before and after matching, sample average treatment effect for the treated estimation, and test statistics calculation were performed using the ‘Matching’ R package [ 14 ].
A two-tailed P -value of <0.05 was considered significant. Statistical analyses were performed using R 3.1 (R Development Core Team. R: A Language and Environment for Statistical Computing 2011); plots were created with the ggplot2 package [ 15 ].
RESULTS
Patient characteristics and propensity score matching
Baseline characteristics of all n = 310 patients are given in Table 1 (left column). An ACURATE™ prosthesis was implanted in 40% ( n = 131) of cases, a SAPIEN™ in 60% ( n = 179).
PSs, composed of 29 baseline covariates consisting of typical clinical and demographic data and valve morphological data such as calcium load and annular diameter, showed a sufficient overlap for efficient case matching (Fig. 2 ). Matching resulted in 103 matched pairs (matching efficiency 79%), and yielded good bias reduction as shown in Fig. 3 . The absolute standardized mean differences of all covariates were far <0.2, indicating a good balance. Especially highly unbalanced covariates such as age, ejection fraction, sex, CT-based effective annulus diameter, history of coronary artery bypass crafting or aortic valve replacement surgery were effectively balanced in the matched pairs. Baseline characteristics of the matched pairs are given in Table 1 (right column).
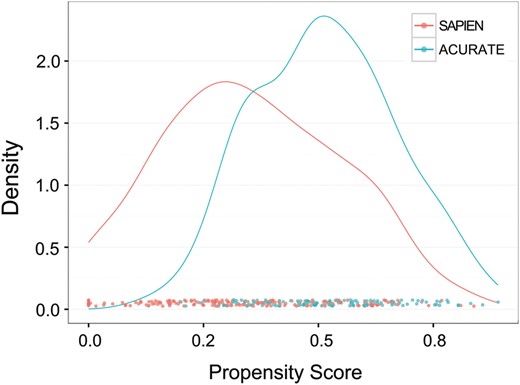
Distribution of propensity scores. Both groups showed sufficient overlap such that matching was effectively achieved.
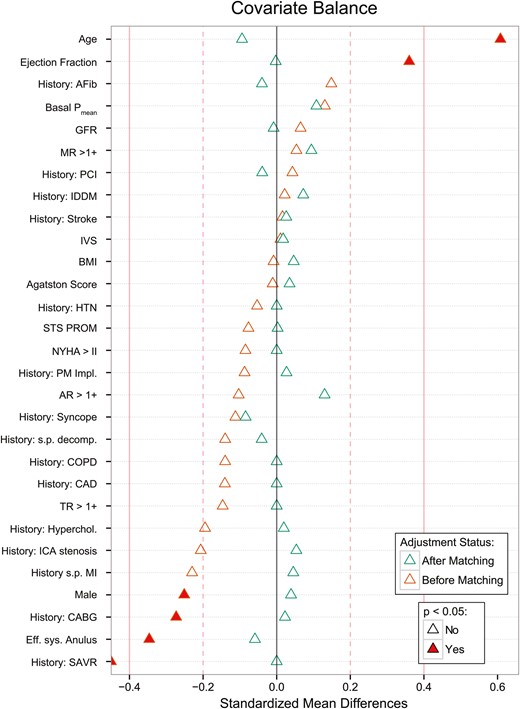
Bias reduction plotted as standardized mean differences of baseline variables between the ACUARTE and SAPIEN groups. The solid red line indicates a standardized mean difference of 0.4, the dashed red line a difference of 0.2. Standardized mean difference of 0 indicates no difference among groups. Baseline differences before propensity score matching (red triangles) were effectively balanced after matching (blue triangles). CAD: coronary artery disease; ICA: internal carotid artery; s.p.: status post; AR: aortic valve regurgitation; AVR: aortic valve replacement; Pmean : mean transvalvular gradients; BMI: body mass index; CABG: coronary artery bypass crafting; COPD: chronic obstructive pulmonary disease; EF: left ventricular ejection fraction; GFR: glomerular filtration rate; HTN: arterial hypertension; IDDM: insulin-dependent diabetes mellitus; MR: mitral regurgitation; NYHA: New York Heart Association stages of heart failure; PAOD: peripheral arterial occlusive disease; PCI: percutaneous coronary intervention; STS-PROM: Society of Thoracic Surgeons risk predicted risk of mortality; TR: tricuspid regurgitation.
Clinical and functional results
All valve implantations were uneventful except the following severe complications leading to conversion: for the ACURATE group, annular rupture ( n = 1, following repeated balloon redilatation); for the SAPIEN group, annular rupture ( n = 1, ventricular septal defect).
Table 2 summarizes the perioperative outcome. As expected, there was a significantly higher redilatation rate in the ACURATE group compared with the SAPIEN group [ACURATE 40%, SAPIEN 9%, odds ratio (OR) = 7, 95% confidence interval (CI): 3–27, P < 0.001]. Immediate postimplantation angiography revealed comparable rates of relevant (≥2+ grade) residual paravalvular leaks (ACURATE 8%, SAPIEN 8%, OR = 1, 95% CI: 0.3–3.1, P = 1). Echocardiography at discharge demonstrated slightly higher mean transvalvular gradients in the ACURATE group (12.1 mmHg, 95% CI: 11–13 mmHg versus SAPIEN 10.3 mmHg 95% CI: 9–11 mmHg, P = 0.003). The echocardiographic rate of relevant paravalvular leak upon discharge revealed a significant improvement over time in both groups compared with the angiographic results, and did not differ significantly among the groups (ACURATE 3%, SAPIEN 4%, OR = 0.7, 95% CI: 0.1–5.8, P = 1.0). Thirty-day mortality and 1-year survival rates were comparable (Fig. 4 ). Thirty-day all neurological event rates (ACURATE: 2%, SAPIEN: 7%; OR = 0.3, 95% CI: 0.03–1.50, P = 0.18) were comparable; these consisted almost entirely of TIAs. One stroke occurred in the SAPIEN group and none occurred in the ACURATE group. New pacemaker implantation was required in a slightly higher number of patients treated with the self-expandable prosthesis, however, without reaching statistical significance (ACURATE: 11%, SAPIEN: 4%; OR = 3.0, 95% CI: 0.8–11.8, P = 0.12). Secondary end points did not differ significantly between the two devices (Table 2 ).
Outcomes after propensity score matching
| ACURATE ( n = 103) | SAPIEN ( n = 103) | P -values | |
|---|---|---|---|
| Primary end points | |||
| Angiographic PVL ≥ 2+ ( n ) | 8 8% | 8 8% | 1.00 a |
| Pmean discharge (mmHg) | 12 (11–13) | 10 (9–11) | 0.003 b |
| Echocardiographic PVL ≥ 2+ ( n ) | 3 3% | 4 4% | 1.00 a |
| All neurological events ( n ) | 2 2% | 7 7% | 0.18 a |
| Redilatation required ( n ) | 41 40% | 9 9% | <0.001 a |
| Pacemaker implantation ( n ) | 11 11% | 4 4% | 0.12 a |
| Secondary end points | |||
| LV ejection fraction (%) | 58 (56–60) | 57 (55–59) | 0.24 b |
| Fluoroscopy time (s) | 289 (241–366) | 287 (222–392) | 0.88 c |
| Contrast dye (ml) | 70 (50–85) | 70 (60–90) | 0.45 c |
| Rescue valve-in-valve ( n ) | 2 2% | 3 3% | 1.0 a |
| Conversion ( n ) | 1 1% | 1 1% | 1.0 a |
a Exact McNemar's test; counts with percentages are given in the columns.
b Paired t -test; mean values with 95% confidence interval are given in the columns.
c Wilcoxon sign-rank test; median values with interquartile range are given in the columns.
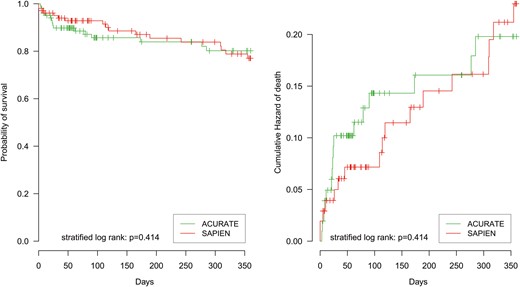
Survival analysis of ACURATE versus SAPIEN for the 1-year follow-up. Left plot: Kaplan–Meier curve. Right plot: cumulative hazard of death.
DISCUSSION
Although TAVI is considered today to be a routine procedure in most higher-volume centres, several issues are still unsolved. The occurrence of a more-than-mild residual paravalvular leak (>1+) has been shown to be associated with increased mid-term mortality [ 16 ]. Severe intraprocedural complications such as coronary occlusion or annular rupture are fortunately rare but devastating. In general, a significant learning curve inherent to all new technologies has also been observed for TAVI procedures [ 17 ]. Over the last few years, general knowledge of specific risk factors and strategies on how to avoid these complications has improved tremendously. Despite sophisticated image-based screening, however, severe complications cannot be fully avoided or always foreseen. Thus, the development of new TAVI prostheses that are based on new concepts is justified in order to facilitate the selection of the most appropriate TAVI device tailored to the individual patient anatomy. In addition to the long-approved balloon-expandable SAPIEN™ prosthesis, several new nitinol-based self-expanding devices designed for antegrade TA implantation have just recently become available [ 1 ] but data allowing direct head-to-head comparison are still sparse. To our knowledge, our analysis is the first to provide such evidence.
Device characteristics
For the SAPIEN™ prosthesis, a large body of evidence concerning clinical outcomes is available [ 18 ]. Advantages are the versatility of the device, which allows for implantation via retrograde and antegrade routes, as well as the option for use within a valve-in-valve setting. The balloon-expandable concept facilitates a ‘direct valve stenting’ technique that has been shown to be feasible without impacting the functional performance [ 3 ]. It has been suggested, however, that the relatively high radial forces inherent to the device might lead to higher rates of annular ruptures compared with self-expanding types of devices. Our data did not confirm this assumption. We did observe a case of post-ballooning after the implantation of a self-expandable stent that resulted in annular rupture due to the same mechanism; however, as annular rupture is fortunately an extremely rare complication, the limited number of patients included is probably insufficient to fully assess this issue. In addition, coronary obstruction has been linked to the usage of the SAPIEN™ prosthesis. Although reported repeatedly in the literature, these complications can most likely be avoided if a meticulous image-based screening protocol is followed.
In cases with short coronary distances and tubular root geometry, we give preference to the self-expandable ACURATE™ concept in our decision-making process for TA access as the characteristic ‘pull-down’ manoeuver during the implantation might avoid coronary occlusion [ 2 ]. In addition, the ACURATE™ device allows for correct anatomical orientation. Thus, the alignment of device and native commissures will avoid the positioning of a stent-post in front of coronary ostia. Although not yet supported by evidence from the literature, this strategy might ease interventional access to the coronaries at later points in time.
Outcomes
In general, the outcome data regarding performance and safety profiles were quite similar between the two devices studied. As expected, it was necessary to post-dilate more frequently in the self-expanding group. However, this did not impair the safety profile, and resulted in excellent functional outcomes, especially with regard to low rates of paravalvular leaks, which was also demonstrated in previous studies using the ACURATE™ device [ 2 ]. This is in contrast to what was reported in a recent meta-analysis revealing higher residual leak rates in a self-expanding CoreValve™ group compared with a SAPIEN™ device group [ 19 ]. Thus, residual leaks do not seem to be specifically associated with a self-expandable concept but rather with the stent design itself.
We observed a slightly higher gradient in the ACURATE group that reached statistical significance. Whether this difference is clinically relevant, however, remains to be proven. The difference in gradients most likely is due to the full porcine root concept used within the ACURATE™ stent. Although this might be beneficial in terms of long-term durability as full-thickness leaflets are used, slightly higher gradients are the consequence. Compared with standard surgical valves, however, the mean gradients observed are still excellent.
Compared with the 1-year survival reported in the literature for the SAPIEN™ prosthesis [ 18 ], our results are favourable, and similar for the two devices. These are especially important data for the newly approved ACURATE™ device, confirming its safety profile in comparison with the long-approved ‘standard’ TA valve.
Limitations
This is a single-centre study of an observational nature. Although the data were collected prospectively, this is a retrospective analysis. The most important limitation of observational research is the possibility of confounding variables. We addressed this by utilizing multiple imputation to avoid selection bias, by using PS matching to avoid confounding, and by strictly separating the study design and analysis phase [ 8 , 10 , 11 ]. Nevertheless, there is the possibility of bias due to unmeasured or unknown confounders that only can be addressed by a randomized controlled trial. Our PS analysis, however, reflects ‘real-world’ patients enrolled in an all-comers fashion rather than a highly selected trial population, which might allow for an even more valid conclusion with greater relevance to daily clinical routine.
CONCLUSION
In this first systematic head-to-head comparison of two different transapical TAVI systems, the prostheses demonstrated similar device success rates with overall excellent haemodynamic performance. Safety profiles, clinical outcomes and 1-year survival were comparable. In the future, the next-generation valves, SAPIEN 3 and ACURATE neo, will likely further improve the outcomes for the sake of the patients.
Funding
Conflict of interest : Kempfert J. and Moellmann H. have received proctoring and lecturing fees from Symetis and St Jude Medical.
REFERENCES
APPENDIX. CONFERENCE DISCUSSION
Dr P. Suwalski(Warsaw, Poland): I think it is valuable because it is probably the first head-to-head comparison between nitinol self-expandable and balloon-expandable valves.
Could you elaborate a bit more on which valve you would choose on a regular basis, in which patient it would be, rather SAPIEN or ACURATE, especially in which patients would you discourage eventually the ACURATE valve?
The second question is about post-dilatation. I have written that recently you stopped post-dilatation, or you do not do it as often, like in the first experience, why did you change your policy and how open are you to paravalvular leaks in self-expandable valves in terms of dynamics of the leaks within the next days or weeks?
Dr Meyer: I will start with the second question. What we were writing about was not the post-dilatation, it was the predilatation. We published this study last year and we presented it also here at the EACTS meeting. It was about omission of predilatation in the balloon-expandable SAPIEN XT. After we were convinced with the results, we changed mostly our practice, and that is why around 55% of the SAPIEN XT-treated patients did not receive an extra predilatation in this study. It was not about post-dilatation.
As this is the first study, as I quickly mentioned, there is not really a guideline at the moment for the choice of treatment. However, we can infer from the valve size that for the large annuli the SAPIEN XT is the treatment of choice, and due to the characteristically pull-down manoeuvre as well as the anatomical rotation of the Symetis TA valve deployment, for the short coronary distance this might be the choice of treatment.
Dr T. Walther(Bad Nauheim, Germany): Maybe I can add a few comments on that. Basically I believe it is always good if you have one disease that you have two treatment options, and there are obviously two, a balloon and a self-expanding valve. So I think if you have your armamentarium in a hospital and you have both options that are good, because there are patients who may have very calcified root where you don't want to use a balloon-expandable valve. On the other hand, the newer balloon-expandable valves like the SAPIEN 3 obviously were not yet included in this trial and they may offer other features. So we just have to see in the future.
But having two options brings, of course, you to see the advantages of the one and the other, and thus the thing can develop to the perfect solution maybe at some time.
Dr V. Bapat(London, UK): Dr Meyer, I have a statistical question for you. Most of the surgeons in the audience, we take it for granted when somebody presents that propensity matching is great, but is there any development in statistical methods by which the two groups are more comparable than before? The reason I am asking is in TAVI we know that frailty can count a lot on the outcome. Frailty is very difficult to capture, forget matched by propensity, and I think in your propensity matching I didn't see any frailty score which was matched. So do you think there are any methods to negate that disadvantage?
Dr Meyer: I think very often the propensity score studies are not well conducted when I read them, and also there is some initiative also to create something like a CONSORT statement for propensity studies, because when you just look at the P -values afterwards, you are not at all sure whether the distribution is the same of the covariates. So you have to be always careful that it is conducted well and also showed a good bias reduction, and then you can get valid estimates. If this is not the case, the estimates might not be valid.
To the second question you asked, frailty is difficult to assess, and we did not include this covariate in our study. It is a known confounder, and that is a potential limitation in our study. So the confounders you don't measure still can be confounding, that is a common limitation of propensity score analyses. When there is an unknown confounder or not measured confounder, it could be that the estimates are not 100% valid.
Dr Bapat: I think what was encouraging was that the survival curve at one year was the same in both of the devices.
Author notes
Presented at the 28th Annual Meeting of the European Association for Cardio-Thoracic Surgery, Milan, Italy, 11–15 October 2014.
The first two authors contributed equally to this study.
