


Abstract
Conclusive evidence is lacking regarding the benefits and risks of performing off-pump versus on-pump coronary artery bypass graft (CABG) for patients with diabetes. This study aims to compare clinical outcomes after off-pump and on-pump procedures for patients with diabetes.
The Bypass Angioplasty Revascularization Investigation 2 Diabetes (BARI 2D) trial enrolled patients with type 2 diabetes and documented coronary artery disease, 615 of whom underwent CABG during the trial. The procedural complications, 30-day outcomes, long-term clinical and functional outcomes were compared between the off-pump and on-pump groups overall and within a subset of patients matched on propensity score.
On-pump CABG was performed in 444 (72%) patients, and off-pump CABG in 171 (28%). The unadjusted 30-day rate of death/myocardial infarction (MI)/stroke was significantly higher after off-pump CABG (7.0 vs 2.9%, P = 0.02) despite fewer complications (10.3 vs 20.7%, P = 0.003). The long-term risk of death [adjusted hazard ratio (aHR): 1.41, P = 0.2197] and major cardiovascular events (death, MI or stroke) (aHR: 1.47, P = 0.1061) did not differ statistically between the off-pump and on-pump patients. Within the propensity-matched sample (153 pairs), patients who underwent off-pump CABG had a higher risk of the composite outcome of death, MI or stroke (aHR: 1.83, P = 0.046); the rates of procedural complications and death did not differ significantly, and there were no significant differences in the functional outcomes.
Patients with diabetes had greater risk of major cardiovascular events long-term after off-pump CABG than after on-pump CABG.
INTRODUCTION
The risk of cardiovascular disease is two to four times higher among individuals with diabetes than among those without diabetes [1–3]. The BARI trial demonstrated that coronary artery bypass graft procedure (CABG) improves survival when compared with percutaneous coronary intervention (PCI) in patients with diabetes and multivessel coronary artery disease [4]. A decade later, the BARI 2D trial established that major cardiovascular outcomes were lower with CABG when compared with medical therapy alone for patients with diabetes and stable coronary artery disease [5].
Traditionally, CABG has been performed on-pump, that is, using the cardiopulmonary artery bypass (CPB) and cardioplegic arrest. The use of CPB has been associated with post-procedure myocardial, pulmonary, renal and cerebral complications [6–9]. However, it has been suggested that off-pump CABG, which does not require CPB, may avoid many of these complications and thus result in better clinical outcomes.
The comparative effectiveness of the off-pump procedure has been controversial and few studies compared off-pump and on-pump CABG among patients with diabetes [10–13]. These studies are single-centred, retrospective and lack long-term outcomes. Consequently, the current evidence is inadequate to make conclusions regarding the relative risks and benefits of using off-pump versus on-pump CABG for diabetic individuals.
We aim to determine the risks and benefits of off-pump CABG compared with on-pump CABG for patients with diabetes using data from the multicentre BARI 2D study.
MATERIALS AND METHODS
Study population
The design, patient characteristics and primary results of the BARI 2D clinical trial have been previously described in detail [5]. Briefly, BARI 2D was a 2 × 2 factorial design clinical trial that included 2368 patients with type 2 diabetes and angiographically documented coronary artery disease. Participants were enrolled between 1 January 2001 and 31 March 2005 from 49 sites across the USA, Canada, Brazil, Mexico, the Czech Republic and Austria. All patients underwent informed consent prior to entry into the study, and every site had Institutional Review Board (IRB) approval. In addition, the Coordinating Center maintained the IRB approval for the study as a whole. Randomization was stratified by the intended revascularization method (i.e. whether a patient was more suitable for CABG or PCI, determined by the individual site physicians). The eligible patients were randomly assigned to either prompt revascularization or medical therapy within each stratum. Simultaneously, the patients were randomly assigned to the treatment of hyperglycemia with either insulin sensitization or insulin provision therapy to achieve a target HbA1c <7.0%. The trial actively managed diabetes and cardiovascular risk factors for all patients through the patient's 6-year visit or until the last annual visit prior to 1 December 2008. Clinic visits for all patients were scheduled on a monthly basis for the first 6 months and quarterly thereafter.
This analysis included BARI 2D patients who underwent a CABG procedure, irrespective of their intended method of revascularization or the assigned treatment arm. If a patient had more than one CABG, the first CABG procedure was used for all evaluations and comparisons.
Surgical techniques
Characteristics of patients having CABG within the trial have previously been described in detail [14]. All operations in BARI 2D were performed by experienced and established surgeons certified by the trial. The decision to perform an off-pump versus an on-pump procedure was based on clinical site practice patterns, individual surgeon preference, clinical characteristics of the patient and the perceived target vessel quality. The trial protocol called for bypassing all stenoses that were believed to contribute to a patient's clinical symptoms and ischaemia; however, incomplete revascularization could be planned in cases where the morphological features did not allow bypass of all lesions. It was also strongly recommended to use at least one internal mammary conduit if possible.
Outcomes
The primary end-point of BARI 2D trial was mortality, and the principal secondary end-point was the composite of death, myocardial infarction (MI) and stroke. The average follow-up time in the BARI 2D trial was 5.3 years. For this analysis, we also considered a repeat revascularization outcome defined as any PCI, CABG or laser myocardial revascularization required after CABG as a secondary outcome. The peri-/post-procedural complications (within-hospital) were categorized as neurological, cardiac, renal, vascular, pulmonary, bleeding and inotrope use for >48 h. Neurological complications included transient cerebrovascular event, cerebrovascular accident, dementia and coma. Cardiac complications encompassed non-fatal cardiac arrest, suspected MI, congestive heart failure, pulmonary oedema (cardiac), cardiogenic shock and cardiac tamponade. Vascular complications included arterial embolism of extremity or loss of pulse requiring treatment. Renal failure requiring dialysis was categorized as a renal complication. Respiratory failure, pulmonary embolus, chest tube >3 days post-procedure were classified as pulmonary complications. Bleeding complications comprised haemorrhage that required transfusion and any reoperation for bleeding.
In addition to the clinical outcomes, we assessed functional outcomes during the 4 years after surgery in the off-pump and on-pump groups. The functional outcomes included angina and Duke Activity Status Index (DASI) scores. DASI is a 12-item index [0 (worst) to 58.2 (best)] that assesses the patient's ability to perform specific physical activities. The trial collected information on angina and quality of life on a quarterly and yearly basis, respectively.
Statistical analyses
Baseline demographic and clinical characteristics were compared between patients undergoing on-pump and off-pump CABG procedures. Summary statistics for the baseline characteristics are presented as means and standard deviation (SD) in case of continuous variables, and as numbers and percentages in case of categorical variables. Continuous variables were compared using Wilcoxon rank-sum test and categorical variables using χ2 or Fisher's exact, where appropriate.
Two separate sets of analyses were conducted to compare the outcomes between off-pump and on-pump CABG. The first analysis included all patients who underwent CABG within the trial and had information regarding the use of pump during the procedure. The procedural (within-hospital) complications, short-term clinical outcomes (within 30 days of CABG), any repeat revascularizations were compared using the χ2 or Fisher's test. Only unadjusted analyses were conducted for complications, repeat revascularization and short-term clinical outcomes, due to small number of events. The clinical outcomes of death and major cardiovascular events (death/MI/stroke) over the follow-up period were evaluated as time-to-event outcomes using Kaplan–Meier curves, log-rank statistics and multivariate Cox proportional hazard models. The proportional hazard assumptions between the on-pump and off-pump groups were tested. Generalized linear models, with time specified as a within-subject effect, were used to compare the functional outcomes including angina and DASI scores between patients undergoing off-pump and on-pump CABG.
The candidate variables included in multivariable models as possible confounders comprised the baseline characteristics that were significantly different between the two CABG groups. The final sets of covariates for outcomes such as death and major cardiovascular events were based on stepwise backward-selection model building algorithm that used an α = 0.10 for variable elimination, and the off-pump/on-pump variable was forced into the model after the covariates were selected. The final covariates for the functional outcomes included the baseline characteristics that were significantly different between the two groups. We tested for statistical interaction between the type of CABG and country of surgery for the clinical and functional outcomes. In addition, we tested for statistical interaction between the CABG type and time for longitudinal functional outcomes.
In the second analysis, a propensity score methodology was used to control for the non-randomized treatment selection of the two groups. The propensity scores represent the probability that a patient would undergo an off-pump CABG when compared with an on-pump CABG given his/her preoperative characteristics. Propensity scores for each patient were calculated, using multivariable logistic regression model. The model considered a broad set of candidate variables, baseline characteristics that were different between the off-pump and on-pump group at a significance level of 0.20 (excluding country). Backward-selection methods utilizing a liberal α = 0.20 for eliminating variables were used to further refine the model. Based on the calculated propensity scores, patients undergoing off-pump CABG were matched with those undergoing on-pump (1:1 match, without replacement) using a caliper of 0.01. Regional differences were not included in the propensity score and were handled with model adjustment. Within the matched dataset, baseline characteristics were compared using Wilcoxon signed-rank test for continuous variables, McNemar's test of symmetry for categorical variables. The post-procedural complications and short-term clinical outcomes and repeat revascularization rates were compared using McNemar's tests. Cox proportional-hazard regression models adjusted for region with robust standard errors were created to determine the association between type of surgery and time to death and time to the composite of death, MI or stroke. Functional outcomes, angina and DASI scores, were compared using generalized linear model accounting for the correlations within the matched pairs and repeated observations per patient.
For all analysis, missing covariate values were imputed, using the mean or the most common value so that all patients with non-missing outcome data are incorporated in the clinical and functional outcome models. The geographic regions were categorized as the USA/Canada and others (Mexico, Brazil, Czech Republic and Austria). The time-to-event analyses used the date and time of the index CABG procedure as ‘time zero’. The event time was calculated based on the number of days to the first event. If no event occurred, data were censored at the last available follow-up patient date for death/MI/stroke or the vital status record date (when evaluating death). All analyses were performed, using the SAS enterprise guide 4.3.
RESULTS
Patient characteristics
Of the 2368 patients enrolled in BARI 2D, 621 (26%) underwent a CABG procedure during the trial (illustrated in Fig. 1). Of the patients assigned revascularization procedure (i.e. they were assigned to the prompt revascularization, 347 received a CABG as their first revascularization procedure within 6 months of study entry), 76 received a CABG as their first surgical revascularization procedure but it occurred after a PCI procedure (n = 65) or more than 6 months after study entry (n = 11). Of the 1192 patients randomized to medical therapy, 198 patients received a subsequent CABG. Overall, 468 (75%) of the patients who received a CABG, were allocated prior to randomization to the CABG stratum (117 patients were those who were randomized to medical therapy and 351 patients were those who were randomized to revascularization) and the remainder to the PCI stratum. Six CABG patients had missing off-pump/on-pump use information and were excluded from the analysis. This resulted in a final sample size of 615 patients, of whom 171 (27.8%) underwent off-pump and 444 (72.2%) underwent on-pump CABG. The average (SD) follow-up time for this sample of patients was 4.2 (1.7) years where the time of the CABG procedure was considered as time 0.
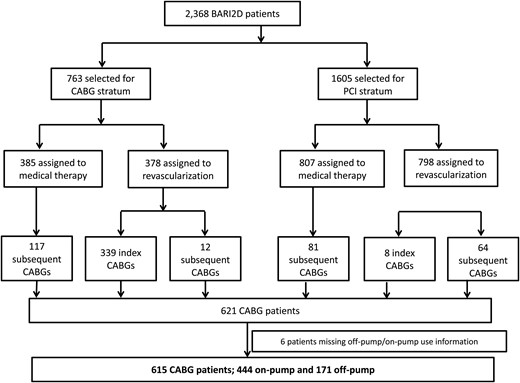
Sample population from BARI 2D trial undergoing a CABG procedure. CABG: coronary artery bypass graft.
Patients undergoing off-pump CABG were more likely to be randomized to prompt revascularization, have CABG as their assigned index procedure and have been allocated to the CABG intended method of revascularization stratum (Table 1). Patients undergoing off-pump were also younger, more likely to be female, had undergone a non-coronary vascular surgery prior to CABG, had higher glomerular filtration rate, lower serum creatinine levels, higher left ventricular ejection fraction (LVEF), higher HbA1c and higher energy scores. The distribution of CABG type varied significantly by country. The majority of CABGs performed in Brazil and Czech Republic/Austria were off-pump, whereas most in the USA/Canada were on-pump. The two groups also differed in terms of their aspirin and diuretic medications within 48 h prior to procedure.
Baseline characteristics of all patients and those in the propensity score-matched dataset by type of procedure
| All patients undergoing CABG with type of procedure information | Patients in the propensity score-matched dataset | |||||
|---|---|---|---|---|---|---|
| On-pump (N = 444) | Off-pump (N = 171) | P-valuesb | On-pump (N = 153) | Off-pump (N = 153) | P-valuesc | |
| CABG stratum | 325 (73%) | 139 (81%) | 0.04* | 121 (79%) | 125 (82%) | 0.17 |
| Assigned to revascularization (all strata) | 278 (63%) | 145 (85%) | <0.0001* | 134 (88%) | 127 (83%) | 0.50 |
| Assigned to insulin providing | 231 (52%) | 86 (50%) | 0.70 | 73 (48%) | 76 (50%) | 0.74 |
| Index CABG (all strata) | 222 (50%) | 125 (73%) | <0.0001* | 116 (76%) | 111 (73%) | 0.44 |
| Time to CABG after randomization in days, mean (SD) | 341 (506) | 167.3 (385) | <0.0001* | 206 (424) | 152 (341) | 0.34 |
| Geographical Region | <0.0001* | <0.0001* | ||||
| USA | 253 (57%) | 53 (31%) | 82 (54%) | 46 (30%) | ||
| Canada | 115 (26%) | 8 (4.7%) | 35 (23%) | 8 (5.2%) | ||
| Mexico | 15 (3.4%) | 21 (12%) | 10 (6.5%) | 18 (12%) | ||
| Brazil | 43 (9.7%) | 85 (50%) | 16 (11%) | 78 (6.0%) | ||
| Czech Republic/Austria | 18 (4.1%) | 4 (2.3%) | 10 (6.5%) | 3 (2.0%) | ||
| Other baseline characteristics | ||||||
| Age in years, mean (SD) | 64 (8.7) | 62 (8.2) | 0.03* | 64 (8.8) | 62 (8.04) | 0.13 |
| Male sex | 340 (77%) | 116 (68%) | 0.03* | 42 (73%) | 50 (67%) | 0.30 |
| Race white, non-Hispanic | 305 (69%) | 112 (66%) | 0.45 | 103 (67%) | 102 (67%) | 0.90 |
| Obesity (BMI >30 kg/m2) at baseline | 240 (54%) | 64 (38%) | 0.0002* | 64 (42%) | 61 (40%) | 0.56 |
| Number of vessels with >50% lesions, % | 0.88 | 0.43 | ||||
| ≤1-vessel disease, % | 88 (19.8%) | 30 (17.5%) | 23 (15%) | 22 (14%) | ||
| 2-vessel disease, % | 174 (39%) | 72 (42%) | 71 (46%) | 63 (41%) | ||
| 3-vessel disease, % | 182 (41%) | 69 (40%) | 57 (37%) | 66 (43%) | ||
| Myocardial Jeopardy score | 60.0 (22) | 56 (22) | 0.10 | 58 (23) | 59 (21) | 0.89 |
| LVEF at the time of evaluation: prior to randomizationa | 57 (12) | 60.0 (9.5) | 0.006 | 59 (12) | 60 (9.7) | 0.69 |
| Conditions any time prior to CABG | ||||||
| Previous MI | 160 (36%) | 71 (42%) | 0.21 | 52 (34%) | 67 (44%) | 0.09 |
| CVA prior to CABG | 45 (10%) | 13 (7.6%) | 0.34 | 9 (5.9) | 12 (7.8) | 0.51 |
| COPD prior to CABG | 17 (3.8) | 2 (1.2) | 0.09 | 0 | 2 (1.3) | – |
| Non-coronary vascular surgery prior to CABG | 7 (1.6) | 8 (4.8) | 0.03* | 3 (2.0) | 4 (2.6) | 0.71 |
| Any CHF therapy prior to CABG | 76 (17%) | 21 (12%) | 0.14 | 25 (16%) | 20 (13%) | 0.11 |
| NYHA class if any CHF prior to CABG | ||||||
| Class I | 34 (7.7%) | 9 (5.3%) | 12 (7.8%) | 7 (4.6%) | ||
| Class II | 32 (7.2%) | 6 (3.5%) | 11 (7.2%) | 6 (3.9%) | ||
| Class III | 6 (1.4%) | 2 (1.2%) | 0 (0%) | 2 (1.3%) | ||
| Class IV | 2 (0.5%) | 2 (1.2%) | 2 (1.3%) | 2 (1.3%) | ||
| Previous percutaneous coronary intervention | 111 (25%) | 40 (23%) | 0.68 | 35 (23) | 34 (22.22) | 0.90 |
| Dyspnoea or SOBa | 315 (89%) | 92 (92%) | 0.50 | 94 (85%) | 85 (93%) | 0.17 |
| Conditions at the last visit prior to CABG | ||||||
| Hypertension at visit prior to surgery (sitting BP >130/80)a | 168 (38%) | 81 (42%) | 0.03* | 66 (44%) | 74 (49%) | 0.43 |
| Triglycerides at visit prior to surgery, mean (SD) | 168 (107) | 168 (81) | 0.19 | 162 (90) | 168 (79) | 0.17 |
| GFR, ml/min/1.73 m2, mean (SD) | 73 (22) | 80 (24) | 0.01* | 78 (22) | 79 (24) | 0.77 |
| Serum creatinine, mg/dl, mean (SD) | 1.12 (0.33) | 1.03 (0.28) | 0.0015* | 1.04 (0.26) | 1.03 (0.28) | 0.48 |
| Smoking | 0.5908 | 0.90 | ||||
| Current | 61 (14%) | 19 (11%) | 17 (11.11) | 17 (11.11) | ||
| Previous | 232 (55.98%) | 89 (52.05%) | 79 (51.63) | 80 (52.29) | ||
| Never | 150 (34%) | 63 (37%) | 57 (37.25) | 56 (36.60) | ||
| HbA1c % | 7.5 (1.5) | 7.8 (1.8) | 0.048* | 7.5 (1.6) | 7.8 (1.8) | 0.43 |
| QoL at last visit prior to CABG | ||||||
| Health rating | 64 (20) | 63 (20) | 0.49 | 64 (21) | 63 (20) | 0.68 |
| Self-rated health | 0.22 | 0.31 | ||||
| Poor | 49 (11%) | 17 (10%) | 17 (11%) | 14 (9%) | ||
| Fair | 149 (34%) | 65 (39%) | 54 (36%) | 57 (38%) | ||
| Good | 187 (43%) | 75 (45%) | 59 (39%) | 70 (47%) | ||
| Very good | 47 (11%) | 8 (4.8%) | 20 (13%) | 7 (4.7%) | ||
| Excellent | 7 (1.6%) | 3 (1.8%) | 2 (1.3%) | 2 (1.3%) | ||
| DASI (0–58.2) | 18 (13) | 16 (10) | 0.25 | 18 (13) | 16 (10) | 0.31 |
| Health distress score (0–100) | 39 (26) | 37 (25) | 0.59 | 38 (25) | 38 (24) | 0.96 |
| At the time of surgery | ||||||
| Angina status at the time of surgery | 0.52 | 0.56 | ||||
| Stable | 358 (81%) | 138 (81%) | 132 (86%) | 123 (80%) | ||
| Class I | 109 | 28 | 38 | 24 | ||
| Class II | 135 | 75 | 65 | 67 | ||
| Class III | 88 | 25 | 25 | 23 | ||
| Class IV | 20 | 6 | 3 | 6 | ||
| Unstable | 71 (16%) | 30 (18%) | 18 (12%) | 27 (18%) | ||
| Acute MI | 15 (3.4%) | 3 (1.8) | 3 (2.0%) | 3 (2.0%) | ||
| Medication preprocedure (within 48 h), % | ||||||
| Aspirin | 284 (64%) | 71 (42%) | <0.0001* | 91 (59.48) | 62 (40.52) | 0.40 |
| β-blockers | 388 (87%) | 157 (92%) | 0.12 | 135 (88%) | 142 (93%) | 0.16 |
| ACE inhibitors | 284 (64%) | 102 (60%) | 0.32 | 100 (65%) | 91 (59%) | 0.27 |
| Calcium antagonists | 155 (35%) | 55 (32%) | 0.52 | 49 (32%) | 48 (31%) | 0.90 |
| Nitrates | 249 (56%) | 85 (50%1) | 0.16 | 77 (50%) | 78 (51%) | 0.91 |
| Diuretics | 181 (41%) | 49 (29%) | 0.0054* | 56 (37%) | 43 (28%) | 0.11 |
| Other vasodilators | 27 (6.1%) | 4 (2.3%) | 0.057 | 7 (4.6%) | 4 (2.6%) | 0.37 |
| Digitalis | 13 (2.9%) | 3 (1.8%) | 0.41 | 5 (3.3%) | 3 (2.0%) | 0.48 |
| Clopidogrel | 49 (11%) | 14 (8%) | 0.29 | 13 (8.5%) | 13 (8.5%) | 0.99 |
| Antiarrythmics | 12 (2.7%) | 5 (2.9%) | 0.88 | 8 (5.2%) | 5 (3.3%) | 0.41 |
Baseline characteristics had no or <3% observations missing until unless indicated. The percentages are calculated based on available data and may not add to 100%.
MI: myocardial infarction; CVA: cerebrovascular accident; CHF: congestive heart failure; NYHA: New York Heart Association; BP: blood pressure; GFR: glomerular filtration rate; ACE: angiotenson converting enzyme; SOB: shortness of breath; QoL: quality of life.
a45 patients missing LVEF information (43 patients in the off-pump group and 2 patients in the on-pump group).
164 patients missing Dyspnoea or SOB information (93 patients in the on-pump group and 71 patients in the off-pump group).
bP-value calculated using the Kruskal–Wallis test for continuous variables and using χ2/Fisher's exact for categorical variables.
cP-value calculated using Signed rank test for continuous variables and McNemar test/test of symmetry for categorical variables.
*P-value < 0.05.
Outcomes for all patients undergoing coronary artery bypass graft
Rates of within-hospital complications (Table 2) were significantly lower among patients undergoing off-pump (9.9%) when compared with those undergoing on-pump procedures (20.3%, P = 0.003). In contrast, the 30-day composite outcome of death/MI/stroke rate was significantly higher among the off-pump patients (7.0 vs 2.9%, P = 0.02). Over the long-term follow-up after CABG, 18 (10.5%) off-pump vs 33 (7.4%) on-pump patients required repeat revascularization (P = 0.21).
Complications and short-term clinical outcomes for patients undergoing CABG surgery
| On-pump (N = 444) | Off-pump (N = 171) | P-value* | |
|---|---|---|---|
| Complications (within hospitalization) | |||
| Peri-/post-procedure complications | 90 (20.3) | 17 (9.9) | 0.003 |
| Neurological | 14 (3.2) | 2 (1.2) | 0.26 |
| Cardiac | 25 (5.6) | 2 (1.2) | 0.016 |
| Renal | 2 (0.45) | 2 (1.17) | 0.31 |
| Vascular | 0 | 0 | – |
| Pulmonary | 19 (4.3) | 7 (4.1) | 0.92 |
| Bleeding | 19 (4.3) | 3 (1.8) | 0.13 |
| Inotropes >48 h, n (%) | 50 (11.4) | 9 (5.3) | 0.023 |
| Short-term Clinical Outcomes (within 30 days) | |||
| Death/MI/stroke | 13 (2.9) | 12 (7.0) | 0.021 |
| Death | 3 (0.68) | 4 (2.3) | 0.10 |
| MI | 9 (2.03) | 6 (3.5) | 0.29 |
| Stroke | 1 (0.23) | 3 (1.8) | 0.07 |
*P-values based on χ2/Fisher's test.
Unadjusted event-free rates at 4 years (Fig. 2) did not differ significantly for mortality (88.0% off-pump vs 91.2% on-pump, P = 0.11) or death/MI/stroke (80.0% off-pump vs 85.4% on-pump, P = 0.06). Adjusted long-term risk of death among off-pump patients was 1.41 times higher than that among the on-pump patients, but this difference was not statistically significant (P = 0.22). Similar effects were observed in the outcome of death, MI or stroke (Table 3). There were no significant interactions between the procedure type and geographical region, indicating that the effect of performing off-pump CABG on death and death/MI/stroke was consistent across the regions.
Effects of performing off-pump procedure on clinical outcomes
| Outcomes for all patients (N = 615) | Unadjusted (off-pump vs on-pump) | Adjusted (off-pump vs on-pump) | ||||
|---|---|---|---|---|---|---|
| HR | 95% CI | P-values | HRa | 95% CI | P-values | |
| Death (events = 69) | 1.49 | 0.91–2.4 | 0.114 | 1.41 | 0.81–2.45 | 0.22 |
| Death/MI/stroke (events = 103) | 1.47 | 0.98–2.21 | 0.06 | 1.47 | 0.92–2.33 | 0.11 |
| Outcomes for propensity score-matched patients (N = 306, 153 pairs) | Unadjusted | Adjusted | ||||
| HR | 95% CI | P-values | HRb | 95% CI | P-values | |
| Death (events = 36) | 1.82 | 0.92–3.16 | 0.09 | 1.55 | 0.71–3.37 | 0.27 |
| Death/MI/stroke (events = 54) | 1.88 | 1.09–3.25 | 0.023 | 1.83 | 1.01–3.32 | 0.046 |
aModel for outcome of death adjusted for region, age, need of diuretics presurgery; Model for outcome of death/MI/stroke adjusted for region, age, sex, blood pressure greater than 130/80, need of aspirin, diuretics presurgery and energy scores.
bAdjusted for region (region: USA/Canada versus others). Cl: confidence limits.
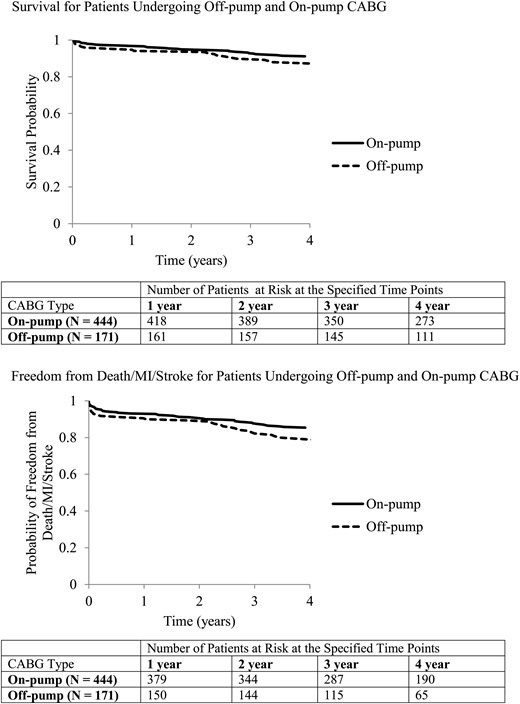
Survival and freedom from death/MI/stroke for patients undergoing off-pump and on-pump CABG.
At the follow-up, patients undergoing off-pump CABG had less angina and higher DASI scores (Fig. 3A, Fig. 4A) but these differences were not significant after adjusting for the baseline characteristics (Table 4). The treatment effect on angina did not vary with time; however, there was a significant interaction between treatment type and time for DASI score (P = 0.002). The DASI scores tended to be higher among patients undergoing on-pump CABG 1 and 2 years after surgery but higher among patients undergoing off-pump CABG 4 years after surgery.
Effects of performing off-pump procedure on functional outcomes
| Effectsa | All patients | Matched sample | ||||||
|---|---|---|---|---|---|---|---|---|
| Angina | N = 564 | N = 283 | ||||||
| Unadjusted | OR | 95% CI | P-values | Type III SS, P-values | OR | 95% CI | P-values | Type III SS, P-values |
| Off-pump (Yes vs No) | 0.51 | 0.31–0.81 | 0.005 | 0.002 | 0.47 | 0.26–0.83 | 0.01 | 0.01 |
| Time after surgery | 0.30 | 0.87 | ||||||
| Year 2 (Ref.: Year 1) | 1.22 | 0.89–1.69 | 0.21 | 1.12 | 0.69–1.77 | 0.66 | ||
| Year 3 (Ref.: Year 1) | 1.13 | 0.77–1.67 | 0.52 | 1.21 | 0.68–2.15 | 0.52 | ||
| Year 4 (Ref.: Year 1) | 0.86 | 0.55–1.36 | 0.53 | 0.97 | 0.52–1.94 | 0.94 | ||
| Adjusted | ORa | 95% CI | P-values | Type III SS, P-values | ORb | 95% CI | P-values | Type III SS, P-values |
| Off-pump (Yes vs No) | 0.74 | 0.44–1.21 | 0.24 | 0.22 | 0.68 | 0.36–1.28 | 0.23 | 0.22 |
| Time after surgery | 0.29 | 0.87 | ||||||
| Year 2 (Ref.: Year 1) | 1.25 | 0.90–1.76 | 0.19 | 1.12 | 0.69–1.80 | 0.65 | ||
| Year 3 (Ref.: Year 1) | 1.17 | 0.78–1.77 | 0.45 | 1.21 | 0.68–2.17 | 0.52 | ||
| Year 4 (Ref.: Year 1) | 0.87 | 0.54–1.40 | 0.56 | 0.98 | 0.52–1.82 | 0.94 | ||
| DASI | N = 553 | N = 277 | ||||||
| Unadjusted | βc | 95% CI | P-values | Type III SS P-values | β | 95% CI | P-values | Type III SS P-values |
| Off-pump (Yes vs No) | 2.52 | 0.61–4.43 | 0.01 | 0.01 | 0.34 | −2.48–3.17 | 0.81 | 0.81 |
| Time after surgery | 0.36 | 0.44 | ||||||
| Year 2 (Ref.: Year 1) | 0.20 | −0.80–1.21 | 0.69 | 0.28 | −1.01–1.56 | 0.67 | ||
| Year 3 (Ref.: Year 1) | −0.57 | −1.56–0.43 | 0.26 | −0.13 | −1.53–1.28 | 0.86 | ||
| Year 4 (Ref.: Year 1) | 0.15 | −0.98–1.27 | 0.80 | 1.05 | −0.54–2.65 | 0.20 | ||
| Adjusted | βd | 95% CI | P-values | Type III SS P-values | βb | 95% CI | P-values | Type III SS P-values |
| Off-pump | – | – | – | – | −1.79 | −4.92–1.34 | 0.26 | 0.27 |
| Time after surgery | 0.044 | 0.44 | ||||||
| Year 2 (Ref.: Year 1) | 0.25 | −0.98–1.48 | 0.69 | 0.28 | −1.01–1.56 | 0.68 | ||
| Year 3 (Ref.: Year 1) | −1.22 | −2.43 –−0.01 | 0.048 | −0.15 | −1.55–1.26 | 0.84 | ||
| Year 4 (Ref.: Year 1) | −1.12 | −2.45–0.21 | 0.10 | 1.03 | −0.56–2.62 | 0.21 | ||
| Interaction between procedure type and time | 0.005 | – | – | – | – | |||
| Off-pump (Yes vs No) at Year 1 | −1.93 | −4.42–0.56 | 0.13 | |||||
| Off-pump at Year 2 | −2.17 | −4.68–0.35 | 0.09 | |||||
| Off-pump at Year 3 | −0.08 | −2.35–2.19 | 0.95 | |||||
| Off-pump at Year 4 | 2.04 | −0.76–4.84 | 0.15 | |||||
aModel adjusted for baseline characteristics that differed between off-pump and on-pump patients including region, randomization assignment, whether the surgery was performed as an index procedure, sex, age, obesity, left ventricular ejection fraction, hypertension (yes/no), glomerular filtration rate, prior PVD, HbA1c level, aspirin medication prior to surgery, diuretics medication prior to surgery, energy scores in addition to time after surgery.
bModel adjusted for region where the procedure was performed and time after surgery.
cBaseline DASI scores included in the model.
dModel adjusted for baseline DASI scores and characteristics that differed between off-pump and on-pump patients including region, randomization assignment, whether the surgery was performed as an index procedure, sex, age, obesity, left ventricular ejection fraction, hypertension (yes/no), glomerular filtration rate, prior PVD, HbA1c level, aspirin medication prior to surgery, diuretics medication prior to surgery, energy scores time and interaction between time and off-pump.
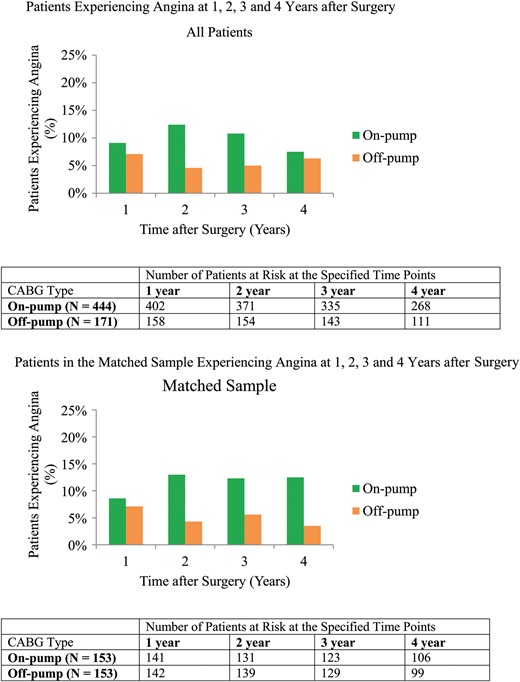
Angina among patients undergoing off-pump and on-pump CABG.
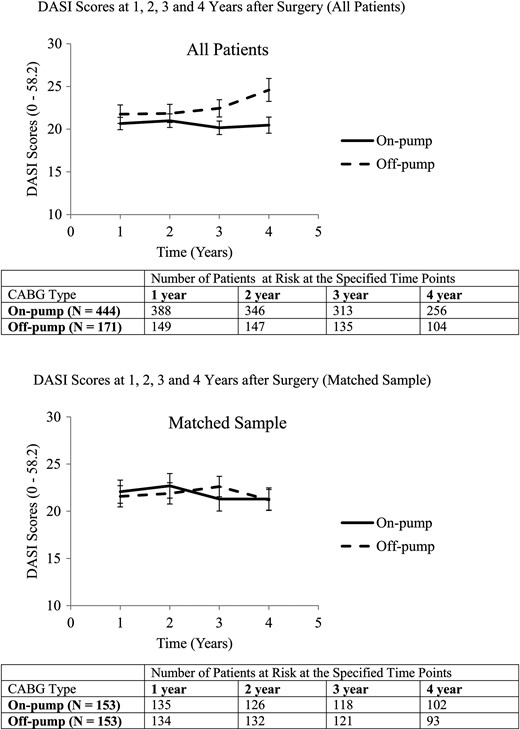
Average DASI scores for patients undergoing off-pump and on-pump CABG.
Propensity score analysis
The propensity score logistic regression model predicting use of off-pump CABG was well calibrated (Hosmer–Lemeshow P-value = 0.14; c-index = 0.734). The propensity scores (ranging from 0.024 to 0.910) were based on timing of the CABG (index versus subsequent), randomization arm (revascularization versus medical therapy), sex, obesity status [body mass index (BMI) >30], myocardial jeopardy score, LVEF, glomerular filtration rate and occurrence of non-coronary vascular surgery, and occurrence of chronic obstructive pulmonary disease prior to CABG (Supplementary material, Table S1). There was modest overlap in the distribution of propensity score by the type of procedure. Matching resulted in 153 off-pump patients matched with 153 patients in the on-pump group. The two study groups were comparable with respect to baseline clinical characteristics (Table 1), ensuring a well-balanced matched dataset with the exception of regional differences that were handled through model adjustment.
Outcomes for propensity score-matched subset
In the matched sample, the within-hospital complications did not differ significantly between the off-pump (10.5%) and on-pump (15.7%) patients, P = 0.18. The 30-day clinical outcomes did not differ significantly for death (1.3% on-pump vs 2.6% off-pump, P = 0.41) or death/MI/stroke (3.9 vs 7.8% patients, P = 0.16). A significantly higher proportion of patients undergoing off-pump CABG (11%) than those undergoing on-pump CABG (2.6%) required repeat revascularization in the long-term (P = 0.005).
The long-term risks of death were not statistically different (Table 3), but the risk of death/MI/stroke was significantly higher (adjusted HR: 1.83, P = 0.046) among the off-pump patients. The off-pump and region interaction terms were not significant for any of the clinical outcomes.
As shown in Fig. 3B, the proportion of patients suffering from angina within the matched sample was lower in the off-pump than the on-pump group. However, the difference was not significant after adjusting for region and time after surgery (Table 4). The DASI scores in the matched sample were similar in the two groups (Fig. 4B, adjusted β: −1.79, 95% CI: −4.92 to 1.34). There were no significant interactions between treatment type and time or treatment type and region for the functional outcomes in this patient set.
DISCUSSION
The use of off-pump CABG continues to be controversial with distinct advantages and disadvantages compared with on-pump CABG. In this study, we found that the rates of death and major cardiovascular events (death, MI or stroke) were 40–80% higher after off-pump CABG, but these trends were only marginally significant because of the relatively small sample size. These patterns suggest that these trends could increase longer term. Our findings suggest that off-pump CABG should be used in patients with diabetes with caution.
One limitation of this study is that there was no randomization between the two surgical techniques. We therefore used two statistical methods to compare the off-pump and on-pump groups, enabling us to make robust inferences. Multivariable Cox regression models were used to estimate hazard risks in the whole population, whereas the matching restricted the comparison with patients that are analogous between the two groups. The estimates obtained from multivariable regression models may not effectively account for treatment selection bias but are representative of the real world scenario wherein the physicians were allowed to choose between off-pump and on-pump CABG as a means of offering their best approach to surgical revascularization. On the other hand, the estimates obtained based on matched subset of patients ensure that clinical covariates are uniformly distributed between the two groups, thus estimating the effect of off-pump CABG among those who actually receive off-pump procedures. However, unmeasured confounders that can lead to residual selection biases may exist. We did not have sufficient information regarding the off-pump to on-pump conversions that may affect our estimates. Also, details on the off-pump procedure technique (aortic manipulation, side-clamp use) were not available. Finally, since many of the revascularizations considered in this analysis were subsequent procedures, there was missing information regarding the completeness of revascularization for a large proportion of the procedures. The reasons for higher rates of adverse clinical outcomes during the course of the follow-up may have been easier to decipher if this information was available.
In our analysis, we observed significant differences in the peri-/post-procedural complications and short-term clinical outcomes between off-pump and on-pump patients when analysing all patients but these were attenuated in the matched subset. The off-pump patient's marginally higher estimated risks of death that failed to reach statistical significance in both the analyses. However, the risk of death/MI/stroke, which was not significantly higher among off-pump patients when considering all patients, was significantly higher in the matched subset of patients. Also, a significantly larger proportion of off-pump patients in the matched subset required repeat revascularization. These differences in results may reflect the treatment selection biases. In the BARI 2D population, patients undergoing off-pump CABG were younger, a lower proportion of them were obese, had higher glomerular filtration rate, lower serum creatinine levels, higher LVEF, higher HbA1c, higher energy scores and were more often from countries outside of the USA and Canada.
A limited number of studies have compared off-pump with on-pump CABG among patients with diabetes [10–13]. Some have shown that although off-pump CABG had fewer complications, there were no survival advantages of off-pump CABG over on-pump CABG among diabetic patients [10, 11]. Other studies indicate that patients undergoing off-pump CABGs have lower complication rates as well as lower mortality [12, 13]; however, these are single centre studies that did not consider long-term outcomes. The literature indicates that off-pump procedures may be associated with inferior graft patency studies and incomplete revascularization that may adversely affect in the long-term [15–18]. To the best of our knowledge, there have been no multicentre observational studies or randomized trials comparing outcomes occurring more than 1 year after surgery. There has been a recent study, though single institution but with over 5000 patients with a median follow-up of 6 years, which shows a long-term survival advantage with on-pump surgery [19]. This is consistent with our study, which includes data from multiple clinical sites, with patients having an average follow-up for more than 4 years.
There were no significant differences in angina and DASI reports after adjusting for patient characteristics at the time of surgery. Although angina rates were higher in the on-pump patients in the matched dataset, after accounting for region and repeated measures these differences were attenuated and non-significant. This indicates that the association between surgery type and angina may have been confounded by the region where the procedure was performed.
In summary, our results demonstrate that in the BARI 2D trial, diabetic patients undergoing off-pump CABG had significantly higher risks of death/MI/stroke over the long-term when compared with those undergoing on-pump CABG. This occurred despite having lower or comparable within-hospital complication rates.
SUPPLEMENTARY MATERIAL
Supplementary material is available at EJCTS online.
Funding
The Bypass Angioplasty Revascularization Investigation 2 Diabetes (BARI 2D) is funded by the National Heart, Lung and Blood Institute and the National Institute of Diabetes and Digestive and Kidney Diseases (U01 HL061744, U01 HL061746, U01 HL061748, U01 HL063804, R21HL121495). BARI 2D receives significant supplemental funding provided by GlaxoSmithKline, Collegeville, PA; Lantheus Medical Imaging, Inc. (formerly Bristol-Myers Squibb Medical Imaging, Inc.), North Billerica, MA; Astellas Pharma US, Inc., Deerfield, IL; Merck & Co., Inc., Whitehouse Station, NJ; Abbott Laboratories, Inc., Abbott Park, IL and Pfizer, Inc., New York, NY. Generous support is given by Abbott Laboratories Ltd., MediSense Products, Mississauga, Canada; Bayer Diagnostics, Tarrytown, NY; Becton, Dickinson and Company, Franklin Lakes, NJ; J. R. Carlson Labs, Arlington Hts., IL; Centocor, Inc., Malvern, PA; Eli Lilly and Company, Indianapolis, IN; LipoScience, Inc., Raleigh, NC; Merck Sante, Lyon, France; Novartis Pharmaceuticals Corporation, East Hanover, NJ and Novo Nordisk, Inc., Princeton, NJ.
Conflict of interest: Robert L. Frye was the Study Chair, Maria Mori Brooks was the Co-Principal Investigator of the Coordinating Center, Mark A. Hlatky was the Principal Investigator of the Economics Core Laboratory and Edward Y. Sako was the Chair of the Surgery Working Group of the BARI 2D study.
REFERENCES
Author notes
A full listing of the BARI 2D Study Group can be found in the Supplementary Appendix, at NEJM.org [5].
