


Abstract
The purpose of this study was to determine whether the number of operated valves affects early and late outcomes in redo valvular surgery.
We analysed 328 consecutive patients who underwent a total of 431 redo valvular surgeries from January 1990 to December 2010. The mean age was 61.5 ± 13.0 years. The main indication for redo surgery was structural valve deterioration (66.1%). We divided these patients into the redo single valvular surgery group (Group S, n = 175; 231 redo surgeries) and the redo multivalvular surgery group (Group M, n = 153; 201 redo surgeries). The mean follow-up period was 6.4 ± 5.8 years. The follow-up rate for late survival was 98.3%.
The hospital mortality rate was 6.5% in Group S and 7.0% in Group M (P = 0.85). Logistic regression analysis revealed that advanced age and New York Heart Association (NYHA) functional class III or IV were statistically significant independent risk factors for hospital mortality. Re-exploration for bleeding was more likely to occur in Group M than in Group S. The 5- and 10-year survival rates were 84.8 ± 3.0 and 70.8 ± 4.6% in Group S and 82.0 ± 3.5 and 70.2 ± 4.9% in Group M, respectively, with no statistical difference. Cox regression analysis revealed that advanced age, a left ventricular ejection fraction rate of <60% and redo surgery beyond the first redo were independent negative predictors of late mortality. NYHA functional class I or II was a statistically significant positive predictor of late survival.
The number of valves requiring redo surgery does not negatively impact early or late survival. Mortality is not different whether one or multiple valves need to be tackled in a redo scenario.
INTRODUCTION
As the aged population grows, redo valvular surgery will be performed more frequently for various conditions such as structural valve deterioration. The mortality rate of redo valvular surgery is high (6.7% in our previous paper) [1]. In elderly patients ≥75 years of age, it may exceed 10% [2, 3].
Conversely, Holst et al. recently reported the outcomes of reoperative multivalve surgery in adult patients with congenital heart disease. They concluded that the number of valves undergoing surgery did not affect early or late survival [4].
Additionally, Luciani et al. showed that multiple valve procedures in an initial surgery are not associated with hospital mortality in adults [5]. However, they did not investigate the relationship between multiple valve procedures and late outcomes following redo surgery.
Therefore, we reviewed 20 years of our experience with redo valvular surgery and investigated the impact of multivalve surgery on both early and late outcomes.
MATERIALS AND METHODS
This retrospective study was approved by the institutional review board of our hospital.
We analysed 328 consecutive patients who underwent 431 redo valvular surgeries at our hospital from January 1990 to December 2010 by reviewing their medical records in accordance with the Society of Thoracic Surgeons guidelines. All patients had previously undergone one or more valvular surgeries including congenital valvular surgeries at our or another hospital. In other words, the patients who did not undergo previous valvular procedures at all were excluded in this study. Redo surgery beyond the first redo means having redo surgery a second time or more number of times. At redo valve replacement, the choice of the prostheses was at the discretion of the surgeon. Patients undergoing concomitant coronary artery bypass grafting, aortic surgery and arrhythmia surgery were included in this study. Data were collected from the patients' medical records. Data analysis was performed according to the Society of Thoracic Surgeons guidelines [6].
We divided these patients into two groups as follows: the redo single valvular surgery group (Group S, n = 175; total surgical procedures, 230 surgeries) and the redo multivalvular surgery group (Group M, n = 153; total surgical procedures, 201 surgeries). The definition of redo single- or multivalvular surgery is in reference to the current redo valvular surgery. We analysed the impact of multivalvular surgery in the setting of redo surgery on both early and late outcomes compared with single valvular surgery. The outcomes included all-cause hospital mortality and late survival.
Statistical analysis
All statistical analyses were conducted with StatView version 5.0 software (SAS Institute, Cary, NC, USA). Categorical variables were expressed as the number of patients (%) and compared between two groups using the χ2 test. Continuous variables were expressed as the mean ± SD and compared between the two groups using Student's unpaired t-test. Also, continuous variables with a non-normal distribution were expressed as the median (interquartile range). The Kaplan–Meier method was used to calculate long-term survival.
Univariate analysis was performed by Fisher's exact probability test or Student's t-tests to analyse risk factors associated with hospital mortality.
Variables that were not statistically significant in the univariate analysis but that had a P value of <0.2 were included in the multivariable logistic regression analysis to determine the independent predictors of hospital mortality. Risk factors for long-term survival were evaluated with Cox multivariate regression analysis after potential predictive variables were selected on the basis of univariate analysis performed by Fisher's exact probability test or Student's t-tests. Odds ratios and hazard ratios of continuous variables are expressed as per-unit values, and 95% confidence intervals were used. All P values of ≤0.05 were considered statistically significant.
RESULTS
The mean patients' age was 61.5 ± 13.0 years. The preoperative characteristics in the two groups are summarized in Table 1. The mean age in Group S was 60.5 ± 14.5 years, and that in Group M was 62.5 ± 11.1 years (P = 0.12). Preoperative atrial fibrillation was more frequently recognized in Group M than in Group S (P < 0.001). The numbers of patients with New York Heart Association (NYHA) functional class III or IV were similar between the two groups (P = 0.46).
Clinical characteristics of patients
| Variables | Mean ± SD or n (%) | P-value | |
|---|---|---|---|
| Group S (n = 175) | Group M (n = 153) | ||
| Age | 60.5 ± 14.5 | 62.5 ± 11.1 | 0.12 |
| BSA (m2) | 1.53 ± 0.18 | 1.53 ± 0.81 | 0.50 |
| Female sex | 99 (57) | 107 (70) | 0.67 |
| Hypertension | 54 (31) | 27 (18) | 0.006 |
| Hyperlipidaemia | 19 (11) | 11 (7) | 0.17 |
| Diabetes mellitus | 26 (15) | 22 (14) | 0.36 |
| COPD | 6 (3) | 7 (5) | 0.53 |
| PAD | 9 (5) | 4 (3) | 0.32 |
| Stroke | 40 (23) | 24 (16) | 0.10 |
| CAD | 8 (5) | 4 (3) | 0.36 |
| Creatinine ≥1.5 mg/dl | 79 (45) | 59 (39) | 0.23 |
| Haemodialysis | 2 (1) | 3 (2) | 0.53 |
| Liver cirrhosis | 10 (6) | 11 (7) | 0.53 |
| Atrial fibrillation | 82 (47) | 122 (80) | <0.001 |
| NYHA FC III/IV | 58 (33) | 57 (37) | 0.46 |
| PH ≥60 mmHg | 15 (9) | 29 (20) | 0.006 |
| Not elective surgery | 25 (14) | 13 (8) | 0.10 |
| Redo > first time | 42 (24) | 41 (27) | 0.56 |
BSA: body surface area; CAD: coronary artery disease; COPD: chronic obstructive pulmonary disease; NYHA FC: New York Heart Association functional class; PAD: peripheral artery disease.
The patients underwent follow-up at the outpatient clinic every 2, 3, 6 or 12 months. Therefore, the decision making regarding the performance of redo surgery was made by ourselves. We also performed telephone interviews with the patients who could not visit the hospital. The mean follow-up period was 6.4 ± 5.8 years and the follow-up rate for late survival was 98.3% when the present data were collected.
Previous or most recent surgery and causes of redo surgery
The frequency of isolated aortic valve surgery in Group S was greater than in Group M (P < 0.001). Mitral (plus tricuspid) valve surgery was more likely to be performed in Group M than in Group S. Concomitant surgeries such as coronary artery bypass grafting were described. These details are shown in Table 2.
Previous or most recent surgery and causes of redo surgery
| Variables | n (%) | P-value | |
|---|---|---|---|
| Group S (n = 175) | Group M (n = 153) | ||
| Previous surgery | |||
| Isolated aortic | 54 (31) | 10 (7) | <0.001 |
| Isolated mitral | 79 (45) | 89 (58) | 0.02 |
| Isolated tricuspid | 6 (3) | 0 (0) | 0.021 |
| Aortic + mitral | 9 (5) | 14 (9) | 0.16 |
| Mitral + tricuspid | 17 (10) | 27 (18) | 0.036 |
| Aortic + mitral + tricuspid | 6 (3) | 11 (7) | 0.13 |
| Others | 4 (2) | 2 (1) | 0.51 |
| Aortic valve surgery | 69 (100) | 35 (100) | |
| Repair | 4 (6) | 1 (3) | 0.51 |
| Replacement | 65 (94) | 34 (97) | 0.51 |
| Bioprosthetic | 27 (42) | 12 (35) | 0.55 |
| Mechanical | 38 (58) | 22 (65) | 0.55 |
| Mitral valve surgery | 111 (100) | 141 (100) | |
| Repair | 31 (28) | 46 (33) | 0.42 |
| Replacement | 80 (72) | 95 (67) | 0.42 |
| Bioprosthetic | 61 (76) | 62 (65) | 0.11 |
| Mechanical | 19 (24) | 33 (35) | 0.11 |
| Tricuspid valve surgery | 29 (100) | 38 (100) | |
| Repair | 24 (83) | 33 (87) | 0.62 |
| Replacement | 5 (17) | 5 (13) | 0.62 |
| Bioprosthetic | 3 (60) | 5 (100) | 0.11 |
| Mechanical | 2 (40) | 0 (0) | 0.11 |
| Concomitant surgery | |||
| CABG | 8 (5) | 3 (2) | 0.36 |
| Maze procedure | 5 (3) | 3 (2) | 0.44 |
| Causes of redo surgery | |||
| Structural valve deterioration | 99 (57) | 118 (77) | <0.001 |
| Perivalvular leakage | 12 (7) | 17 (11) | 0.18 |
| Prosthetic valve endocarditis | 23 (13) | 13 (8) | 0.18 |
| Others | 41 (23) | 5 (4) | <0.001 |
CABG: coronary artery bypass graft.
The main cause of redo surgery in both groups was structural valve deterioration. It was more frequently recognized in Group M than in Group S (P < 0.001). Other possible causes included new lesions of diseased valves, pannus formation and stuck valves.
Present redo surgery
Indications for redo surgery, surgical techniques and prosthetic valve selection were based on the preference of each cardiac surgeon. The operative interval was 10.1 ± 7.3 years in Group S and 15.0 ± 10.1 years in Group M (P < 0.001).
All patients underwent redo surgery via repeated full sternotomy. When the right ventricle was located close to the sternum on computed tomography or elevated right ventricular pressure was encountered during repeat sternotomy, as we previously reported, we applied extracorporeal circulation via peripheral cannulations to avoid injury [1]. Myocardial protection comprised antegrade or retrograde cold blood cardioplegia or both, which were performed based on the type of redo valvular surgery.
The data on the operative interventions are summarized in Table 3. Mitral valve surgery was performed in 102 patients (58%) in Group S. Of these patients, mitral valve replacement (MVR) with a mechanical valve was performed in 49 and with a bioprosthetic valve in 42. The remaining 11 patients underwent mitral valve repair or direct repair for perivalvular leakage. In the aortic position in Group S, mechanical valve replacement was performed in 17 patients and a bioprosthetic valve was implanted in 40. The remaining 2 patients underwent aortic valve repair. In the tricuspid position, annuloplasty was performed in 7 patients and valve replacement with a bioprosthesis in 7.
Present redo valvular surgery
| Variables | Mean ± SD or n (%) | P-value | |
|---|---|---|---|
| Group S (n = 175) | Group M (n = 153) | ||
| Operative interval (years) | 10.1 ± 7.3 | 15.0 ± 10.1 | <0.001 |
| Aortic | 59 (34) | – | |
| AVR | 56 | ||
| AVP | 3 | ||
| Mitral | 102 (58) | – | |
| MVR | 91 | ||
| MVP | 11 | ||
| Tricuspid | 14 (8) | – | |
| TVR | 7 | ||
| TVP | 7 | ||
| Aortic + mitral | – | 20 (13) | |
| AVR + MVR | 18 | ||
| AVP + MVR | 1 | ||
| AVR + MVP | 1 | ||
| Aortic + tricuspid | – | 9 (6) | |
| AVR + TAP | 9 | ||
| Aortic + pulmonary | – | 1 (1) | |
| AVR + PVR | 1 | ||
| Mitral + tricuspid | – | 106 (69) | |
| MVR + TAP | 95 | ||
| MVP + TAP | 7 | ||
| MVR + TVR | 4 | ||
| Aortic + mitral + tricuspid | – | 17 (11) | |
| AVR + MVR + TAP | 13 | ||
| AVR + MVR + TVR | 2 | ||
| AVR + MVP + TAP | 1 | ||
| AVP + MVP + TAP | 1 | ||
| Concomitant surgery | |||
| CABG | 9 (5) | 4 (3) | 0.36 |
| Aortic replacement | 11 (6) | 2 (1) | 0.25 |
| Maze procedure | 4 (2) | 8 (5) | 0.61 |
| CPB duration | 203.1 ± 100.0 | 229.5 ± 99.8 | <0.001 |
| Aortic clamp duration | 123.0 ± 67.2 | 147.5 ± 67.2 | <0.001 |
AVP: aortic valve repair; AVR: aortic valve replacement; CPB: cardiopulmonary bypass; MVP: mitral valve repair; MVR: mitral valve replacement; PVR: pulmonary valve replacement; SD: standard deviation; TAP: tricuspid annuloplasty; TVR: tricuspid valve replacement.
More than 90% of the patients in Group M underwent mitral valve surgery plus another valve surgery (aortic valve plus mitral valve plus tricuspid valve). A total of 204 patients had preoperative atrial fibrillation. However, the maze procedure was performed in only 8 patients in Group M and 4 in Group S because of the chronic phase or dilatation of the left atrium. Other concomitant surgeries are also given in Table 3. One patient underwent redo pulmonary valve replacement using a bioprosthesis for structural valve deterioration in the pulmonary position concomitant with aortic valve replacement (AVR) for infective endocarditis in the aortic position. The pathology for the initial pulmonary valve replacement was unknown because the procedure was performed at another hospital.
The cardiopulmonary bypass and aortic cross-clamp durations for Groups S and M were 203.1 ± 100.0 vs 229.5 ± 99.8 min (P < 0.001) and 123.0 ± 67.2 vs 147.5 ± 67.2 min (P < 0.001), respectively.
Early outcomes and risk factors for hospital mortality
The overall hospital mortality rate was 6.7%. The hospital mortality rate was 6.5% (15/230 redo surgeries) in Group S and 7.0% (14/201 surgeries) in Group M. There was no statistically significant difference between the two groups (P = 0.85). The mean time from surgery to hospital death was 57.2 ± 88.3 days. The causes of mortality included multiorgan failure (n = 13), arrhythmia (n = 5), low-output syndrome (n = 5), uncontrollable bleeding (n = 3), hepatic or renal dysfunction (n = 2) and cerebral haemorrhage (n = 1). Multiorgan failure occurred predominantly in patients (10/13) with preoperative advanced NYHA functional class or renal dysfunction (8/13).
Hospital death after an emergency surgery was six (40%) in Group S and two (14%) in M, respectively (P = 0.12). Although we performed emergency surgery for stuck valves in the aortic position in 3 patients in Group S and 1 patient in Group M, we could not save these patients. Group S included 3 patients with a history of previous coronary artery bypass grafting. The numbers of patients with NYHA functional class III or IV, pulmonary hypertension of ≥60 mmHg and endocarditis were similar in both groups. Additionally, we analysed the data based on type of previous and present surgery and divided the patients into subgroups as follows: patients with prior AVR presently undergoing AVR (n = 50, 58 surgical procedures), patients with prior AVR presently undergoing MVR (n = 4, 6 surgical procedures), patients with prior MVR presently undergoing MVR (n = 96, 133 surgical procedures) and patients with prior MVR presently undergoing AVR (n = 10, 10 surgical procedures). These subgroups included tricuspid valve surgery. The mortality rate in each subgroup was as follows: prior AVR → AVR, 10.3% (6/58); prior AVR → MVR, 16.7% (1/6); prior MVR → MVR, 5.3% (7/133); and prior MVR → AVR, 10% (1/10). Hospital death occurred in 3 of 36 patients who underwent a total of 44 redo surgeries for prosthetic valve endocarditis. The mortality rate was 6.8%.
Although there were no significant differences in early outcomes between the two groups, including ventilator support duration and intensive care unit stay (Table 4), there was a clear trend (bleeding was significantly different between two groups) to increased morbidity in the multivalve group. We applied postoperative intra-aortic balloon pumping in 3 patients, but all were discharged.
Early clinical outcomes
| Variables | Mean ± SD or n (%) | P-value | |
|---|---|---|---|
| Group S (n = 175) 230 Redos | Group M (n = 153)| 201 Redos | ||
| Hospital mortality (%) | 15 (6.5) | 14 (7.0) | 0.85 |
| Main morbidity | |||
| Bleeding | 7 (3.0) | 17 (8.5) | 0.015 |
| LOS | 1 (0.4) | 3 (1.5) | 0.25 |
| Arrhythmia | 1 (0.4) | 3 (1.5) | 0.25 |
| Heart failure | 1 (0.4) | 2 (1.0) | 0.49 |
| Mediastinitis | 3 (1.3) | 4 (2.0) | 0.13 |
| Pneumonia | 3 (1.3) | 2 (1.0) | 0.76 |
| Stroke | 3 (1.3) | 1 (0.5) | 0.38 |
| Tracheostomy | 0 | 0 | – |
| PM implant | 9 (3.9) | 10 (5.0) | 0.59 |
| Newly haemodialysis | 0 | 3 (1.5) | 0.063 |
| Ventilator support (h) | 17.0 (IQR 27.0) | 18.5 (IQR 42.5) | 0.14 |
| ICU stay (days) | 2.0 (IQR 4.0) | 3.0 (IQR 6.0) | 0.20 |
ICU: intensive care unit; IQR: interquartile range; LOS: low-output syndrome; PM: pacemaker; SD: standard deviation.
Logistic regression analysis revealed that advanced age [odds ratio, 1.045; P = 0.043; 95% confidence interval (CI) 1.001–1.091] and NYHA functional class III or IV (odds ratio, 3.878; P = 0.005; 95% CI 1.507–9.978) were independent risk factors for hospital mortality (Table 5). The number of valves requiring redo surgery was not a significant risk factor. Pulmonary hypertension of ≥60 mmHg was a risk factor for hospital mortality in univariate analysis (P = 0.019), but not in multivariate analysis.
Risk factors for hospital mortality
| Variables | Odds ratio | 95% CI | P-value |
|---|---|---|---|
| Advanced age | 1.045 | 1.001–1.091 | 0.043 |
| NYHA FC III/IV | 3.878 | 1.507–9.978 | 0.005 |
| Redo > first redo | 1.659 | 0.901–3.055 | 0.10 |
| Number of valves | 1.017 | 0.438–2.361 | 0.97 |
| Emergency | 2.499 | 0.655–5.715 | 0.23 |
| Diabetes mellitus | 1.300 | 0.469–3.598 | 0.61 |
| Stroke | 1.786 | 0.720–4.427 | 0.21 |
| Haemodialysis | 7.748 | 0.938–64.00 | 0.057 |
NYHA FC: New York Heart Association functional class; 95% CI: 95% confidence interval.
Long-term survival
The Kaplan–Meier estimates of cumulative survival between the two groups are shown in Fig. 1. The survival rates at 5 and 10 years in Groups S and M were 84.8 ± 3.0 vs 82.0 ± 3.5 and 70.8 ± 4.6 vs 70.2 ± 4.9%, respectively (log-rank P = 0.56). There were 49 late deaths including 14 non-cardiac deaths. We divided group M into two subgroups (two-valve and three-valve redo surgery subgroups) and analysed long-term survival between these subgroups. There was no statistically significant difference in survival (log-rank P = 0.36) (Fig. 2).
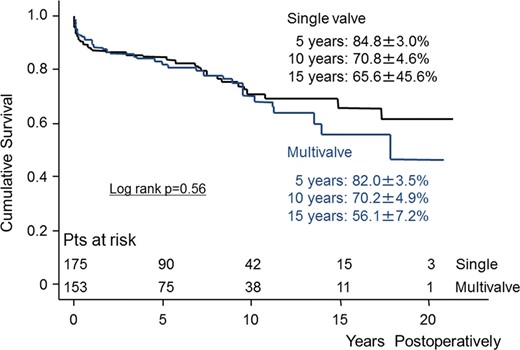
Kaplan–Meier curve showing survival between single- and multivalve redo surgery. Pts: patients.
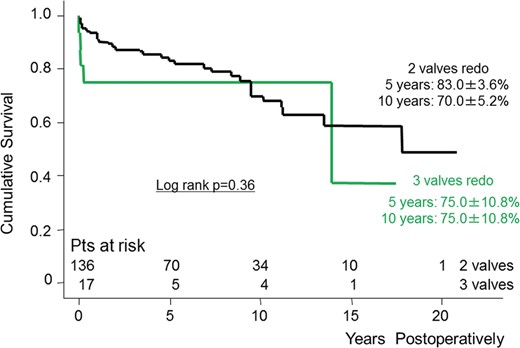
Kaplan–Meier curve showing survival between two- and three-valve redo surgery. Pts: patients.
Cox regression analysis revealed that advanced age (hazard ratio, 1.080; P < 0.001; 95% CI 1.051–1.110), a left ventricular ejection fraction rate of <60% (hazard ratio, 1.755; P = 0.035; 95% CI 1.041–2.960) and redo surgery beyond the first redo (hazard ratio, 1.446; P = 0.043; 95% CI 1.012–2.066) were independent negative predictors of late mortality. NYHA functional class I or II was a positive predictor of late survival (Table 6). In this analysis, neither the number of valves nor the presence of pulmonary hypertension of ≥60 mmHg was identified as a predictor of late mortality.
Predictors of late survival
| Variables | Hazard ratio | 95% CI | P-value |
|---|---|---|---|
| Advanced age | 1.080 | 1.051–1.110 | <0.001 |
| NYHA FC I/II | 0.557 | 0.347–0.894 | 0.015 |
| Absence of COPD | 0.400 | 0.179–0.893 | 0.025 |
| Absence of stroke | 0.472 | 0.284–0.786 | 0.004 |
| LVEF <60% | 1.755 | 1.041–2.960 | 0.035 |
| Redo > first redo | 1.446 | 1.012–2.066 | 0.043 |
| Number of valves | 0.852 | 0.534–1.360 | 0.50 |
COPD: chronic obstructive pulmonary disease; LVEF: left ventricular ejection fraction; NYHA FC: New York Heart Association functional class; 95% CI: 95% confidence interval.
DISCUSSION
We have shown that the number of valves requiring redo surgery does not affect early or late survival. Even in the era of minimally invasive surgery and transcatheter valve implantation, we conclude that the importance of conventional surgery is unchanged.
Holst et al. reported that the number of valves requiring intervention did not affect early and late survival in adult patients with congenital heart disease [4].
Luciani et al. showed that multiple valve procedures were not associated with hospital mortality in adult patients with acquired valvular diseases [5]. However, they did not mention the relationship between multivalve procedure and late outcomes following redo surgery. Here, we have elucidated the early and late outcomes following redo multivalve surgery, as well as the associated risk factors.
Generally, the operative mortality rate in redo valvular surgery is reportedly 7–11% higher than that following initial surgery [1, 7–10]. In this study, the overall hospital mortality rate was 6.7% (29/431).
Multivalve redo surgery might be avoided in the clinical setting because of the high redo operative mortality rates. Intervention for the tricuspid valve has been ignored even in primary surgery because medical treatments such as diuretic drugs can alleviate the symptoms, leading to avoidance of surgery [11]. Moreover, tricuspid regurgitation (TR) was believed to be improved after correction of left-sided valve disease. We can easily imagine that this trend is more likely to occur in redo valvular surgery. However, we previously focused on the importance of TR in the setting of redo valvular surgery. Residual TR that is beyond moderate in severity following redo surgery, which might be ignored in the clinical setting, had a negative impact on late survival [12]. Even in the setting of redo surgery, and particularly in multivalve surgery, TR should undergo surgical treatment to improve late survival.
In this study, we identified advanced age and NYHA functional class III or IV as risk factors for hospital mortality. Some previous reports have reported advanced age, impaired left ventricular function or renal function, coronary artery bypass grafting, advanced NYHA functional class, urgency, endocarditis, mechanical valve replacement and chronic obstructive pulmonary disease as risk factors for hospital mortality [1, 7, 8, 13–15].
Serial follow-up and early referral for redo surgery are very important in patients with advanced age and an advanced NYHA functional class. Surgery that is delayed for various reasons, such as advanced age, will negatively impact early outcomes. In this study, the operative interval was longer in Group M than in Group S, possibly because cardiologists or practitioners managed the patients who required redo surgery using medical treatments to avoid surgery.
The hospital mortality rates in single- and multivalve redo surgery were 6.5 and 7.0%, respectively, with no statistically significant difference. More emergency surgeries were performed in Group S than in Group M (P = 0.1216), and Group S had 3 patients with a history of previous coronary artery bypass grafting. These two factors were reported to be risk factors for early death. We considered that the patients' histories or preoperative conditions contributed to the relatively high hospital mortality rate even in single-valve redo surgery. However, as a result in this study, the number of valves that underwent surgery did not affect early mortality; rather, it was important to assess patients' backgrounds or preoperative conditions to improve early outcomes. With regard to morbidities, more frequency of re-exploration for bleeding occurred in Group M (P = 0.0145). In Group M, 16 patients who suffered from bleeding had preoperative atrial fibrillation and were on an oral anticoagulant, 2 patients had atrial fibrillation and were on anticoagulant therapy. The possible reason of increased frequency of bleeding might be the preoperative presence of anticoagulant associated with atrial fibrillation.
Also, the longer duration of cardiopulmonary bypass and heparin use might affect postoperative bleeding.
In our study, a main cause of redo valvular surgery was structural valve deterioration in the mitral position predominantly. One possible reason for this trend was that MVR with a bioprosthesis was historically performed even in younger patients at our institute; this was because we previously experienced the thromboembolic events frequently after MVR with a mechanical valve.
The long-term survival rates of patients who underwent single- or multivalve redo surgery were satisfactory, and the survival rates between the two groups were not significantly different. Our previous report showed 5- and 10-year overall survival rates of patients who underwent redo valvular surgery of 83.6 ± 2.2 and 70.7 ± 3.4%, respectively [1]. In the present analysis, advanced age, a decreased left ventricular ejection fraction, and more redo surgery beyond the first redo were negative predictors of late survival. NYHA functional class I or II was a positive predictor of survival (P = 0.0153). These results indicate that optimal referral for redo surgery contributed to improved late survival following single- or multivalve surgery.
Based on the present data, our policy is to intervene for all diseased valves with optimal timing and after careful preoperative patient assessment.
The present study was limited by its retrospective and non-randomized nature. The study reflects 20 years of experience of redo heart valvular surgery at a single Japanese hospital with a relatively small sample cohort, which resulted in heterogeneity. Additionally, the indications for redo surgery, surgical techniques and prosthetic valve selection were based on the preference of each cardiac surgeon who performed the surgery.
However, our comparative study provides helpful clinical information regarding risk assessment of early and late outcomes following single- or multivalve redo surgery. In particular, as the population ages, cardiac surgeons and cardiologists will face increasingly more patients who require redo valvular surgeries.
In conclusion, the number of valves requiring redo surgery did not have a negative impact on early or late survival. Surgical intervention for all diseased valves should be considered, even in redo valvular surgery, according to the optimal timing and the patient's risk assessment.
Conflict of interest: none declared.
REFERENCES
