


Abstract
This study is aimed at drawing the profile of the Brazilian general thoracic surgeon. This experience has been fruitful in other areas, helping attract manpower and to better serve the interests of other Societies. This is the first survey of this kind in Brazil and in Latin America.
An electronic invitation was sent to the members of the Brazilian Society of Thoracic Surgery to answer a web-based questionnaire and physicians potentially practising thoracic surgery, with 82 questions including demographic data, medical education, training in general and thoracic surgery, continued professional education, practice profile, research activities and certifications, participation in medical societies, income/compensation and career satisfaction. Quantitative and qualitative analyses are presented.
The estimated level of participation was 82% (468). The mean age of the active general thoracic surgeon is 43.2 (range 45.3 ± 11.4) years. Women comprised 8% (37) of respondents, and 60% (277) of the participants had graduated from public medical schools. Four states nationwide trained 88% (391) of the thoracic surgeons. Only 32% (149) of the surgeons work exclusively with thoracic surgery. The public health system is the main provider of income for thoracic surgeons. Only 11 of 27 states have an adequate, although poorly distributed, number of thoracic surgeons.
Although Brazil has a reasonable number of general thoracic surgeons, inequalities in their distribution through the country arise as one of the most concerning problems of the speciality. The results of this study show that leadership actions and consistent government policies are required to improve work conditions and provide efficient workforce planning.
INTRODUCTION
Awareness of the workload of a medical speciality is essential to analyse the current situation and also to plan future resources. Repeated workforce survey data provide valuable information on longitudinal trends [1]. The Society of Thoracic Surgeons (STS) and the American Association of Thoracic Surgery (AATS) have conducted surveys since 1974 [2–6].
The practice of Brazilian thoracic surgeons is challenging in a country with continental dimensions and an area of more than 8.5 million square kilometre, a population of 190.7 million people and 371 788 active physicians in 2012 [7].
Brazil's healthcare system is composed of a Public Healthcare System (Unified National Healthcare System), which provides coverage to three-fourth of the overall population, and a Private Healthcare System (Supplementary Healthcare System), which covers the wealthier and remainder of the population. The Supplementary system includes a variety of insurance modalities, among which is UNIMED, a physician-owned cooperative, scattered throughout the country.
The stimuli offered by professional societies to the workforce are different in Brazil, USA and Europe. Most USA and European societies such as the STS, AATS, American College of Chest Physicians (ACCP) and the European Association of Cardiothoracic Surgeons (EACTS) represent cardiothoracic and general thoracic surgeons together. The same way that the European Association of Thoracic Surgeons and the European Association of Cardiothoracic Surgeons, in Brazil the societies are separate. Brazilian cardiothoracic surgeons are represented by the Brazilian Society of Cardiovascular Surgery (Sociedade Brasileira de Cirurgia Cardiovascular, SBCCV); a small number of general thoracic surgeons are represented by the Brazilian College of Surgeons (Colégio Brasileiro de Cirurgiões, CBC) and most of them by the Brazilian Society of Thoracic Surgery (Sociedade Brasileira de Cirurgia Torácica, SBCT).
In Brazil, each state has a Regional Medicine Council where physicians must register. However, they do not have to specify their specialty and some physicians are registered in more than one state. To complicate facts even further, the governmental National Medical Residency Committee (Comissão Nacional de Residência Médica, CNRM) accredits medical residents who conclude their residency programme and considers anyone concluding the programme a specialist. Based upon this peculiar concept, a recent publication overestimates that there are 491 ‘specialists' in general thoracic surgery in Brazil [7]. In combination, all of these peculiarities make it difficult to ascertain the accurate number of general thoracic surgeons in Brazil. In fact, to date SBCT has accredited only 335 surgeons as specialists in Thoracic Surgery of whom 294 currently practise the speciality.
The objective of this project was to characterize the typical general thoracic surgeon and, to the best of our knowledge, this is the first survey on general thoracic surgery in Brazil and in Latin America.
METHODS
From January to September 2012, SBCT and the Thoracic Surgery Department, Heart Institute (InCor), Hospital das Clínicas, Medical School, University of São Paulo conducted a survey whose target subjects included the 569 members of SBCT and other sources of information as mentioned above.
A self-administered web-based questionnaire was developed with 82 questions organized according to the skip logic: some answers would extend the question or direct the respondent to another question. Survey questions were initially pretested with a pilot group of 10 surgeons to ascertain clarity and content. This instrument includes Demographic Data, Medical Education, Training in General Surgery and in Thoracic Surgery, Continued Professional Education, Practice Profile, Research Activities and Certifications, Participation in Medical Societies, Income/Compensation and Career Satisfaction. The study was approved by the Ethics Committee for the Analysis of Research Projects (CAPPesq Protocol no. 350/11).
We sent an electronic invitation to SBCT target members and general thoracic surgeons or residents potentially practising the speciality. The e-mail included an introductory description of the research. Participants were informed that participation was voluntary and could be anonymous and that all responses would only be reported in aggregate.
The survey database was downloaded in an Excel™ Microsoft spreadsheet (v. 7). After an analysis of inconsistencies and errors, only valid data were extracted and entered into a comprehensive database, using quality control and verification measures. The survey had only one mandatory question in each section and respondents did not have to answer all questions.
Statistical analysis
Relative distributions are estimated as the number of respondents to each question. No value was attributed; missing data were ignored from the denominator for the specific question. Descriptive data are presented as mean ± standard deviation and range for continuous variables. The qualitative analysis shows absolute and relative frequencies of categories. Since the literature quoted a maximum of 63% response rate, the statistical validity of a sample size up to 300 respondents could have a margin of error up to ±3.85% within the 95% confidence interval (i.e. 95% confident that a survey of 300 thoracic surgeons would reveal results within 3.85% of those shown in this survey) [1].
RESULTS
A total of 523 answers were received. Analyses resulted in a final sample of 468 eligible surveys, where 81% chose to identify themselves voluntarily.
Demographics
Respondents' practice locations included the Federal District and 25 states, and 98% (460) of the surgeons were born in Brazil. The mean age of Brazilian general thoracic surgeons is 43.2 years (range 45.3 ± 11.4) and 8% (37) of the respondents were women. A total of 88% (391) respondents reported to be married and 61% (282) have one or more children. The absolute distribution of surgeons by state of birth, education and practice location is given in Table 1.
Absolute (and relative) distribution of respondents according to birth place, education, surgical training and practice location compared with the expected ratio of thoracic surgeons per state
| Number (%/total) | State of birth | Medical education | Training in general surgery | Training in thoracic surgery | Practice location | Expecteda number of thoracic surgeons | % pop./stateb |
|---|---|---|---|---|---|---|---|
| States | |||||||
| Acre (AC) | 1 (0.2%) | 0 | 0 | 0 | 1 (0.2%) | 1.5–2.9 | 0.4 |
| Alagoas (AL) | 2 (0.5%) | 3 (0.6%) | 0 | 0 | 1 (0.2%) | 6.2–12.5 | 1.6 |
| Amapa (AP) | 0 | 0 | 1 (0.2%) | 0 | 1 (0.2%) | 1.3–2.7 | 0.4 |
| Amazonas (AM) | 1 (0.2%) | 2 (0.4%) | 3 (0.7%) | 1 (0.2%) | 2 (0.4%) | 7.0–13.9 | 1.8 |
| Bahia (BA) | 13 (3.2%) | 15 (2.6%) | 9 (2.0%) | 1 (0.2%) | 11 (2.3%) | 28.0–56.1 | 7.3 |
| Ceara (CE) | 7 (1.7%) | 8 (1.7%) | 6 (1.3%) | 4 (0.9) | 7 (1.5%) | 16.9–33.8 | 4.4 |
| Distrito Federal (DF) | 7 (1.7%) | 3 (0.6%) | 7 (1.6%) | 18 (4%) | 15 (3.2%) | 5.1–10.3 | 1.3 |
| Espirito Santo (ES) | 13 (3.2%) | 16 (3.5%) | 6 (1.3%) | 0 | 11 (2.3%) | 7.0–14.0 | 1.8 |
| Goias (GO) | 7 (1.7%) | 7 (1.5%) | 2 (0.4%) | 1 (0.2%) | 8 (1.7%) | 12.0–24.0 | 3.1 |
| Maranhao (MA) | 3 (0.7%) | 1 (0.2%) | 2 (0.4%) | 0 | 2 (0.4%) | 13.1–26.3 | 3.4 |
| Mato Grosso (MT) | 1 (0.2%) | 1 (0.2%) | 0 | 0 | 3 (0.6%) | 6.1–12.1 | 1.6 |
| Mato Grosso do Sul (MS) | 4 (1.0%) | 4 (0.8%) | 5 (1.1%) | 1 (0.2%) | 6 (1.3%) | 4.9–9.8 | 1.3 |
| Minas Gerais (MG) | 40 (10.0%) | 57 (12.5%) | 44 (9.9%) | 38 (8.6%) | 45 (9.6%) | 39.2–78.4 | 10.3 |
| Para (PA) | 9 (2.2%) | 8 (1.7%) | 5 (1.1%) | 2 (0.4%) | 7 (1.5%) | 15.2–30.3 | 4.0 |
| Paraiba (PB) | 7 (1.7%) | 6 (1.3%) | 1 (0.2%) | 1 (0.2%) | 5 (1.1%) | 7.5–15.0 | 2.0 |
| Parana (PR) | 28 (7.0%) | 22 (4.8%) | 14 (3.1%) | 19 (4.3%) | 27 (5.7%) | 20.9–41.8 | 5.5 |
| Pernambuco (PE) | 5 (1.2%) | 6 (1.3%) | 3 (0.7%) | 2 (0.4%) | 5 (1.0%) | 17.6–35.2 | 4.6 |
| Piaui (PI) | 5 (1.2%) | 8 (1.7%) | 2 (0.4%) | 1 (0.2%) | 8 (1.1%) | 6.2–12.5 | 1.6 |
| Rio de Janeiro (RJ) | 44 (11.0%) | 70 (15.4%) | 76 (17.1%) | 85 (19.1%) | 51 (10.9%) | 32.0–63.9 | 8.4 |
| Rio Grande do Norte (RN) | 7 (1.7%) | 10 (2.2%) | 7 (1.6%) | 1 (0.2%) | 4 (0.9%) | 6.3–12.7 | 1.7 |
| Rio Grande do Sul (RS) | 52 (13.0%) | 72 (15.8%) | 64 (14.3%) | 77 (17.3%) | 51 (10.9%) | 21.4–42.8 | 5.6 |
| Rondonia (RO) | 0 | 0 | 0 | 0 | 2 (0.4%) | 3.1–6.2 | 0.8 |
| Roraima (RR) | 0 | 0 | 0 | 0 | 1 (0.2%) | 0.9–1.8 | 0.2 |
| Santa Catarina (SC) | 17 (4.3%) | 10 (2.2%) | 14 (3.1%) | 0 | 25 (5.3%) | 12.5–25.0 | 3.3 |
| São Paulo (SP) | 122 (30.6%) | 125 (27.5%) | 171 (38.4%) | 191 (43%) | 166 (35.5%) | 82.5–165 | 21.6 |
| Sergipe (SE) | 1 (0.2%) | 0 | 2 (0.4%) | 1 (0.2%) | 0 | 4.1–8.3 | 1.1 |
| Tocantins (TO) | 2 (0.5%) | 1 (0.2%) | 1 (0.2%) | 0 | 2 (0.4%) | 2.8–5.5 | 0.7 |
| Total | 398 (100%) | 455 (100%) | 445 (100%) | 444 (100%) | 468 (100%) | 190 million | |
Medical education
Two hundred and seventy-seven (60%) surgeons graduated from public medical schools and 40% (188) graduated from private medical schools. The mean age at graduation was 24.6 ± 1.7 years.
Training in general surgery
Usually at a median of 3 years after graduation, 98.3% (454) of the surgeons were trained in general surgery in Brazil, 90.1% (414) of whom were trained in a CNRM-accredited programme. The length of training in general surgery was 1, 2 or more years for 9.7% (45), 75.6% (351) or 14.6% (68), respectively, with a mean of 2.1 ± 0.6 years.
Training in thoracic surgery
According to the survey, 98.3% (456) of the surgeons were trained in thoracic surgery. The length of thoracic surgery training was 3, 2 or 1 years, for 66.2% (308), 31.2% (145) or 2.6% (12) of the surgeons, respectively. Residency was obtained in CNRM-accredited services by 79% (359) surgeons.
In addition to the general thoracic surgery training reported by 98% (457), 12% (55) were also trained in cardiac surgery, 32% (148) in oesophageal surgery, 73% (337) in respiratory endoscopy and 13% (60) in other sub-specialties. Overall, respondents had at least 4.3 ± 0.9 years of training in general and thoracic surgery.
Continued professional education
Additional training in other countries was obtained by 16.7% (78) of the surgeons, during 3, 3–12 months or >1 year for 36.8% (28), 31.6% (24) or 31.6% (24), respectively.
Academic senso strictu graduate studies are or were taken by 39% (183) of surgeons. Of those only Master of Sciences is or was obtained by 37% (68); 34% (63) have progressed to the PhD programme. Overall, 25% (115) obtained PhD titles at a mean of 11.5 ± 5.8 and 15.6 ± 6.7 years after graduation, respectively.
Near half (53/115) of those who have a PhD title have reported to hold positions as head of service or department currently.
Practice profile and location
Overall, 26.9% (124) of the respondents work in more than one city and 42% (193) reported a current position as head of a thoracic surgery department or service. The potential catchment population at the city of practice is shown in Fig. 1.
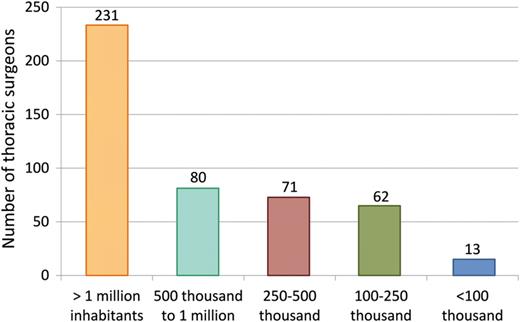
Absolute distribution of thoracic surgeons according to the potential catchment population at the city of practice.
The mean work time that general thoracic surgeons spent exclusively in thoracic surgery or other specialities is shown in Fig. 2.
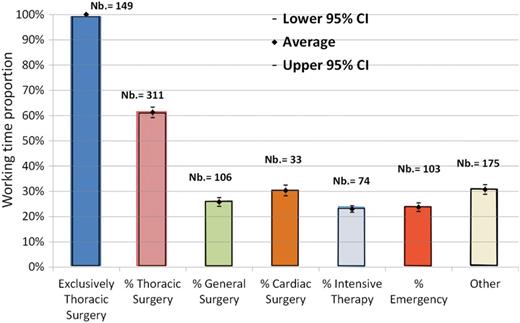
Relative distribution (and numbers) of 32% of respondents who reported to work exclusively with thoracic surgery and the practice distribution of the remaining 67% (n = 311).
Furthermore, 81.3% (375) of the respondents work as part of a team, 18.7% (86) have a solo practice and 85.4% (252) of the teams included exclusively thoracic surgeons. Teams including general surgeons and or cardiac surgeons were reported, respectively, by 14.6% (43) and 4.7% (14) of the respondents.
Of the total, 252 (54%) respondents work in university hospitals, of which 87% (219) are public university hospitals.
Research activities and certifications
36.7% (172) of thoracic surgeons teach in medical schools.
Of the total, 52% (240) of the respondents are accredited in general thoracic surgery by SBCT, 19% (90) are accredited in general surgery by the CBC, 4% (17) in cardiac surgery by the SBCCV, 8% (35) in pulmonology by the Brazilian Society of Pulmonology (Sociedade Brasileira de Pneumologia e Tisiologia, SBPT), 8% (35) in respiratory endoscopy and 15% (69) in other sub-specialties.
Participation in medical societies
Overall, 86% (399) of the respondents are affiliated to SBCT, 56% (261) are affiliated to SBPT, 23% (108) to CBC, 2% (7) to ACCP, 6% (26) to STS, 2% (11) to AATS, 1% (6) to ESTS, 3% (12) to EACTS and 5% (28) are affiliated to the International Association for the Study of Lung Cancer. Only 9% (43) are not affiliated to any association.
Two hundred and seventy-two respondents (58.1%) expected SBCT to further defend the interests of the speciality. The three main problems perceived for the speciality were insufficient financial compensation according to 92% (426) of the respondents, insufficient mobilization of the workforce to define professional strategies reported by 71% (329) and inadequate work conditions as reported by 54% (250).
Income/compensation
The different income sources, whether private, salary or from other insurances, and how these sources comprise, in percentage, the thoracic surgeons’ total income are shown at Fig. 3.
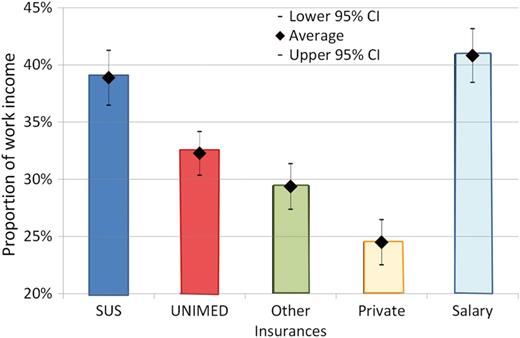
Relative distribution of respondents’ sources of payment/work income.
Career satisfaction
Career satisfaction is correlated to thoracic surgeons’ work conditions and stability and 88% (410) reported to be pleased with the thoracic surgery specialty and doing what they want for a living, 67% (314) would choose this career again, 20% (93) were not sure and 13% (59) may choose differently.
In a cross-validation question concerning their overall career satisfaction, 79% (373) reported to be very or extremely pleased, 8% (37) were indifferent and 12.3% (58) were unhappy or extremely unhappy.
DISCUSSION
Surveys are limited by data collection methods relying on self-report and results based on opinions and self-assessment, all prone to respondent bias or data inaccuracies. Other limitations must be mentioned. Since there are no compulsory official registries of medical specialists, it was impossible to determine the exact response rate. Assuming a total of 569 SBCT members, a survey response rate of 82% could be considered very good. This participation rate is higher than those obtained by the STS/AATS surveys, where, in 2000, 43% responded to the survey, in 2002 63% and in 2005 39% [1, 10].
The Brazilian general thoracic surgeon is of younger age than the mean of the Brazilian physician population (43.2 vs 46.03 ± 13.64 years of age) [7]; this is similar to that of the thoracic surgeon workforce (44.2 years) in Spain [8], and is almost a decade younger than the median of 52.9 years of age of the active population of US thoracic surgeons [10].
In spite of the escalating numbers of women graduating in medicine in Brazil, increasing from 43.8% in 2003 to 52.5% in 2011, this survey shows that thoracic surgery is still mainly a male speciality in Brazil where only 8% of the respondents were female thoracic surgeons.
In Canada and USA as well, the numbers of women graduating in medicine has increased since the mid-1990s reaching over 50% of the medical student population. Even there, despite this increase, women continue to take less than 10% of all surgical residency positions [11]. Moreover, in this study, the ratio of women to men obtained was 0.07, which is inferior to the 0.18 ratio in Spain [8]. Decrease in gender differences may be an important SBCT goal for the near future.
One of the major problems faced by surgeons in the USA is the debt accumulated during their training years [10]; although we did not directly ask this question, it seems to be a lesser problem in Brazil. Almost two thirds of all thoracic surgeons (60%) obtained their degree from public universities, thus avoiding expenses with medical training. Our findings also indicate that 64.9% of the respondents obtained training in their home state, which may or not have had some financial impact.
The length of training of a thoracic surgeon is also a major concern. Internationally, the typical combined training in cardiothoracic surgery lasts 7–9 years after medical school, with a mean of ∼8.5 years [12]. Comparing the length of thoracic surgical training with other countries may be difficult due to the speciality definitions. For instance, in Canada, thoracic surgery emerged as a sub-specialty of general surgery, and cardiac surgery subsequently developed from thoracic surgery [9]. The thoracic and cardiac surgery training programmes in the USA consist of 2 or 3 years of a combined cardiothoracic programme, after training in general surgery, and a common certification is obtained [11]. This lack of standardization has also been reported in a joint study by the European scientific societies, where there was an attempt to define the speciality boundaries [13].
Currently in Brazil, the training in general thoracic surgery is separated from cardiac surgery and usually consists of 2 years after 2 years of training in general surgery. Indeed, 66.2% of respondents confirmed an average of 2.1 years of training in thoracic surgery. This is significantly less than the overall average of 7–9 years of residency after medical school graduation (mean, 8.7) found in the USA [10]. Unfortunately, 21% of the respondents in Brazil are trained in nonaccredited services.
A demonstration of effort to improve their professional status is reflected by 16.7% of the Brazilian surgeons reporting having obtained supplementary education or training in other countries.
Scientific performance is also reflected by graduate studies, mentoring graduate students and scientific publications. Respondents' efforts were reflected by 39% of the Brazilian thoracic surgeons obtaining postgraduate titles, including mentoring of students by one-third of the surgeons. This figure is very similar to the 36% of thoracic surgeons who hold a doctorate degree in Spain [8].
Geographic distribution has been poorly studied in Brazil and there is no specific study on thoracic surgeons. Internationally, the medical literature and one Brazilian study show that specialists tend to practise in the areas where they were trained [14, 15].
Indeed, 71.4% of the respondents practise in the same state where they obtained their medical education and 64.6% of thoracic surgeons carried out their practice in the same state where they obtained their training.
Ten states did not train any thoracic surgeon, with 88% of surgeons training in four main states (SP, RJ, RS and MG), indicating centralization issues to be solved in Brazil. These four states are among the 11 states (DF, ES, MS, MG, PI, PR, RJ, RS, RR, SC, SP) with higher economic development in Brazil. The number of thoracic surgeons practising is these states is above or within the expected range (Table 1). In the other 16 states, we found a shortage of thoracic surgeons, showing that a governmental policy to redistribute thoracic surgeons throughout the country must be developed. Figure 4 shows the number of thoracic surgeons according to the different states.
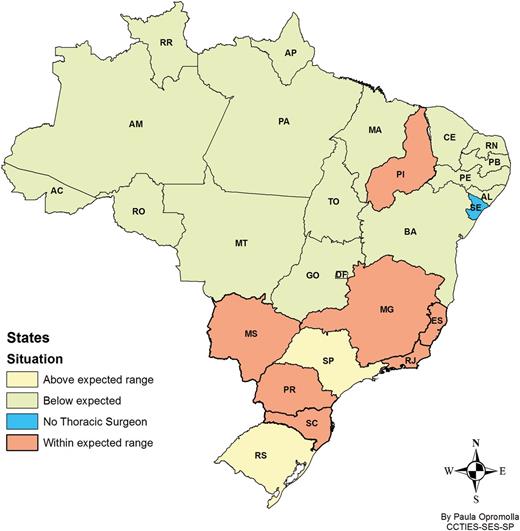
Brazilian states where the number of respondent thoracic surgeons are lacking, below expectations, adequate or above expectations.
Mixed practice patterns are not uncommon. In Canada, for example general surgery accounts for 25–40% of the practice of thoracic surgeons mainly if they work in the community instead of large urban centres [9]. The practice patterns are more diverse in the USA where more than 50% of cardiothoracic surgeons have mixed thoracic and cardiac practices [11].
In Brazil, we found that only one-third of the surgeons work exclusively with general thoracic surgery. From the remaining two-thirds, although they work more than half of their time with thoracic surgery, there is a significant percentage of their work time spent in other specialities as general surgery, cardiac surgery, ICU, emergency rooms and other activities.
18.7% (86) reported to work solo, which is not much different from what was found in the STS/AATS survey with 11% working solo [10].
It has also been apparent in the literature that, on average, each full-time equivalent thoracic surgeon is estimated to be able to provide service for a catchment area of 150 000–500 000 inhabitants [9]. Thus, one thoracic surgery department with five surgeons for every million inhabitants is probably a suitable figure [8]. Based on this concept, the total number of thoracic surgeons in Brazil, although poorly distributed, is acceptable (Fig. 4).
The financial aspect may be used as a motivator for the workforce. Salary-based remuneration has been suggested to encourage hiring and stimulate non-clinical activities such as research and education. Conversely, fees for service compensation have been cited to encourage productivity in periods of surgeon shortages [11]. Questions regarding amounts paid were not included. Instead, the main sources of income/compensation were analysed. Two paradoxes emerged. Although physicians are usually independent professionals, when thoracic surgeons were stimulated to rank all sources of income, salary-based remuneration (41%) obtained the highest percentage and private patients (24%) the lowest. Secondly, although the Brazilian Public Healthcare System is a constant source of complaint due to low reimbursement values, it represents the second highest source of remuneration for thoracic surgeons (39%). Among the insurances, UNIMED, the physicians' cooperative (32%), ranked above the sum of all other private insurances (29%) (Fig. 3).
Historically, career satisfaction in cardiothoracic surgery in the USA has been reported to be very high. Indeed, in spite of challenges facing thoracic surgery, in the 2010 survey more than 72% of surgeons reported to be satisfied or very/extremely satisfied with their careers [10].
This level of satisfaction with their career is very similar to this Brazilian survey, where 79% of the respondents were very or extremely satisfied, 8% indifferent and 12.3% dissatisfied or extremely dissatisfied.
Paradoxically, when asked if ‘they would encourage their relatives or friends to go into thoracic surgery’, only 50% said yes. This same phenomenon was observed in the US survey where 72% reported career satisfaction but only 37% who said yes to a similar question [10].
Although the results of this survey are not complete, the participation rate of 82% of SBCT members was encouraging. The trends identified here may help implement specific actions and define government policies to improve gender differences, work condition standards, access and dissemination of training, and develop efficient workforce planning. And finally, we hope this study will encourage colleagues from other regions to also publish their own experiences and contribute to the global picture, in order to identify gaps and opportunities for improvement.
Funding
This work was supported by Fundação de Amparo a Pesquisa do Estado de São Paulo (FAPESP), São Paulo Research Foundation; Grant no. 2011/51156-5.
Conflict of interest: none declared.
