


Abstract
Recent data show that up to 50% of heart procedures require blood transfusion, which can have adverse long- and short-term outcomes for the patient. This led to the updated 2011 Society of Thoracic Surgery (STS)/Society of Cardiovascular Anesthesiologists (SCA) guidelines in an attempt to adopt more effective blood conservation techniques. We present our results after the implementation of a more aggressive strategy for intraoperative blood conservation in cardiac surgery.
Our cardiac surgery database was reviewed retrospectively, comparing outcomes from two different time periods, after the implementation of a more effective two-way blood conservation strategy beginning in March 2012: more aggressive intraoperative autologous donation (IAD) based on a newly constructed nomogram, and the use of a shorter length circuit of the cardiopulmonary bypass (CPB) which allowed for lower fluid volume as a prime. The method of retrograde autologous priming (RAP) was the same for both time periods.
A total of 1126 patients (Group 1) were studied in a 12-month period (March 2012–February 2013) after the implementation of the new strategy, and compared with 3758 patients (Group 2) of the previous 36-month period (March 2009–February 2012). There was a significant reduction in the percent change of the intraoperative haematocrit between Groups 1 and 2 (14 vs 28%, P = 0.01), with an increase in the mean IAD volume (655 vs 390 ml, P = 0.02) and a reduction in the CPB priming volume (1000 vs 1600 ml, P = 0.03). Group 1 required significantly less blood transfusions in the perioperative period (29 vs 49%, P = 0.02) and had significantly reduced postoperative rates of respiratory failure (3 vs 7%, P = 0.03), pneumonia (1 vs 3.1%, P = 0.01), chest tube output (350 vs 730 ml, P = 0.01), reoperation for bleeding (1.2 vs 2.5%, P = 0.04) and length of stay (6.1 vs 8.2 days, P = 0.05).
Blood conservation is safe and effective in reducing transfusions in cardiac surgery, minimizing perioperative morbidity and mortality. Aggressive IAD and low CPB prime, along with effective RAP, is the three-way blood conservation strategy that leads to improved outcomes in cardiac surgery.
INTRODUCTION
Severe intraoperative and postoperative anaemia after cardiac procedures has been shown to be associated with increased morbidity and mortality [1–4]. Nevertheless, there are data on the adverse effects of allogenic blood transfusion after cardiac surgery, namely on the incidence of infections, lung injury, cardiac complications, and short- and long-term survival [5–7]. Furthermore, tolerance of permissive anaemia, even at haemoglobin levels as low as 6 g/dl, has been shown to be feasible and cost-effective [8, 9]. This has led to the development of various blood conservation strategies by individual hospitals in an attempt to reduce the need for use of blood transfusions during and after heart operations.
Recent data show that up to 50% of heart procedures require blood transfusion, which can have adverse long- and short-term outcomes for the patient [9]. This led to the updated 2011 Society of Thoracic Surgery (STS)/Society of Cardiovascular Anesthesiologists (SCA) guidelines in an attempt to adopt more effective blood conservation techniques [9]. However, a recent study showed that fewer than half of the institutions in the USA have been following these guidelines. Furthermore, only 26% of the hospitals reported practice changes as a consequence of the guidelines, and only 4 of 37 guideline recommendations were reported to have been changed by more than 5% of the respondents [10]. We present our results after the implementation of a more aggressive programme for intraoperative blood conservation in cardiac surgery, in an attempt to show the feasibility and effectiveness of a three-way strategy.
MATERIALS AND METHODS
After obtaining permission from the Institutional Review Board, we retrospectively reviewed the Department of Cardiothoracic Surgery database at the New York Presbyterian—Weill Cornell Medical Center. The cohort included adult patients (age 18 years old and above) who underwent elective heart operations with the use of cardiopulmonary bypass (CPB) in a 48-month period (March 2009–February 2013). Exclusion criteria included emergency procedures, ascending aortic aneurysm rupture and Stanford Type A aortic dissection.
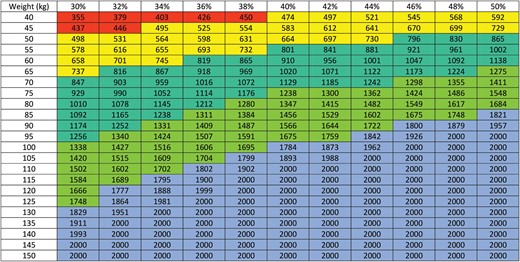
The DeBois nomogram used to calculate the IAD volume (in ml). The x-axis represents haematocrit (in %) and the y-axis represents weight (in kg).
The patient's intravascular volume after the IAD was replaced with an equal amount of crystalloid fluid in order to remain euvolemic. Typically, the IDA volume was stored and transfused after protamine administration. Data collected included the following: patient demographics, preoperative, intra- and postoperative haematocrit, CPB priming volume, packed red-blood cell (PRBC) transfusion requirements, IAD, perioperative (30 days post-operation) morbidity and mortality, chest tube output and length of stay.
The heparin was dosed as 400 units/kg with a target activated clotting time of 480 s before initiating CPB, and redosed accordingly to maintain an activated clotting time of over 480 s. According to our routine, aspirin is continued until the day of surgery, but clopidogrel or prasugrel was discontinued 5 days before the operation, unless a bare metal stent had been inserted within the last 12 months.
Validated transfusion protocols that have been published elsewhere were used [1]. Specifically, intraoperative transfusion triggers included PRBC transfusion for haemoglobin levels <6 g/dl or a haematocrit level <18% while on CPB in addition to one of the following: (i) low oxygen saturation (PO2 <60 mmHg), (ii) elevated lactate level (>2.2 mmol/l), (iii) elevated base deficit (>3 mEq/l) and (iv) low serum bicarbonate level (<22 mEq/l). Similar postoperative transfusion triggers also were established to include PRBC transfusion for haemoglobin levels <7 g/dl or haematocrit level <21% in addition to at least one of the following clinical criteria: (i) elevated oxygen requirement, (ii) persistent systemic hypotension despite the use of vasopressors, (iii) evidence of end-organ dysfunction or (iv) evidence of persistent bleeding. The perioperative period analysed in this study covers 30 days post-cardiac surgery.
Data were analysed using a statistical software package (GraphPad InStat, version 3.00, for Windows; GraphPad Software, Inc., San Diego, CA, USA) and presented as mean, numbers or ratio as needed. All statistical analyses were designed to test the null hypotheses that patient outcomes would not significantly differ as a function of transfusion guideline era or the presence of intraoperative and postoperative blood product transfusion. Categorical variables are expressed as standard group percentages, and continuous variables are expressed as means depending on overall variable distribution. Descriptive, univariate statistics included Pearson's χ2 or Fisher's exact test for categorical variables (when sample sizes were small), and the independent sample single factor analysis of variance for comparisons of normally distributed data or the Mann–Whitney U-test for non-normally distributed data comparisons. Calculated test statistics were used to derive all two-tailed P-values. Separate multivariate logistic regression models for blood product and component use were performed.
RESULTS
A total of 1126 (23%) patients (Group 1) were studied in a 12-month period (March 2012–February 2013) after the implementation of the new strategy, and compared with 3758 (77%) patients (Group 2) of the previous 36-month period (March 2009–February 2012). Table 1 summarizes patient demographics, characteristics and comorbidities for the two groups. The mean age for Group 1 was 67.2 vs 65.7 years for Group 2 (P = 0.96). Male sex was the majority in both groups (73 vs 72%, P = 0.89). Regarding comorbidities, there were statistically insignificant differences between the two groups (hypertension 84.7 vs 83.6%, P = 0.92; diabetes mellitus 36.4 vs 37.1%, P = 0.79; smoking history 41.9 vs 42.4%, P = 0.87; hyperlipidaemia 66.8 vs 69.4%, P = 0.68), with the exception of preoperative renal failure (3.2 vs 4.1%, P = 0.01). The incidence of preoperative heart failure (described as New York Heart Association functional status) was equivalent among the two groups. The use of preoperative use of aspirin was 89.3% in Group 1 and 86.4% in Group 2 (P = 0.21), and the use of antiplatelet (clopidogrel) within 1 week before surgery was 2.1 vs 2.3% (P = 0.28). Finally, the calculated STS score was 1.2% for Group 1 vs 1.5% for Group 2 (P = 0.05). Finally, as Table 1 reports, there were no significant differences between the two groups regarding the type of surgery performed.
Patient demographics, characteristics, comorbidities and type of surgery
| Variable | Group 1 (N = 1126) | Group 2 (N = 3758) | P-value |
|---|---|---|---|
| Age (years)a | 67.2 ± 11.3 | 65.7 ± 10.9 | 0.96 |
| Male sex (%) | 73 | 72 | 0.89 |
| Hypertension (%) | 84.7 | 83.6 | 0.92 |
| Diabetes mellitus (%) | 36.4 | 37.1 | 0.79 |
| Smoking history (%) | 41.9 | 42.4 | 0.87 |
| Hyperlipidaemia (%) | 66.8 | 69.4 | 0.68 |
| Renal failure (%) | 3.2 | 4.1 | 0.01 |
| NYHA class (%) | |||
| I | 8.4 | 8.1 | 0.64 |
| II | 44.8 | 45.6 | 0.58 |
| III | 36.1 | 35.9 | 0.69 |
| IV | 10.7 | 10.4 | 0.77 |
| Preoperative ASA (%) | 89.3 | 86.4 | 0.21 |
| Antiplatelet within 1 week (%) | 2.1 | 2.3 | 0.28 |
| STS score (%) | 1.2 | 1.5 | 0.05 |
| Type of surgery (%) | |||
| CABG | 34 | 33 | 0.76 |
| Valve | 40 | 41 | 0.81 |
| Valve/CABG | 12 | 12 | 0.88 |
| Aneurysm | 10 | 9 | 0.68 |
| Otherb | 4 | 5 | 0.77 |
aResults reported as mean ± standard deviation.
bOther includes pericardiectomy, resection of cardiac tumour and ablation for atrial fibrillation.
NYHA: New York Heart Association; ASA: acetylsalicylic acid; STS: Society of Thoracic Surgeons; CABG: coronary artery bypass graft.
Table 2 presents the intraoperative characteristics and unadjusted postoperative patient outcomes. Cross-clamp time and CPB time were equivalent in both groups. There was a significant reduction in the percent change of the intraoperative haematocrit between Groups 1 and 2 (14 vs 28%, P = 0.01), with an increase in the mean IAD volume (655 vs 390 ml, P = 0.02) and a reduction in the CPB priming volume (1000 vs 1600 ml, P = 0.03). Group 1 required significantly less blood transfusions in the perioperative (30 days postoperatively) period (29 vs 49%, P = 0.02) and had significantly reduced postoperative rates of respiratory failure (3 vs 7%, P = 0.03), pneumonia (1 vs 3.1%, P = 0.01), chest tube output (350 vs 730 ml, P = 0.01), reoperation for bleeding (1.2 vs 2.5%, P = 0.04) and length of stay (6.1 vs 8.2 days, P = 0.05). The rates of postoperative stroke, myocardial infarction and renal failure were not statistically different in the two groups. The 30-day mortality was significantly better in Group 1 (0.9% in Group 1 vs 1.7% in Group 2, P = 0.02). Regarding blood products, less fresh frozen plasma, platelets and cryoprecipitate were used in Group 1, both in the intraoperative and postoperative periods. The haematocrit at the end of the operation and upon discharge was comparable in both groups (Table 2).
Intraoperative characteristics and unadjusted postoperative patient outcomes
| Outcome | Group 1 | Group 2 | P-values |
|---|---|---|---|
| Cross-clamp time (min) | 68 | 69 | 0.09 |
| CPB time (min) | 89 | 91 | 0.07 |
| CPB priming volume (ml) | 1000 | 1600 | 0.03 |
| IAD volume (ml) | 655 | 390 | 0.02 |
| Chest tube output (ml) | 350 | 730 | 0.01 |
| Respiratory failure | 34 (3%) | 263 (7%) | 0.03 |
| Pneumonia | 11 (1%) | 116 (3.1%) | 0.01 |
| Stroke | 14 (1.2%) | 49 (1.3%) | 0.89 |
| Perioperative myocardial infarction | 1 (0.1%) | 4 (0.1%) | 0.99 |
| Renal failure | 33 (2.9%) | 101 (2.7%) | 0.1 |
| Reoperated for bleeding | 14 (1.2%) | 94 (2.5%) | 0.04 |
| Length of stay (days) | 6.1 | 8.2 | 0.05 |
| 30-day mortality | 10 (0.9%) | 64 (1.7%) | 0.02 |
| Intraoperative transfusions | |||
| Total PRBCs | 326 (29%) | 1841 (49%) | 0.02 |
| PRBCs (units)a | 0.2 ± 0.9 | 0.7 ± 1.4 | 0.02 |
| FFP (units) | 0.1 ± 0.2 | 0.1 ± 0.3 | 0.2 |
| Platelets (units) | 0.2 ± 0.9 | 0.3 ± 1.1 | 0.06 |
| Cryoprecipitate (units) | 0.1 ± 0.1 | 0.1 ± 0.2 | 0.8 |
| Postoperative transfusionsb | |||
| Total PRBCs | 203 (18%) | 1090 (29%) | 0.01 |
| PRBCs (units) | 0.1 ± 0.7 | 0.6 ± 1.1 | 0.02 |
| FFP (units) | 0.1 ± 0.1 | 0.1 ± 0.2 | 0.2 |
| Platelets (units) | 0.1 ± 0.7 | 0.2 ± 1.0 | 0.06 |
| Cryoprecipitate (units) | 0.1 ± 0.1 | 0.1 ± 0.2 | 0.8 |
| Haematocrita | |||
| End of operation (%) | 32 ± 3 | 33 ± 3 | 0.2 |
| At discharge (%) | 31 ± 2 | 32 ± 2 | 0.2 |
aResults reported as mean ± standard deviation.
bPostoperative period is 30 days.
CPB: cardiopulmonary bypass; IAD: intraoperative autologous donation; PRBCs: packed red-blood cells; MI: myocardial infarction; FFP: fresh frozen plasma.
Given the clinical differences in baseline patient characteristics between the patient cohorts (Table 1), multivariate analyses predicting the use of blood and transfusions were performed, controlling for significant differences in the patient groups (Table 3). In this multivariate model, Group 1 received significantly less PRBC transfusion compared with Group 2 (P = 0.02). Also, preoperative renal failure and a higher STS score were both associated with an increased need for blood transfusion.
Multivariate regression model for allogeneic packed red-blood cell transfusion
| Variable | Mean or %a | OR | 95% CI | P-values |
|---|---|---|---|---|
| Group (1 vs 2) | 29% | 0.33 | 0.29–0.45 | 0.02 |
| Age (years) | 66.1 | 0.92 | 0.85–1.19 | 0.93 |
| Hypertension | 83.8% | 0.98 | 0.91–1.23 | 0.93 |
| Diabetes mellitus | 36.8% | 0.96 | 0.86–1.21 | 0.94 |
| Smoking history | 42.3% | 0.96 | 0.87–1.27 | 0.94 |
| Hyperlipidaemia | 68.2% | 0.99 | 0.74–1.35 | 0.92 |
| Renal failure | 3.7% | 1.8 | 1.15–1.37 | 0.02 |
| NYHA class | ||||
| I | 8.2% | 0.97 | 0.88–1.14 | 0.95 |
| II | 45.3% | 0.96 | 0.83–1.22 | 0.96 |
| III | 36% | 0.97 | 0.84–1.24 | 0.95 |
| IV | 10.5% | 0.96 | 0.87–1.19 | 0.93 |
| STS score | 1.4% | 1.9 | 1.12–1.35 | 0.02 |
aAn overall average is reported for continuous variables and an overall percentage (of the total sample size) is reported for categorical variables.
OR: odds ratio; CI: confidence interval; NYHA: New York Heart Association; STS: Society of Thoracic Surgeons.
DISCUSSION
Blood transfusions in the perioperative period during cardiac surgery have been associated with a significant increase in morbidity and mortality, as well as the cost of hospitalization [11, 12]. In addition, despite consensus statements suggesting a 7-g/dl haemoglobin ‘trigger’ for red cell transfusion, substantial variability in the transfusion rates of PRBC and blood components exists in patients undergoing cardiac surgery [1]. Reports have shown that 50–60% of cardiac surgery patients receive blood transfusions in the perioperative period, with about 20% of the US blood supply being used in heart surgery alone [13]. Traditional and common belief dictates the avoidance of anaemia in cardiac surgical patients, with the more elderly patients and the ones with coronary disease being the most vulnerable; thus, prevention of anaemia is believed to lead to better outcomes [8]. However, there has been growing evidence of an association between red-blood cell transfusion and unfavourable morbidity, mortality and long-term outcomes after cardiac surgery [5–7]. A limitation of these studies is the fact that the question of whether transfusion precipitated the adverse postoperative outcome or the adverse outcome precipitated the transfusion cannot be answered [8].
The application of the STS/ACS guidelines is compromised by confusion concerning indications and risks of transfusion, as well as fear of litigation [11]. In this environment, driven further by the recent global economic crisis, it is not unexpected that many institutions have adopted initiatives and algorithms to reduce blood transfusions in cardiac surgery. Our approach to improve transfusion requirements is in accordance with such initiatives and with the STS/ACS 2011 guidelines. Our programme is easy to implement, but requires a multidisciplinary effort from surgeons, cardiologists, anaesthesiologists, perfusionists, intensivists and nursing staff.
Based on all the above, we decided to implement a more effective blood conservation programme that was put into effect in March 2012. Our approach was 2-fold: (i) more aggressive IAD based on a newly constructed nomogram, and (ii) use of a shorter length circuit of the CPB which decreased the fluid volume of the prime to 1000 ml from 1600 ml that was our traditional priming volume. The basic characteristics regarding demographics and comorbidities between the two compared groups were not significantly different, with the exception of renal failure (P = 0.01), which was more prevalent in Group 2. The STS score on estimated postoperative mortality was also higher in Group 2 (P = 0.05).
Our results show a significant decrease of blood transfusion after the implementation of the new blood conservation programme, as well as a significant decrease of chest tube output in the immediate postoperative period. Fewer transfusions are known to lead to less respiratory complications (such as pneumonia and respiratory failure), as is the case in our study. However, the incidence of stroke, myocardial infarctions and renal failure did not change significantly, as has been reported by other studies [1]. This was not the same for the length of stay, which improved after March 2012 from 8.2 days to 6.1 days (P = 0.05), same with the 30-day mortality, which improved from 1.7 to 0.9% (P = 0.02). It is our strong belief that this was the result of the improved rate of transfusion, similar with the outcomes of other studies published in the literature. Nevertheless, the observed associations between transfusions and patient morbidity and mortality in this series are well corroborated in other reports. Koch et al. [7] demonstrated that transfusion was associated with reduced short- and long-term risk-adjusted survival on more than 10 000 patients undergoing coronary artery bypass grafting. Likewise, Whitson et al. [14] identified transfusion as an independent risk factor for increased morbidity and mortality among patients undergoing cardiac surgery. Finally, Surgenor et al. [12] demonstrated that exposure to one unit of transfused PRBCs was associated with a 16% hazard of decreased survival in a multi-institutional cohort of more than 9000 patients. Thus, the present results serves out to enhance those of previous reports to further advocate for coordinated blood conservation programmes to further reduce cardiac surgical risk and morbidity.
Various similar outcomes have been reported in the literature. Moskowitz et al. [8] and DeAnda et al. [15] showed reduction in postoperative transfusion rates of 11 and 16%, respectively, after implementation of a blood conservation strategy in their institutions. More recently, LaPar et al. reported on the first multi-institutional effort to reduce blood transfusion in 14 259 patients undergoing non-emergency, primary, isolated coronary artery bypass grafting operations at 17 different cardiac centres in the state of Virginia. The authors concluded that the new implemented programme led to a significant reduction in blood transfusion, morbidity and mortality, and healthcare costs [1]. This study is of great importance as it provides clear evidence that a multi-institutional approach to a patient quality initiative is both feasible and beneficial.
The current study reports the successful implementation of a blood conservation programme in cardiac surgery in a high volume institution. In this analysis of perioperative outcomes within a year of implementation of a more effective strategy resulted in a significant decrease in patient morbidity, mortality and transfusion requirements after a heart operation. Our results show clearly that it is feasible to significantly reduce perioperative blood requirements with coordinated efforts and guidelines that can be applied to the majority of patients. A transfusion rate of 29% in the current study compares favourably with what has been reported in the literature and confirms that a multimodality approach to blood conservation in cardiac surgery is highly effective. However, the present study is a retrospective one, and has the internal disadvantages of such studies. One such limitation is the fact that the recorded differences in outcomes could originate in smaller recorded or unrecorded differences between the two study groups.
In conclusion, the present study shows that a three-way blood conservation strategy with aggressive IAD use, low CPB prime and effective RAP, along with standard cell saver techniques, is effective in cardiac surgery. Furthermore, permissive anaemia is safe and does not contribute to the incidence of adverse outcomes. The avoidance of blood transfusion may contribute to the reduction of risks of postoperative complications and long-term mortality. There is an imperative need, more than ever, for a randomized trial that would compare the current common practice of blood transfusion in cardiac surgery with a comprehensive programme of blood conservation like the one adopted by our institution.
Conflict of interest: none declared.
REFERENCES
APPENDIX. CONFERENCE DISCUSSION
Dr A. Jeppsson(Göteborg, Sweden): Yours is a very well-written paper; it is timely and focuses on a very interesting matter.
At first sight, your figures seemed very, very impressive with a 29% transfusion rate. However, we need more information about your patient mix. It appears that you have very low-risk patients with a very low mortality, less than 1% in 30 days. You have a low STS score. All acute patients are excluded. And you don't report how many of these are CABG surgery and how many are valve surgery, how many are combined, have you excluded aortic root surgery, et cetera. Can you please give us some more information about your patients?
Dr Avgerinos: You're right. In the beginning, we tried, so we don't get confounded by the high-risk patients, to exclude them, as you said. And I said we excluded emergency procedures. Possibly we excluded also the slightly more urgent procedures. So in further analysis, we have to include these patients as well because we all know that the risk of bleeding and transfusion in these patients is much higher. So we just wanted to have the lower risk patients to begin with. That's why I think also, and I agree with you on that, that the data are so enthusiastic and encouraging. So in further analysis, we have to include these patients as well.
Regarding (and you're right that maybe I should put in a revision) the type of surgeries, we had most of them, like everywhere else, CABGs and valves, but we also included ascending and root surgery. But I definitely have to specify it, because these patients actually are a little more prone to bleed just because there are so many more anastomoses performed.
And the other thing that we're thinking of doing is to give a brief analysis about our aspirin and Plavix policy. Maybe we should break down those patients as well to see how many of them bleed and how many do not, and how many get transfusions other than blood - platelets and FFP and cryo.
Dr Jeppsson: That was actually my next question because this is just red blood cells you're reporting here?
Dr Avgerinos: Exactly.
Dr Jeppsson: Yes. And what about patients with acute coronary syndrome and dual antiplatelet therapy, are they completely excluded, or if you have a patient where you wait five days, would they be included in this study?
Dr Avgerinos: They are included. For those - the ACS patients that we have to deal with, they're sometimes not really emergencies, but they're a little more urgent - we used clopidogrel almost up to the day of surgery. And what we were using is the assay in their blood. And if it was really high, then at the end of the procedure transfuse them platelets. But this is not really standardized.
Dr Jeppsson: So do you think that your protocol is applicable also to acute patients?
Dr Avgerinos: I think it could be. What do you think? I'm interested to know your opinion on that.
Dr Jeppsson: My next question is did you register the haemoglobin levels where the patients were transfused? Can you now retrospectively check when the patients were transfused because you have very, very hard transfusion triggers, 7 g/l. Did you actually wait for these low levels in the majority of your patients?
Dr Avgerinos: Yes. Because, especially in the ICU, we used the ABG machine to check the haemoglobin levels, so we would wait for 45 min, an hour, to have the complete blood count back. So we would base our decision on that number, which I know is not very accurate always, but it's a trend.
Dr Jeppsson: The reason why I ask is we did something similar to your protocol, and we decided that we should transfuse patients at a level of 7 g/l. But when we checked the level retrospectively, when we transfused the patient, the mean level was 8.5.
Dr Avgerinos: I see.
Dr Jeppsson: You give blood on higher haemoglobin levels than is in your protocol most of the time.
Dr Avgerinos: Right. So, yes, if that's the case, we don't have that data. We're based on the arterial blood concentration that the maybe sometimes not-perfectly calibrated machine gives us.
Dr J. Ferguson(Phoenix, AZ, USA): I just have two questions for clarification. The first one was, in your intraoperative transfusion rates, was that a cumulative for lactate levels, bicarb levels, or was that just indicated on each one of those that you clarified?
The second question was, on the slide about your prime, was that after rapping it got down to a litre, or was that what the priming volume was to begin with and then you rapped further from there and, say, got it down to 400 or 500?
Dr Avgerinos: The answer to the first question is we needed to have either of these criteria. And the second question - you mean what's the volume before or after rapping?
Dr Ferguson: Well, that's what I'm saying. Is that volume after rapping or is that just your priming volume for your circuit?
Dr Avgerinos: That's my priming volume for the circuit.
Dr Ferguson: So after rapping, you were actually less than that, correct?
Dr Avgerinos: Yes.
Dr Ferguson: Okay.
Dr J. Grau(Ridgewood, NJ, USA): I have one question. I come from Columbia, so I know that institution very well, and I know Cornell also. But how do you manage to have your surgeons agree with this protocol? In other words, it seems they have pretty good control of the patients throughout the entire intraop and postop stay. How do you implement this protocol? I think it's very interesting for all of us to learn when you have intensivists and surgeons working side by side.
Dr Avgerinos: So luckily enough, during this period we only had three surgeons operating, so it was a pretty small and homogenous group. But we had a meeting before we implemented the new data, and we all agreed to start using it. So the surgeon was in the loop of the strategy, but it was the anaesthesiologist who was using the nomogram and getting the volume needed. The perfusionist was using the mini circuit. So on post-op, both the surgeons and the intensivists, because we round on our own patients, would usually or most of the time come into agreement when to transfuse and when not. But at Cornell we had the policy that no transfusion would be given unless it was an emergency or unless the surgeon was notified first.
Dr Grau: So the surgeon had, in a way, the last word regarding giving blood?
Dr Avgerinos: Yes. That's way different from Columbia.
Dr Grau: That's why most people never wait until the Hb reaches 7.0 and unfortunately tend to transfuse at a higher haemoglobin level.
Dr Avgerinos: Right.
Author notes
Presented at the 27th Annual Meeting of the European Association for Cardio-Thoracic Surgery, Vienna, Austria, 5–9 October 2013.
