


The German Aortic Valve Registry (GARY) seeks to provide information on a real-world, all-comers basis for patients undergoing aortic valve interventions. This registry comprises patients undergoing the complete spectrum of transcutaneous and conventional surgical aortic valve interventions. The aim of this study was to use the GARY registry to evaluate conventional and catheter-based aortic valve interventions in several risk groups.
A total of 13 860 consecutive patients undergoing intervention for aortic valve disease [conventional aortic valve replacement (AVR) or transvascular/transapical TAVR (TV-/TA-TAVR)] were enrolled in 78 German centres in 2011. Baseline, procedural and outcome data, including quality of life, were acquired up to 1 year post-intervention. Vital status at 1 year was known for 98.1% of patients.
The 1-year mortality rate was 6.7% for conventional AVR patients (n = 6523) and 11.0% for patients who underwent AVR with coronary artery bypass grafting (n = 3464). The 1-year mortality rate was 20.7 and 28.0% in TV- and TA-TAVR patients, respectively (n = 2695 and 1181). However, if patients were stratified into four risk groups by means of the EuroSCORE and the German AV Score, the highest risk cohorts showed the same mortality at 1 year with either therapy. More than 80% of patients in all groups were in the same or better state of health at 1 year post-intervention and were satisfied with the procedural outcome.
Conventional AVR surgery yields excellent results after 1 year in lower-risk patients. Catheter-based AVR is a good alternative in high-risk and elderly patients.
INTRODUCTION
Aortic stenosis is the most frequent valvular heart disease in the ageing Western population. The prognosis of this disease in symptomatic patients with conservative therapy is poor. Thus, surgical aortic valve replacement (AVR) has become the therapeutic gold standard with well-documented benefits in terms of symptom relief and survival [1]. For many years, the only available option in patients with inoperable aortic stenosis was balloon valvuloplasty, which is associated with only transitory improvements in clinical status and is therefore regarded as palliative therapy.
During the past decade, transcatheter AVR (TAVR) has emerged as a minimally invasive alternative for high-risk patients [2–4]. Small, randomized studies confirmed acceptable outcomes for certain selected high-risk and inoperable patients [5, 6] for both the transvascular (TV) and the transapical (TA) approach, when compared with conservative or surgical management.
The current guidelines on valvular therapy have predominantly relied on small, retrospective, single-centre observational outcome studies and larger registries in order to arrive at recommendations for aortic valve intervention in higher-risk patients. These registries, however, have mostly focused on isolated TAVR patients, neglecting the recent advances in conventional surgery and the excellent haemodynamic performance of modern bioprostheses [7, 8].
The number of TAVR procedures performed in Germany and Europe has increased in recent years, and a better understanding of which patient group benefits most from which treatment option is urgently needed. The mid- and long-term outcomes for TAVR procedures are urgently required in order to answer the question of whether the short-term benefits of such minimally invasive procedures may be compromised by worse long-term outcomes.
With this background, the German Society of Cardiology (DGK) and the German Society for Thoracic and Cardiovascular Surgery (DGTHG) inaugurated the German Aortic Valve Registry (GARY). It is supported by the patient organization ‘Deutsche Herzstiftung’. The goal was to gather clinical information on all aortic valve procedures (transcutaneous and conventional, including patients being treated for coronary disease) currently being performed in Germany. Here, we report on the 1-year outcomes of all patients recruited into the GARY in 2011.
MATERIALS AND METHODS
The German Aortic Valve Registry
The GARY was inaugurated in July 2010 by the DGK and the DGTHG with the aim to obtain a ‘real-world’ picture of the current practice of the treatment of aortic valve disease in Germany as well as to gather reliable data on the short- and long-term outcomes of different aortic valve treatment strategies. All patients undergoing interventional treatment (i.e. AVR including the Ross procedure, aortic valve repair, aortic valvuloplasty and TV- and TA-TAVR) were eligible for inclusion. It is planned to enrol patients in the registry until 2015 and then to gather 5-year follow-up data on all patients. The expected total number of patients is more than 80 000.
The GARY registry protocol has been previously described in detail [9]. Participation is on a voluntary basis. Ethics approval was obtained from all participating centres, and patients' written, informed consent was obtained preoperatively. A comprehensive case report form including patient details, information on decision-making, and actual treatment as well as detailed data on postoperative outcomes was provided by the treating clinic and submitted to an independent research institute for quality control (BQS Institute for Quality and Patient Safety). This independent research institution performs all statistical analyses and acquires annual patient follow-up (see below). The BQS Institute also performs an audit for completeness and quality of data on a random selection of 5% of all hospitals. Furthermore, all datasets are double-checked with the mandatory national database on cardiac operations.
The registry's responsible body is a non-profit organization known as the ‘Deutsches Aortenklappenregister GmbH’ founded by the DGK and the DGTHG. The responsible societies and the BQS Institute are independent organizations by virtue of their constitutions. The GARY registry receives financial support in the form of unrestricted grants by medical device companies, the German Heart Foundation, the DGK and the DGTHG, none of which have either access to data or influence on their publication.
Patient selection and risk profile
Patients undergoing conventional AVR with or without coronary artery bypass grafting (CABG) or TAVR were included in the current analysis. Patients with pure aortic insufficiency and those undergoing aortic valve repair or other uncommon surgical operations (e.g., aortic valve-sparing surgery and Ross operation) were documented in the registry but excluded from the current study, as were patients undergoing balloon valvuloplasty.
A comprehensive description of the patient baseline characteristics, procedural data and in-hospital outcomes has been published previously [10]. The most important baseline parameters are given in Supplementary Data.
In higher-risk patients, the decision as to which treatment strategy was appropriate was made by a heart team in the large majority of transcatheter patients (86.1% of TV-TAVR and 90.4% of TA-TAVR). Common reasons for choosing TAVR over conventional AVR were advanced age (TV-TAVR 69% and TA-TAVR 72%), frailty (TV-TAVR 44% and TA-TAVR 48%) or overall high operative risk (TV-TAVR 64% and TA-TAVR 65%).
The 4 patient groups differed markedly in age and risk profile. Most TAVR patients (TV-TAVR 86.3% and TA-TAVR 84.0%), but only a minority of the conventional surgery patients (AVR 33.3% and AVR + CABG 44.9%) were older than 75 years. Also, the mean logistic EuroSCORE was significantly higher in the TAVR groups (TV-TAVR 25.9%, TA-TAVR 24.5%, AVR 8.8% and AVR + CABG 11.0%).
Centre participation, implantation numbers and follow-up
From 1 January to 31 December 2011, a total of 13 860 consecutive patients with aortic valve disease who met the above inclusion criteria were enrolled in the GARY. A total of 78 sites submitted patient data, representing approximately 55% of all aortic valve interventions performed in Germany during this time period. Included in the current study were 6523 AVR, 3462 AVR + CABG, 2694 TV-TAVR and 1181 TA-TAVR interventions.
One-year clinical follow-up was obtained in 89.5% of patients. A small number of patients (2.3%) refused further participation in the structured interview (for the purpose of the analysis they were assigned the status of ‘living’). When combined with the vital status information obtained from the national authorities, a living status for 98.1% of all patients was obtained.
Follow-up
The mid- and long-term follow-up was planned per protocol at 1, 3 and 5 years postoperatively. The independent BQS Institute acquired follow-up information in a staged process. First, all patients were informed that they would get a telephone call for the 1-year follow-up in the following week. The questions for the interview were submitted so that they could prepare themselves. Up to four attempts at telephone contact were made using a standardized interview protocol. Information on vital status, adverse events, hospitalization and quality of life was obtained through these interviews. For patients who could not be reached by mail or telephone contact, a formal inquiry to the local registry offices was made in order to collect information on their vital status.
In addition to clinical outcome parameters, the follow-up includes standardized questions regarding the quality of life and overall satisfaction with the procedure. Although the grouping into categories and comparison with the preoperative status is a subjective evaluation by the patient, it completes the picture of long-term outcome.
The German Aortic Valve Score
The German Aortic Valve Score (German AV Score) was developed for risk adjustment of mortality in surgical and transcutaneous treatments for aortic valve interventions in adults. The underlying model with 15 risk factors was based on the patient's medical condition and was calculated by using the comprehensive national German data pool from previous years [11].
Statistical analysis
Patients were divided into four groups: conventional AVR with or without CABG (AVR and AVR + CABG) and TV- and TA-TAVR. Categorical variables are presented in absolute numbers and percentages, and continuous scaled variables as mean ± standard deviation (SD), throughout the manuscript. The Chi-square test was used to check the significance of the differences between the groups. Time-to-event curves for death were calculated with Kaplan–Meier methods with estimation of the date of death if the exact date was unknown. Comparison of survival curves between the 4 patient groups was performed with the log-rank test. Statistical significance was tested using two-sided tests with an alpha level of 5%. For multiple comparisons among the four treatment groups, the alpha levels of the pairwise results were corrected using the Bonferroni–Holm–Shaffer procedure. We used this step-down procedure because our multiple-hypothesis system contains all six possible pairwise hypotheses. If the global hypothesis was rejected, the smallest P-value of the six pairwise comparisons was compared with alpha divided by 6. If rejected, the next smallest P-value was compared with alpha/3. Then, until rejection stopped, the next P-values were compared, dividing alpha by 3 (third step), alpha by 3 (fourth step), alpha by 2 (fifth step) and alpha for the sixth comparison (6-3-3-3-2-1 rule). The EuroSCORE and the German AV Score were used to stratify risk groups.
RESULTS
Survival
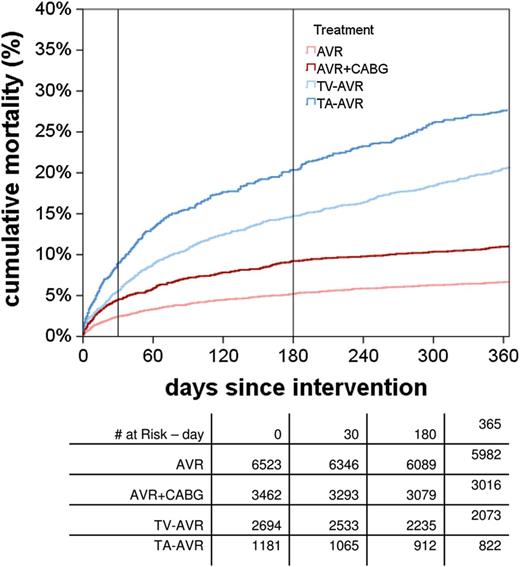
Overall death rates within the first year. Pairwise tests: for multiple comparison to correct by Bonferroni–Holm–Shaffer (6-3-3-3-2-1 rule). AVR: aortic valve replacement; CABG: coronary artery bypass grafting; TA: transapical; TV: transvascular.
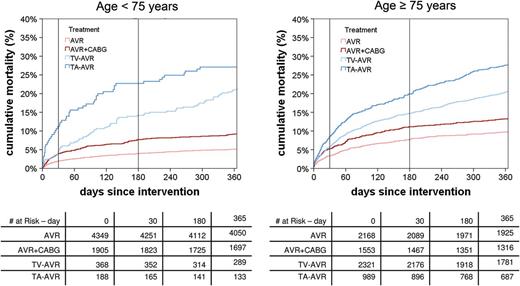
Time-to-event curves for death stratified by age. AVR: aortic valve replacement; CABG: coronary artery bypass grafting; TA: transapical; TV: transvascular.
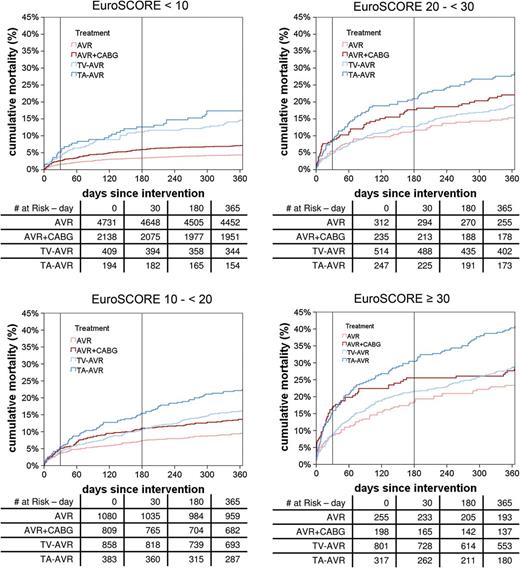
Time-to-event curves for death stratified by the logistic EuroSCORE. AVR: aortic valve replacement; CABG: coronary artery bypass grafting; TA: transapical; TV: transvascular.
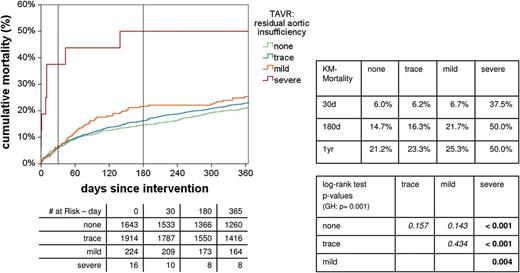
Influence of residual aortic regurgitation on survival. KM: Kaplan-Meier; GH: global hypothesis; TAVR: transcatheter AVR.
Major adverse events and other clinical outcomes
The following analyses refer to patients in whom a complete clinical follow-up interview could be obtained, the results of which are summarized in Table 1. In these patients, new strokes were reported up to 1 year post-intervention in 3.0% of AVR patients, 4.5% of AVR + CABG patients, 4.8% of TV-TAVR patients and 3.6% of TA-TAVR patients. Most strokes occurred during the initial hospitalization. The differences between AVR and AVR + CABG as well as AVR and TV-TAVR were statistically significant. All other pairwise comparisons did not reach statistical significance. Approximately one-half of neurological events were major strokes (AVR 1.7%, TV-TAVR 2.0% and TA-TAVR 1.8%), resulting in substantial impairment of patients’ quality of life.
Adverse event rates of interviewed patients
| Surgical AVR | TAVR | P-value of global hypothesis | P-values of pairwise comparisons [alpha level has to be corrected by the Bonferroni–
Holm–Shaffer method for multiple comparisons (6-3-3-3-2-1-rule); italic type = n.s.] | ||||||||
|---|---|---|---|---|---|---|---|---|---|---|---|
| Without CABG | With CABG | Transvascular | Transapical | H0: no differences between any procedures | H0: AVR = AVR + CABG | H0: AVR = TV − AVR | H0: AVR = TA − AVR | H0: AVR + CABG = TV − AVR | H0: AVR + CABG = TA − AVR | H0: TV−AVR = TA − AVR | |
| One-year follow-up: interviewed patients | 5421 | 2718 | 1782 | 715 | |||||||
| Minor stroke | |||||||||||
| In hospital | 47 (0.9%) | 43 (1.6%) | 33 (1.9%) | 7 (1.0%) | 0.002 | 0.005 | 0.001 | 0.673 | 0.554 | 0.293 | 0.157 |
| Total at 1 year | 71 (1.3%) | 58 (2.1%) | 50 (2.8%) | 13 (1.8%) | <0.001 | 0.006 | <0.001 | 0.301 | 0.163 | 0.660 | 0.203 |
| Major stroke | |||||||||||
| In hospital | 56 (1.0%) | 37 (1.4%) | 16 (0.9%) | 4 (0.6%) | 0.237 | 0.187 | 0.682 | 0.310 | 0.203 | 0.083 | 0.467 |
| Total at 1 year | 94 (1.7%) | 63 (2.3%) | 35 (2.0%) | 13 (1.8%) | 0.348 | 0.073 | 0.537 | 0.879 | 0.466 | 0.477 | 0.873 |
| Stroke (any) | |||||||||||
| In hospital | 103 (1.9%) | 80 (2.9%) | 49 (2.7%) | 11 (1.5%) | 0.007 | 0.003 | 0.036 | 0.657 | 0.784 | 0.036 | 0.083 |
| Total at 1 year | 165 (3.0%) | 121 (4.5%) | 85 (4.8%) | 26 (3.6%) | 0.001 | 0.001 | 0.001 | 0.361 | 0.611 | 0.406 | 0.238 |
| New PM implantation | |||||||||||
| In hospital | 261/5165 (5.1%) | 117/2589 (4.5%) | 377/1559 (24.2%) | 69/625 (11.0%) | <0.001 | 0.315 | <0.001 | <0.001 | <0.001 | <0.001 | <0.001 |
| Total at 1 year | 397/5165 (7.7%) | 188/2589 (7.3%) | 409/1559 (26.2%) | 88/625 (14.1%) | <0.001 | 0.523 | <0.001 | <0.001 | <0.001 | <0.001 | <0.001 |
| Myocardial infarction | |||||||||||
| In hospital | 14 (0.3%) | 10 (0.4%) | 1 (0.1%) | 2 (0.3%) | 0.179 | 0.392 | 0.137 | 0.709 | 0.059 | 1.000 | 0.199 |
| Total at 1 year | 24 (0.4%) | 18 (0.7%) | 10 (0.6%) | 5 (0.7%) | 0.484 | 0.193 | 0.550 | 0.376 | 0.847 | 1.000 | 0.755 |
| PCI | |||||||||||
| In hospital | – | – | – | – | – | – | – | – | – | – | – |
| After discharge | 28 (0.5%) | 30 (1.1%) | 33 (1.9%) | 11 (1.5%) | <0.001 | 0.005 | <0.001 | 0.004 | 0.039 | 0.335 | 0.737 |
| CABG | |||||||||||
| In hospital | – | – | – | – | – | – | – | – | – | – | – |
| After discharge | 14 (0.3%) | 12 (0.4%) | 2 (0.1%) | 3 (0.4%) | 0.169 | 0.210 | 0.386 | 0.439 | 0.058 | 1.000 | 0.145 |
| Aortic valve intervention after the first procedure | |||||||||||
| In hospital | 29 (0.5%) | 13 (0.5%) | 5 (0.3%) | 0 (0.0%) | 0.124 | 0.870 | 0.232 | 0.042 | 0.345 | 0.084 | 0.330 |
| Total at 1 year | 83 (1.5%) | 30 (1.1%) | 13 (0.7%) | 2 (0.3%) | 0.002 | 0.132 | 0.009 | 0.003 | 0.272 | 0.047 | 0.257 |
Bold values show significant differences and italic values show differences that are not significant.
AVR: Aortic valve replacement; H0: null hypothesis; PM: pacemaker; PCI: percutaneous coronary intervention; CABG: coronary artery bypass grafting; TA: transapical; TV: transvascular; TAVR: transcatheter AVR; -: data not available.
New pacemaker implantation rates 1 year post-intervention were highest in the TV-TAVR (26.2%) and the TA-TAVR groups (14.1%). For conventionally operated patients, the 1-year rates of pacemaker implantation were 7.7 and 7.3% for AVR and AVR + CABG patients, respectively. Pacemaker rates were significantly lower in conventionally operated patients than in both TAVR groups. The large majority of pacemaker implants occurred during the index hospitalization.
The reported rates for myocardial infarction and need for coronary bypass surgery were all below 1% during the first year post-intervention (Table 1). Percutaneous coronary intervention was performed in 1.9% of TV-TAVR, 1.5% of TA-TAVR, 1.1% of AVR + CABG and 0.5% of conventional AVR patients.
A second intervention on the aortic valve was required in 1.5% of the conventionally operated patients (1.1% AVR + CABG) and in 0.7% (TV-) and 0.3% (TA-) of TAVR patients. The rate of repeat hospitalization during the first year was ∼30% in the AVR group and highest in the TA-TAVR group (45.5%). Between 4.4 and 8.3% of the patients had to be re-hospitalized for complications of the initial procedure (Supplementary Data).
Quality of life
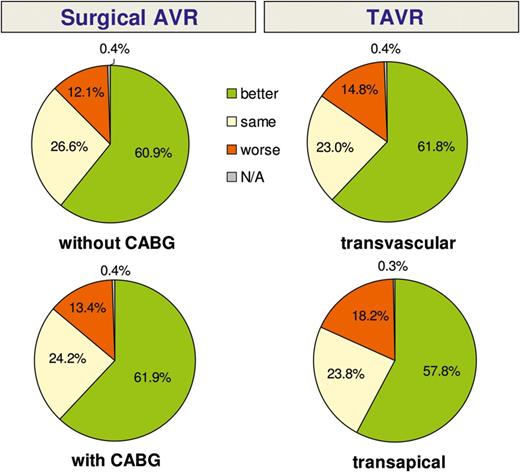
One-year follow-up: subjective rating of general health condition when compared with condition prior to the intervention. KM: Kaplan-Meier; GH: global hypothesis; TAVR: transcatheter AVR.
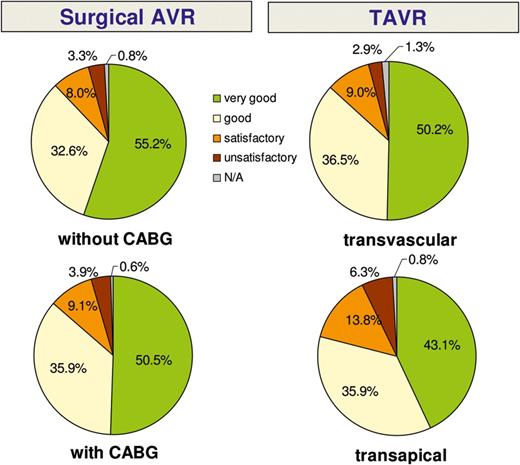
Satisfaction with outcome 1 year after the procedure.
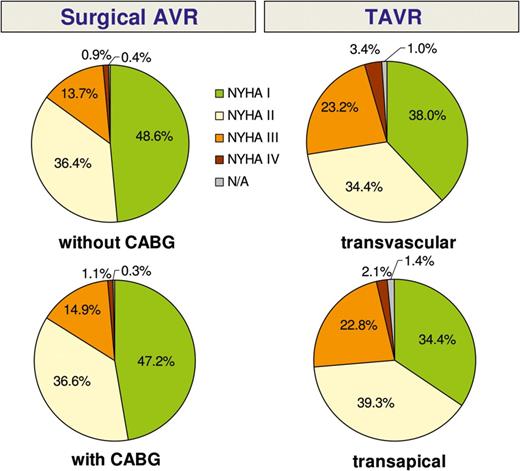
Heart failure symptom rating (NYHA) at 1 year post-intervention.
DISCUSSION
The therapeutic options for patients with aortic stenosis have changed during the past decade. Catheter-based valve implantations have become routine procedures in numerous cardiovascular centres around the world and are listed in the guidelines on valvular heart disease as an alternative for patients at high risk for conventional surgery [1]. A rapidly increasing number of TAVR procedures has been observed over the last 5 years, particularly in countries with no restrictions on reimbursement. For example, TAVR accounted for approximately one-third of all isolated aortic valve procedures in Germany in 2011 [12]. In 2012, this number rose to 35%, while the absolute number of conventional AVR procedures remained stable during the same time period. Despite a surge in procedures performed and clinical studies on patients undergoing TAVR, the decision about which therapy is best for which patient is still a matter of intense debate. At present, the opinion of local heart teams seems to be the most reliable basis for individual patient decisions.
A large, randomized TAVR trial demonstrated the superiority of TAVR over conservative therapy in inoperable patients (PARTNER B) [5], while non-inferiority was observed compared with conventional AVR in patients at high risk for surgery (PARTNER A) [6]. A second randomized comparison that was published just recently showed an even higher survival rate with TAVR in patients with an increased risk for surgical valve replacement after 1 year [13]. Tamburino et al. [14] recently published a comparison of the 1-year outcome after TAVR versus surgical AVR. In this retrospective study with a relatively small number of patients, no differences between the groups concerning the primary endpoint of major adverse cardiac and cerebral events were found after risk adjustment. However, the 30-day mortality in the surgical group was unusually high, whereas late mortality in the TAVR group was higher [14]. Most other publications that comment on patient treatment alternatives are either small, retrospective, observational studies or registries that include only TAVR patients [15–18]. A direct comparison between TAVR and conventional AVR is therefore difficult. However, randomized studies comparing TAVR with surgical AVR in intermediate-risk patients are currently enrolling patients (SURTAVI [19] and PARTNER II [20]).
Randomized, controlled clinical trials (RCTs) have the benefit of making a direct comparison between different treatment strategies possible while minimizing potential bias. They are usually monitored by a control laboratory, and patient follow-up rates are usually very high. On the other hand, patient selection for RCTs makes generalization of the results to the general patient population problematic. A ‘real-world’ situation is usually not depicted in such RCTs, and differences in uncommon complications are often difficult to detect due to the low number of patients that are sometimes included. In contrast, large registries often deliver a more valid picture of current practice patterns. Although comparison of patient groups within registry data is complicated by patient selection bias, large numbers of patients and inclusion of a broad variety of risk groups may allow for more general conclusions about the value of specific treatments.
GARY is unique in that it includes all interventional and surgical treatment options for aortic valve disease that are currently available in Germany. Our aim was to obtain a comprehensive and contemporary picture of the current practice of aortic valve intervention therapy and to create an independent database that will allow for long-term follow-up of those patients. The acceptance of this voluntary registry is demonstrated by the fact that 55% of all aortic valve procedures performed in Germany in 2011 were included, with an increasing recruitment rate observed in 2012 (data not shown). In addition, a good follow-up rate of 98.5% with regard to vital status and 90% for clinical information was achieved. Owing to patient selection, direct comparison between treatment groups should be interpreted with caution. However, the large number of patients enrolled and the independently performed follow-up up to 5 years post-intervention should allow for important insights into the best treatment options in select patient groups, for instance with the use of propensity matching.
Analysis of our data reveals that, in the vast majority of cases, patients were treated according to the current guidelines. Transcatheter interventions were mostly reserved for older patients with multiple risk factors. Although current risk-scoring systems have many inherent limitations, we found that a logistic EuroSCORE cut-off of 20% was the point at which TAVR resulted in outcomes that were similar to those of conventional surgery. A previously published consensus statement suggested that a EuroSCORE value of 20% be used as a guideline for identifying patients who may be suitable TAVR candidates [21]. However, the EuroSCORE has been shown to markedly overestimate perioperative mortality [22]. It is for this reason that we also stratified patient risk groups according to the recently published German AV Score [10]. This score was developed to predict perioperative mortality for aortic valve interventions. Although the German AV Score performed well when predicting risk in patients undergoing conventional AVR, it has not yet been validated in TAVR patients. New risk scores that focus on this patient population and the specific risks that are connected with TAVR treatment may be required.
Our analysis of conventional AVR patients demonstrates that conventional surgical techniques can be applied in all risk groups with excellent outcomes that are similar to or better than those reported in recent publications [7, 8]. Considering that all comers were included in the GARY registry, including emergency and active endocarditis patients, the low mortality and stroke rates we observed support the position of conventional AVR being the gold standard for patients with aortic stenosis at low and intermediate risk.
The GARY data for survival after TAVR are similar to data published in previous studies and registries (1-year survival: GARY TV-TAVR 79.3%, GARY TA-TAVR 72%, ADVANCE registry 82% [18], UK registry 78.3% [16] and France II registry 76.3% [15]). As stated above, a direct comparison to conventional operations is difficult due to markedly different baseline characteristics resulting from patient selection. Although TA-TAVR patients seem to have a worse outcome with similar preoperative risk scores, further analysis may be required. Previous publications have shown that there is a learning curve associated with the TA approach [23], and data from the PARTNER Continued Access Registry show that the TA approach yields results that are similar to those obtained with the transfemoral approach. Most centres that contributed data to the GARY followed a clear ‘transfemoral first strategy’, which leads to higher-risk patients (in particular, those with peripheral vascular disease) being chosen for non-transfemoral routes.
The low rates for other procedural complications that we observed reflect the growing experience in transcutaneous aortic valve therapy. However, TAVR is associated with a not inconsequential risk of serious complications requiring immediate surgical or interventional therapy. Recently published data suggest that serious intraprocedural complications have become rare and are reported at a rate of 1–2%. Fortunately, approximately 50% of patients can be saved by an on-site cardiac surgery team [24, 25]. The clear focus of the discussion should be the improvement in survival of procedural complications by optimizing the set-up and having heart surgeons and perfusionists ready on site and trained to manage those situations.
Stroke is a dreaded complication of any aortic valve procedure. Our data suggest that the incidence of stroke 1 year post-intervention is higher in the TAVR groups, but this might be attributed to the higher-risk patient profile. Pacemaker implantation requirements were also markedly higher in TAVR patients, with approximately one-quarter of TV-TAVR patients receiving a pacemaker up to 1 year post-intervention. The long-term follow-up at 5 years might help to evaluate the impact of pacemaker implantation, if any, on patient outcomes.
Another goal of our registry was to evaluate patient satisfaction and quality of life after aortic valve therapy. The vast majority of interviewed patients reported to be in better general condition than before the procedure, to have fewer clinical symptoms (i.e. NYHA class I or II) and a high degree of satisfaction with their procedure. We failed to find any difference between the groups with regard to patient satisfaction and quality of life.
CONCLUSION
The 1-year results of the GARY confirm in a large ‘real-world’, all-comer patient population that conventional surgery in operable patients yields excellent results in all risk groups. TAVR is being performed in a significant proportion of patients and is a good alternative for high-risk patients. Continuation of the registry and long-term follow-up will help to develop robust future risk models to predict patient outcomes for each treatment option in patients with aortic stenosis.
LIMITATIONS
Data acquisition and analysis are subject to the inherent limitations of a registry database. Whereas prospective, randomized trials have strengths in comparing patient groups while minimizing bias, the current registry reflects current, everyday practice and a ‘real-world’ scenario in Germany.
SUPPLEMENTARY MATERIAL
Conflict of interest: David Holzhey received fees as a proctor for Symetis and Medtronic and as an advisor for Edwards. Michael Böhm served on advisory boards for AstraZeneca, Bayer AG, Boehringer-Ingelheim, Daiichi-Sankyo, MSD, Novartis, Pfizer, Sanofi-Aventis and Servier; and on speakers' bureaus for AstraZeneca, Bayer AG, Boehringer-Ingelheim, Daiichi-Sankyo, AWD Dresden, Berlin-Chemie, MSD, Novartis, Pfizer, Sanofi-Aventis, Servier, Medtronic; and received study support from Astra Zeneca, Bayer AG, Boehringer-Ingelheim, Novartis, Pfizer, Sanofi-Aventis, Servier, Adrian-Medtronic.
REFERENCES
Author notes
An excerpt of the 1-year data was first presented at the ACC in San Francisco in March 2013.
