-
PDF
- Split View
-
Views
-
Cite
Cite
Luis Huerta, Lisa Rancan, Carlos Simón, Jesús Isea, Eduardo Vidaurre, Elena Vara, Ignacio Garutti, Federico González-Aragoneses, Ischaemic preconditioning prevents the liver inflammatory response to lung ischaemia/reperfusion in a swine lung autotransplant model, European Journal of Cardio-Thoracic Surgery, Volume 43, Issue 6, June 2013, Pages 1194–1201, https://doi.org/10.1093/ejcts/ezs599
Close - Share Icon Share
Abstract
Lung ischaemia/reperfusion (IR) induces a systemic inflammatory response that causes damage to remote organs. The liver is particularly sensitive to circulating inflammatory mediators that occur after IR of remote organs. Recently, remote ischaemic preconditioning has been proposed as a surgical tool to protect several organs from IR. The present study was designed to investigate a possible protective effect of lung ischaemic preconditioning (IP) against the liver inflammatory response to lung IR.
Two groups [IP and control (CON)] of 10 Large White pigs underwent lung autotransplants (left pneumonectomy, ex situ cranial lobectomy and caudal lobe reimplantation). Before pneumonectomy was performed in the study group, IP was induced with two 5-min cycles of left pulmonary arterial occlusion and a 5-min interval of reperfusion between the two occlusions. Five animals underwent sham surgery. Liver biopsies were obtained during surgery at (i) prepneumonectomy, (ii) prereperfusion, (iii) 10 min after reperfusion of the implanted lobe and (iv) 30 min after reperfusion. The expression of tumor necrosis factor-α (TNF-α), interleukin (IL)-1, IL-10 and inducible form of nitric oxide synthase (iNOS) was analysed by western blotting. The expression of mRNA for TNF-α, IL1, IL-10, monocyte chemoattractant protein-1 (MCP-1), nuclear factor kappa beta and iNOS was analysed by reverse transcription–polymerase chain reaction. Caspase-3 activity was determined by enzyme-linked immunosorbent assay. Non-parametric tests were used to compare differences between and within groups.
Lung IR markedly increased expression of TNF-α (P = 0.0051) and IL-1 (P = 0.0051) and caspase-3 activity (P = 0.0043) in the CON group compared with the prepneumonectomy levels. A decrease of IL-10 mRNA expression was observed in the CON group after lung reperfusion. In the IP group, TNF-α (P = 0.0011) and IL-1 (P = 0.0001) expression and caspase-3 activity (P < 0.0009) were lower after reperfusion than in the CON group. IP caused reversion of the observed decrease of IL-10 mRNA expression (P = 0.016) induced in liver tissue by lung IR. Lung IR markedly increased the expression of mRNA MCP-1 after 10 min (P = 0.0051) and 30 min (P = 0.0051) of reperfusion. These increases were not observed in the IP or sham groups.
IP prevented liver injury induced by lung IR through the reduction of proinflammatory cytokines and hepatocyte apoptosis.
INTRODUCTION
Lung ischaemia/reperfusion (IR) induces a local inflammatory response in pulmonary tissue characterized by non-specific alveolar damage, lung oedema and hypoxaemia. Many different mediators have been implicated in the pathogenesis of IR lung injury, and several authors have shown that the increase in lung biomarkers is related to postoperative pulmonary complications and poor postoperative outcome [1, 2]. Lung IR may also induce a systemic inflammatory response that causes damage to remote organs that is more detrimental than its local effects. The liver is particularly sensitive to circulating inflammatory mediators that occur after IR of remote organs, such as the kidney [3–5], gut [6] and skeletal muscle [7, 8]. The findings from one experimental study in rabbits suggest that pulmonary IR induces liver injury characterized by activated neutrophil sequestration and the release of significant amounts of reactive oxygen species [9]. Thus, once IR lung injury occurs and the liver suffers the consequences, treatment must focus on both local and remote responses. Furthermore, prevention strategies against lung IR injury should address their beneficial effects on both lung and liver injuries.
Direct ischaemic preconditioning (IP) has been proven to protect several organs from IR injury. Recently, remote ischaemic preconditioning (RIPC), defined as IP by repetitive ischaemic episodes in an organ that is remote from the organ to be protected, has been proposed as a surgical tool to prevent cardiac, hepatic or brain ischaemia. In those studies, limb and liver ischaemia have been the main sites of preconditioning stimuli. The authors have previously shown that, in a swine model of lung autotransplantation, IP attenuated lung IR injury by preventing increases in lipid peroxidation metabolites, leukocyte activation and proinflammatory cytokines in lung tissue [10]. However, little is known about the effects of IP on liver response to lung IR. The present experimental study was designed to investigate a possible protective effect of IP against the liver inflammatory response to lung IR.
MATERIALS AND METHODS
This study was approved by the institution's Research and Animal Experimentation Committee, and all of the animals received humane care in compliance with the European Convention on Animal Care.
Animal model and study groups
Twenty Large White pigs weighing 35–50 kg underwent an orthotopic left lung autotransplantation (left pneumonectomy, ex situ cranial lobectomy and left caudal lobe reimplantation) with a subsequent 30-min graft reperfusion. The animals were grouped by random numbers (Microsoft Excel 2003) to receive lung autotransplantation without IP [control (CON) group, n = 10] or with an IP procedure (IP group, n = 10). In addition, five animals underwent sham surgery (SHAM group).
Anaesthesia and surgical protocols
The anaesthesia protocol and the surgical technique for this lung autotransplant model have previously been described in detail [10, 11]. Briefly, premedication was performed using intramuscular ketamine 10 mg/kg (Ketoral; Parker Davis). Once in the operating room, pulsioxymetry and electrocardiographic monitoring were performed. Anaesthesia induction was achieved with propofol 4 mg/kg (Diprivan; Fresenius K), fentanyl 3 μg/kg (Fentanest; Kern Pharma) and atracurium 0.6 mg/kg (Tracrium; GlaxoSmithKline). Orotracheal intubation was performed, and mechanical ventilation was provided with a Drager SA-1 ventilator (tidal volume 8 ml/kg, respiratory rate 12–15 rpm and inspiratory/expiratory ratio of 1:2 to maintain PaCO2 in the range of 35–40 mmHg). FiO2 was maintained at 1 throughout the procedure. Intraoperative crystalloid infusion was maintained at 6–8 ml/kg/h. Anaesthesia was maintained with propofol in continuous perfusion (8–10 mg/kg/h) throughout the experiment. The supplemental doses of fentanyl and atracurium were used when required. A surgical tracheotomy was performed, the orotracheal tube was removed and a 6-mm cuffed tube was inserted into the trachea through the tracheotomy. A 7-F pulmonary artery catheter (Edwards Lifesciences) was introduced through the femoral vein. A 7-F femoral artery catheter was used for blood pressure monitoring and blood sampling.
A left thoracotomy was carried out by means of a fourth or fifth rib resection followed by a 5- to 6-cm subxiphoid midline laparotomy to allow liver biopsies to be performed. To perform left pneumonectomy, the pulmonary artery, cranial vein, caudal vein and main left bronchus were progressively dissected. Two-lung ventilation was maintained until the pulmonary vessels were dissected, the main left bronchus was sectioned and the endotracheal tube was placed into the right bronchus. Just before the pneumonectomy was completed, a bolus of intravenous heparin 300 IU/kg (MaynePharma Spain, S.L.) was administered to prevent thrombosis in the clamped pulmonary artery. Next, on the back table, the left lung was perfused through the pulmonary artery and veins with University of Wisconsin solution at 10–15°C until a clear effluent from the pulmonary vessels was observed. A cranial lobectomy was carried out, and the caudal left lobe was then implanted back into the animal by performing a bronchus-to-bronchus anastomosis, a pulmonary artery-to-pulmonary artery anastomosis and an inferior vein-to-left atrium anastomosis. Graft reperfusion was performed initially in a retrograde direction by unclamping the left atrium, and then the endobronchial tube was pulled back into the trachea, enabling two-lung ventilation. Anastomotic patency of the atrial anastomosis was determined by active bleeding through the open pulmonary artery anastomosis. The left pulmonary artery was then unclamped, and blood flow was maintained for 30 min. At the end of the experiment, the animal was euthanized with a potassium chloride injection under deep anaesthesia. In the experimental group, 5 min before the dissected pulmonary vessels and the main left bronchus were sectioned, two separate 5-min left pulmonary arterial clamping attempts were carried out, with a 5-min interval reperfusion between the two occlusions (Fig. 1). The animals in the SHAM group underwent the same protocol, including thoracotomy, except for lung resection and one-lung ventilation (OLV). In this group, no pulmonary artery clamping was performed at any time.
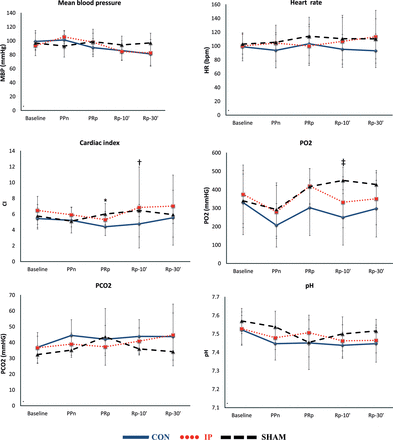
Haemodynamic and gasometric data. The lines show haemodynamic and gasometric values (mean ± SD) throughout the experiment in each group. MBP: mean blood pressure; HR: heart rate; CI: cardiac index; PO2: systemic partial pressure of oxygen; PCO2: systemic partial pressure of carbon dioxide; CON: control group; IP: ischaemic preconditioning group; SHAM: sham group; B: basal; PPn: prepneumonectomy; PRp: prereperfusion; Rp-10′: 10-min postreperfusion; Rp-30′: 30-min postreperfusion. *P = 0.042, CON vs SHAM group; †P = 0.049, CON vs SHAM group; ‡P = 0.019, CON vs SHAM group.
Measurement and sampling time points
Baseline (B) haemodynamic and arterial blood gas measurements were performed 30 min after the thoracotomy, with the animal under two-lung ventilation. Subsequently, haemodynamic and arterial gas measurements and liver biopsies were performed at the following time points (Fig. 1): prepneumonectomy (PPn)—before completing the pneumonectomy and with the animal under OLV; prereperfusion (PRp)—before reperfusion and ventilation of the reimplanted left caudal lobe; 10-min postreperfusion (Rp-10′)—10 min after the reperfusion of the reimplanted lobe and 30-min postreperfusion (Rp-30′)—30 min after the reperfusion of the reimplanted lobe. In the experimental group, PPn measurements and biopsies were performed after the IP manoeuvres. In the sham experiments, time points were taken as follows: PPn—120 min after thoracotomy; PRp—120 min after PPn; Rp-10′—10 min after PRp and Rp-30′—30 min after PRp.
Haemodynamic measurements
Additional variables were determined at the above-mentioned time points. A femoral artery catheter was used to record the mean blood pressure. The pulmonary–artery catheter recorded the pulmonary artery mean pressure. In addition, the cardiac output monitor (Edwards Lifesciences) and thermodilution technique were used at the mentioned time points to record the cardiac index (CI).
Blood gas measurements
Arterial blood gas analyses were performed at the previously mentioned time points. In addition, blood gas samples were taken by puncturing the pulmonary vein of the reimplanted lobe at 10 and 30 min after reperfusion.
Biochemical studies in liver tissue
Liver tissue biopsies were performed for biochemical studies. Every liver sample was placed in a cryotube, flash frozen in liquid nitrogen and stored at −80°C until biochemical analysis.
RNA isolation and reverse transcription–polymerase chain reaction
A TRI Reagent Kit (Molecular Research Centre, Inc., Cincinnati, OH, USA) was used according to the manufacturer's protocol to isolate RNA from swine liver samples following the method described by Chomczynski and Sacchi [12]. The purity of the RNA was estimated by analysis using 1.5% agarose gel electrophoresis, and the RNA concentrations were determined by spectrophotometry (260 nm). The Reverse Transcription System (Promega, Madison, WI, USA) and a pd(N)6 random hexamer were used to perform reverse transcription of 2 µg of RNA for cDNA synthesis. An Applied Biosystems 7300 apparatus with the SYBR Green PCR Master Mix (Applied Biosystems, Warrington, UK) and 300 nM concentrations of specific primers were used to perform reverse transcription–polymerase chain reaction (RT–PCR; Table 1). RT–PCR amplifications were performed as follows: 50°C for 2 min, 95°C for 10 min, followed by 40 cycles of 95°C for 15 s, 60°C for 1 min, 95°C for 15 s, 60°C for 30 s and 95°C for 15 s. For normalization of cDNA loading in the PCR, amplification of 18S rRNA for every sample was used. The 2−ΔΔCT method was used to calculate relative changes in gene expression [13].
| . | Primers . | Sequence (5′–3′) . |
|---|---|---|
| 18S | Forward | GGTGCATGGCCGTTCTTA |
| Reverse | TCGTTCGTTATCGGAATTAACC | |
| TNF-α | Forward | ATGAGAAGTTCCCAAATGGC |
| Reverse | CTCCACTTGGTGGTTTGCTA | |
| IL-1β | Forward | TGTGATGAAAGACGGCACAC |
| Reverse | CTTCTTCTTTGGGTATTGTTTGG | |
| IL-10 | Forward | ACTGCACCCACTTCCCAGT |
| Reverse | TTGTCCAGCTGGTCCTTTGT | |
| iNOS | Forward | CTTTGCCACGGACGAGAC |
| Reverse | TCATTGTACTCTGAGGGCTGAC | |
| MCP-1 | Forward | AGCATCCACGTGCTGTCTC |
| Reverse | GATCATCTTGCCAGTGAATGAGT | |
| NF-κB1 | Forward | CAGCTCTTCTCAAAGCAGCA |
| Reverse | TCCAGGTCATAGAGAGGCTCA |
Preparation of liver homogenates and determination of caspase-3
Frozen organ samples were weighed and transferred to 50-ml polypropylene tubes (Falcon; Becton Dickinson, Lincoln Park, NJ, USA) containing lysis buffer (4°C) at a ratio of 10 ml buffer/1 g of wet tissue. The lysis buffer consisted of 1 mM phenylmethylsulfonyl fluoride (Sigma Chemical Company), 1 mg/ml pepstatin A (Sigma Chemical Company), aprotinin (Sigma Chemical Company) and leupeptin (Sigma Chemical Company) in 1× phosphate buffered saline solution of pH 7.2 (Biofluids, Rockville, MD, USA) containing 0.05% sodium azide (Sigma Chemical Company). The samples were homogenized for 30 s with an electrical homogenizer (Polytron; Brinkmann Instruments, Westminster, NY, USA) at maximum speed, and the tubes were immediately frozen in liquid nitrogen. The samples were homogenized three times for optimal processing. The homogenates were later thawed in a 37°C water bath and centrifuged at 119 000 g (1 h, 4°C) to separate cellular organelles. The supernatants were frozen at −80°C to allow the formation of macromolecular aggregates. After thawing at 4°C, the aggregates were pelleted at 3000 g (4°C), and the final organ homogenate volume was measured with a graduated pipette. The homogenates were stored at −80°C until they were assayed for the quantitative presence of cytokines. An enzyme-linked immunosorbent assay (ELISA) kit was used according to the manufacturer's instructions (Sigma Chemical Company) to measure caspase-3 in the liver homogenates collected from all groups of swine.
Western blot analysis
Western blots were used to measure the protein expression of tumor necrosis factor-α (TNF-α), interleukin (IL)-1b, IL-10 and inducible form of nitric oxide synthase (iNOS). Briefly 50- to 60-mg liver samples was homogenizated with lysis buffer (ratio 20:250) and sonicated. Samples were then boiled with gel-loading buffer (0.100 M Tris–Cl; 4% sodium dodecyl sulphate; 20% glycerol; 0.1% bromophenol blue) (ratio 1:1). Protein concentration was determined by Bradford method. Sodium dodecyl sulphate–polyacrylamide gel electrophoresis with 10% acrylamide gels was used to separate the total protein equivalents (30 mg) for each of the samples, which were transferred onto a nitrocellulose membrane in a semi-dry transfer system. The membrane was immediately placed into a blocking buffer containing 5% non-fat milk in 20 mM Tris, pH 7.5; 150 mM NaCl and 0.01% Tween-20. The blot was allowed to block at 37°C for 1 h. The membrane was incubated with rabbit polyclonal TNF-α (1:4000; BioGenesis), IL-1β (1:4000; BioGenesis), IL-10 (1:4000; BioGenesis) and iNOS (1:1000; BioGenesis) overnight at 4°C and then incubated in an anti-rabbit immunoglobulin G-horseradish peroxidase-conjugated antibody (1:2000). After washing with T-TBS (Tris-buffered saline with tween 20), the membranes were incubated with ECL Plus detection reagents (Amersham Life Science, Inc., Buckinghamshire, UK) and exposed to X-ray film. The films were scanned with a densitometer (BioRad GS 800) to determine the relative optical densities. Prestained protein markers were used for molecular weight determinations. Reproducibility within the assays was evaluated in three independent experiments. Each assay was performed with three replicates. The overall intra-assay coefficient of variation was <5%. Assay-to-assay reproducibility was evaluated in three independent experiments. The overall interassay coefficient of variation was <6%.
Statistical analysis
The data are expressed as the mean ± standard deviation (SD). Non-parametric tests were used. Accordingly, a Mann–Whitney U-test was applied to establish differences between the analysed groups. In addition, a Wilcoxon test for paired data was used to study the evolution of the intragroup values. The level of statistical significance was set at P < 0.05. The SPSS version 14.0 statistical package was used in this study.
RESULTS
There were no differences among the SHAM, CON and IP groups in terms of animal weight (40 ± 11, 47 ± 14 and 38 ± 14 kg, respectively) or duration of the entire procedure (291 ± 10, 287 ± 35 and 308 ± 38 min, respectively). There were no differences between the CON and IP groups in terms of lung ischaemia time (100 ± 17 vs 108 ± 10 min).
Haemodynamics and blood gas analysis
The haemodynamic and arterial gasometric values showed great stability. The only significant differences observed were in the CI at PRp and Rp-10′ and in PO2 at Rp-10′ between the SHAM and CON animals (Fig. 1).
Expression of mRNA for TNF-α, IL-1 and IL-10
TNF-α mRNA expression in liver tissue increased after ischaemia in the CON group (P = 0.0093, PRp vs PPn), but not in the SHAM or IP group (Fig. 2A). IL-1 mRNA expression increased after reperfusion in the CON (P = 0.0069, Rp-10′ vs PRp) and IP (P = 0.046, Rp-10′ vs PRp) livers, but not in the SHAM livers. After 30 min of lung reperfusion, the increase in IL-1 mRNA expression in liver tissue was significantly lower when IP was performed (P = 0.00025, CON vs IP) (Fig. 2B). Conversely, after lung reperfusion, a decrease in IL-10 mRNA expression was observed in the CON livers, but not in the IP or SHAM livers (Fig. 3).
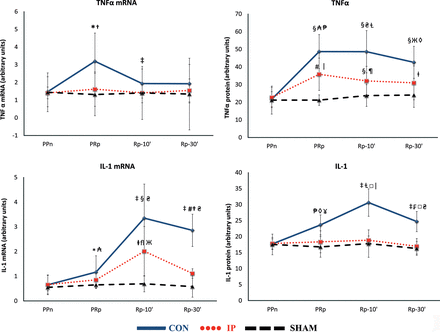
(A) The lines show the expression of TNF-α mRNA and TNF-α in liver tissue throughout the experiment in the experimental groups. CON: control group; IP: ischaemic preconditioning group; SHAM: sham group; PPn: prepneumonectomy; PRp: prereperfusion; Rp-10′: 10-min postreperfusion; Rp-30′: 30-min postreperfusion. Intragroup analysis: *P = 0.0093 vs PPn; ‡P = 0.049 vs PRp; §P = 0.0051 vs PPn; #P = 0.0069 vs PPn; ⱡP = 0.037 vs PPn. Intergroup analysis:†P = 0.047, CON vs IP group; ₳P = 0.0029, CON vs IP group; ₴P = 0.0015, CON vs IP group; ЖP = 0.0011, CON vs IP group; ₱P = 0.00066, CON vs SHAM group; □ⱢP = 0.0013, CON vs SHAM group; ◊P = 0.0027, CON vs SHAM group; |P = 0.0047, IP vs SHAM group; ¶P = 0.04, IP vs SHAM group. (B) The lines show the expression of IL-1 mRNA and IL-1 in liver tissue throughout the experiment in the experimental groups. Intragroup analysis: *P = 0.049 vs PPn; ‡P = 0.0051 vs PPn; §P = 0.0069 vs PRp; #P = 0.013 vs PRp; ⱡP = 0.028 vs PPn; flP = 0.046 vs PRp; ₱P = 0.0069 vs PPn; ⱢP = 0.0051 vs PRp; ₣P = 0.0051 vs Rp-10′. Intergroup analysis:†P = 0.00025, CON vs IP group; ₳P = 0.028, CON vs SHAM group; ₴P = 0.00066, CON vs SHAM group. ЖP = 0.0303, IP vs SHAM group; ◊P = 0.0039, CON vs IP group; □P = 0.0001, CON vs IP group; ¥P = 0.0047, CON vs SHAM group; |P = 0.0013, CON vs SHAM group.
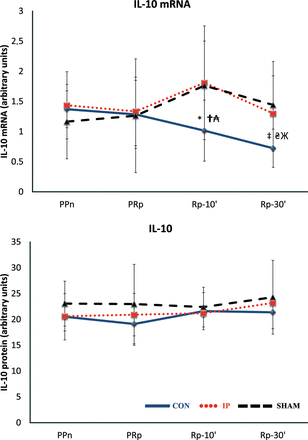
The lines show the expression of IL-10 mRNA and IL-10 in liver tissue throughout the experiment in the experimental groups. CON: control group; IP: ischaemic preconditioning group; SHAM: sham group; PPn: prepneumonectomy; PRp: prereperfusion; Rp-10′: 10-min postreperfusion; Rp-30′: 30-min postreperfusion. Intragroup analysis: *P = 0.047 vs PPn; ‡P = 0.0051 vs PPn. Intergroup analysis: †P = 0.023, CON vs IP group; ₳P = 0.028, CON vs SHAM group; ₴P = 0.016, CON vs IP group; ЖP = 0.04, CON vs SHAM group.
Western blot analysis of TNF-α, IL-1 and IL-10
Lung IR markedly increased the expression of the proinflammatory cytokines TNF-α and IL-1 in the CON group livers at PRp, Rp-10′ and Rp-30′ when compared with the PPn levels. A similar increase in the expression of TNF-α was observed in the IP livers, but not in the SHAM livers (Fig. 2A). The increases in expression of TNF-α and IL1 in the CON group were higher than those of the IP group at PRp (P = 0.0029 and 0.0039, respectively), Rp-10′ (P = 0.0015 and 0.0001, respectively) and Rp-30′ (P = 0.0011 and 0.0001, respectively) (Fig. 2B). No significant differences in the anti-inflammatory cytokine IL-10 were observed (Fig. 3).
Expression of mRNA for MCP-1
Lung IR markedly increased the expression of mRNA monocyte chemoattractant protein-1 (MCP-1) in liver tissue at PRp (P = 0.037), Rp-10′ (P = 0.0051) and Rp-30′ (P = 0.0051) compared with the PPn levels. These increases were not observed in the IP or SHAM groups (Fig. 4).
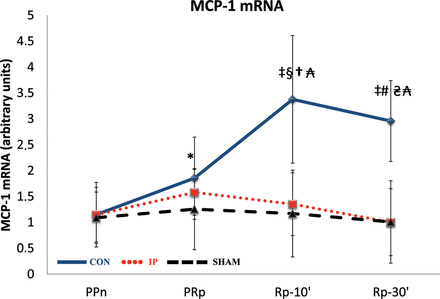
The lines show the expression of the chemokine MCP-1 mRNA in liver tissue throughout the experiment in the experimental groups. MCP-1: monocyte chemoattractant protein-1; CON: control group; IP: ischaemic preconditioning group; SHAM: sham group; PPn: prepneumonectomy; PRp: prereperfusion; Rp-10′: 10-min postreperfusion; Rp-30′: 30-min postreperfusion. Intragroup analysis: *P = 0.037 vs PPn; ‡P = 0.0051 vs PPn; §P = 0.028 vs PRp; #P = 0.021 vs PRp. Intergroup analysis:†P = 0.00013, CON vs IP group; ₳P = 0.0027, CON vs SHAM group; ₴P = 0.00008, CON vs IP group.
Expression of iNOS, iNOS mRNA and NF-κB mRNA
No significant changes were found for iNOS or iNOS mRNA expression during the procedure. Similarly, no differences were found in the expression of nuclear factor kappa beta (NF-κB) mRNA among the three groups. A significant increase in NF-κB mRNA expression was observed at Rp-10′ compared with PPn in CON livers (P = 0.0069), but not in the SHAM or IP livers (Fig. 5).
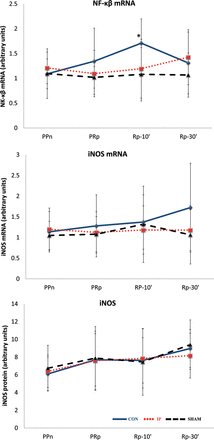
The lines show the expression of the transcription factor NF-κB, iNOS and iNOS mRNA in liver tissue throughout the experiment in the experimental groups. iNOS: inducible nitric oxide synthase; CON: control group; IP: ischaemic preconditioning group; SHAM: sham group; PPn: prepneumonectomy; PRp: prereperfusion; Rp-10′: 10-min postreperfusion; Rp-30′: 30-min postreperfusion. *P = 0.0069 vs PPn.
ELISA quantification of caspase-3
Caspase-3 protein levels continuously increased throughout the procedure in all three groups (Fig. 6). This increase was higher in the IP than in the SHAM livers at Rp-30′ (P = 0.016), but was even higher in the CON than in the IP livers (P = 0.009, CON vs IP at PRp, Rp-10′ and Rp-30′).
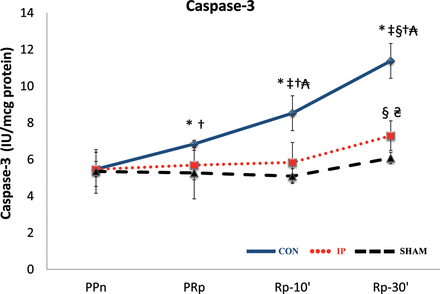
The lines show the expression of the caspase-3 concentration in liver tissue throughout the experiment in the experimental groups. CON: control group; IP: ischaemic preconditioning group; SHAM: sham group; PPn: prepneumonectomy; PRp: prereperfusion; Rp-10′: 10-min postreperfusion; Rp-30′: 30-min postreperfusion. Intragroup analysis: *P = 0.043 vs PPn; ‡P = 0.043 vs PRp; §P = 0.043 vs Rp-10′. Intergroup analysis: †P = 0.009, CON vs IP group; ₳P = 0.0079, CON vs SHAM group; ₴P = 0.016, IP vs SHAM group.
DISCUSSION
It is well known that after some cardiac or lung surgeries, lung IR may cause pulmonary dysfunction that increases perioperative morbidity and mortality. Moreover, the events of IR injury trigger a systemic inflammatory response and multiple organ dysfunction syndrome that are potentially more detrimental than its local effects. Few studies have investigated the effects of IR lung injury on remote organs. Esme et al. [9] showed that pulmonary IR induced liver injury in rabbits. In that study, a 60-min I/R of lung tissue was enough to increase hepatic myeloperoxidase activity, reflecting recruitment of neutrophils into the liver. In addition, they also observed an increase in the markers of oxidative stress in liver tissue after lung IR. Similarly, in the present experiment, lung IR induced a remote hepatic inflammatory response as evidenced by the striking increase in expression of the proinflammatory cytokines TNF-α, IL-1 and MCP-1 in the livers of the control animals. We also observed that lung IR induced a progressive decrease in IL-10 mRNA expression in CON livers, reflecting an increasing imbalance between pro- and anti-inflammatory cytokine production. These results are consistent with reports by others that have suggested that IR of a distant organ, including the kidney [3, 5], gut [6] and limbs [14–16], may induce the release of cytokines and other inflammatory mediators by hepatic cells. The authors have previously shown in the same experimental model that lung IR induced an increase in proinflammatory cytokines and oxidative stress parameters in lung tissue [11], and we can speculate that lung IR injury may initiate a cascade of proinflammatory pathways that facilitates organ crosstalk and remote organ injury. The same may be said for the activation of apoptotic pathways. Some authors have found that IR can induce apoptosis in remote organs, including the heart [4], liver [17] and lungs [18–20]. McCarter et al. found an increase in liver apoptosis in a murine model of limb IR. They showed that caspase-3 activity, a hallmark indicator of apoptosis, increased 3-fold after 3 h of reperfusion. This increase in caspase-3 activity in liver tissue was followed by increased DNA fragmentation after 6 h of reperfusion [17]. These results are consistent with those of our study, where caspase-3 increased throughout the procedure in CON livers to nearly 1-fold higher than that in the SHAM group after 30 min of lung reperfusion. In light of these findings, it is conceivable that inflammatory mediators produced in the ischaemic lung circulate upon reperfusion and induce both inflammatory and apoptotic responses in the liver.
Direct IP has been proven to reduce experimental and clinical lung IR injuries, and we have previously shown that lung IP prevents an increase in oxidative stress, leukocyte activation and proinflammatory cytokines (TNF-α, IL-1 and MCP-1) in lung tissue during pulmonary IR [10]. The present study goes beyond our previous findings and demonstrates that lung IP reduced the inflammatory and apoptotic responses induced in the liver by lung IR injury. In light of these results, it is tempting to speculate that the benefits of IP on lung IR-induced systemic inflammatory response may reflect the protection of both the lungs and remote organs. In fact, RIPC has recently been proposed as a method of IR injury prevention. In RIPC, brief ischaemia of one organ has been shown to confer protection on distant organs without direct stress to the organ. Experimental studies have demonstrated that brief I/R of the limb, gut, mesentery or kidney reduces myocardial infarct size, and clinical research has shown that skeletal IP induces myocardial protection [21]. Two reports have shown that limb IP has a protective role against hepatic IR injury in rats [7, 8]. The underlying mechanisms and pathways of RIPC are not well established, and an overlap between the neurogenic and humoral pathways has been proposed [21]. Remote cytokine (including TNF-α [22, 23], IL-1 [22] and MCP-1[24]), NF-κB [25] and iNOS [25] modulation through these signalling pathways have been suggested as a potential mechanism for RIPC-induced protection. In our experiment, lung IP prevented the rise of TNF-α, IL-1 and MCP-1 induced by lung IR in liver tissue, although no differences in NF-κB mRNA or iNOS expression were found. However, the differences in the experimental models (hind limb RIPC in mice hearts) and measurement time points (2–24 h) used in our study and the cited research [25] could explain the discrepancies among the studies. Finally, in our investigation, lung IP prevented liver apoptosis after lung IR as reflected by the lower levels of caspase-3 protein in the hepatic tissue of the animals in which lung IP was performed. Similarly, others have shown that RIPC reduced apoptosis in mice livers after limb IR [17].
A considerable limitation of this work is the complex nature of the surgical procedure. Although the hepatic inflammatory and apoptotic responses seemed to be preferentially enhanced by lung reperfusion, increases in TNF-α, IL-1 and MCP-1 expression were observed in the CON livers before the beginning of pulmonary reperfusion. These findings suggest that, in this experimental model, the liver inflammatory response may be induced by both surgical stress and remote IR injury. However, IR and surgical stress inevitably occur in conjunction with these procedures, and there is no conclusive way to discern their respective impact on liver response.
In conclusion, the findings of this research have obvious relevance because the surgical protocol used, mimics clinical procedures (cardiopulmonary bypass, pulmonary thromboembolectomy, bronchovascular sleeve resection, lung transplantation) and because RIPC appeared to confer protection from lung IR injury. The clinical significance of pulmonary IR-induced remote organ dysfunction should be further studied to guide thoracic surgeons in the management of patients with remote organ dysfunction.
Funding
This research was supported by the Institute of Health Carlos III (grant numbers PI070840 and PI070481) and the Spanish Society of Pneumology and Thoracic Surgery (SEPAR; grant number 06/121).
Conflict of interest: none declared.
REFERENCES
APPENDIX. CONFERENCE DISCUSSION
Dr J. Fibla(Barcelona, Spain): Do you think there might be a specific future clinical application of the results?
Dr Huerta: Yes. Until we find a molecular combination of mediators to perform pharmacological preconditioning, we think that ischemic preconditioning is a clinical tool to perform for protecting remote ischemic preconditioning from ischemia-reperfusion induced damage.
Dr Y. Colson(Boston, MA, USA): Do you think that there are specific mediators that you could maybe block or change so that you wouldn't have to do the preconditioning clinically?
Dr Huerta: We think that the mediators that are implicated in ischemia-reperfusion are not well defined, and believe that the increase in inflammatory mediators may be induced by both the surgical stress and the remote ischemia-reperfusion injury.
Author notes
Presented at the 20th European Conference on General Thoracic Surgery, Essen, Germany, 10–13 June 2012.
- cytokine
- polymerase chain reaction
- ischemia
- tumor necrosis factors
- ischemic preconditioning
- western blotting
- enzyme-linked immunosorbent assay
- interleukin-1
- lung
- reperfusion therapy
- physiologic reperfusion
- interleukin-10
- monocyte chemoattractant protein-1
- nitric oxide synthase
- rna, messenger
- surgical procedures, operative
- suidae
- transplantation, autologous
- liver
- inflammatory response
- caspase-3


