


Abstract
To clarify the influence of renal function on adverse outcomes in patients with non-valvular atrial fibrillation (NVAF), a post hoc analysis of the J-RHYTHM Registry was performed.
A consecutive series of outpatients with atrial fibrillation (AF) were enrolled from 158 institutions and followed for 2 years or until the occurrence of an event. Among 7406 patients with non-valvular AF, 6052 patients (69.8 ± 10.0 years, 71.2% men) with creatinine clearance (CrCl) value at baseline were divided into four groups according to CrCl level (<30, 30–49.9, 50–79.9, and ≥80 mL/min). Patients with CrCl <80 mL/min showed increased incidence of thromboembolism, major haemorrhage, all-cause and cardiovascular death, and composite events as compared with patients with CrCl ≥80 mL/min. After adjustment for multiple confounders, lower CrCl values emerged as independent predictors for thromboembolism [CrCl 30–49.9, hazard ratio (HR) 2.27, 95% confidence interval (CI) 1.09–4.72, P = 0.029; and CrCl 50–79.9, HR 1.99, 95% CI 1.07–3.72, P = 0.030] and all-cause death (CrCl <30, HR 6.44, 95% CI 3.03–13.7, P < 0.001; and CrCl 30–49.9, HR 3.14, 95% CI 1.54–6.41, P = 0.002), with CrCl ≥80 mL/min serving as a reference, whereas not for major haemorrhage. Warfarin treatment was associated with lower rates of composite events in patients with lower CrCl values of <80 mL/min.
Renal impairment was an independent predictor of adverse clinical outcomes except for major haemorrhage in Japanese patients with non-valvular AF. Warfarin was associated with lower rates of composite events in patients with lower CrCl values.
http://www.umin.ac.jp/ctr/. Unique identifier: UMIN000001569.
Introduction
Atrial fibrillation (AF) is a common arrhythmia and a strong risk factor for cardiogenic thromboembolism.1,2 Anticoagulation therapy with vitamin K antagonists (VKA), mainly warfarin, is able to reduce the risk of cardiogenic thromboembolism by 60–70%.3,4 Although direct oral anticoagulants (DOACs) are currently available for the prevention of ischaemic stroke and systemic embolism in patients with non-valvular AF (NVAF), warfarin is still indicated in those with severe renal impairment. The use of DOACs is contraindicated for patients with creatinine clearance (CrCl) values of <30 mL/min for dabigatran and <15 mL/min for factor Xa inhibitors (i.e. rivaroxaban, apixaban, and edoxaban).5 Renal impairment itself is a risk factor for stroke or all-cause mortality in patients with AF6–9 as well as in the general population.10,11 In addition, warfarin therapy in patients with renal impairment is not always safe due to the increased risk of bleeding.7,12 Reports on the association between renal impairment and clinical outcomes are still limited in Japanese patients with NVAF.13,14 Therefore, a post hoc analysis was performed using our prospective observational data of the J-RHYTHM Registry in order to investigate the influence of renal function on thromboembolism, major haemorrhage, and mortality in Japanese patients with NVAF. Although estimated glomerular filtration rate (eGFR) has been adopted for the definition of chronic kidney disease15 and is widely used for the evaluation of renal function in a clinical practice, CrCl was used in this subanalysis at the physicians’ convenience, since renal function is determined using CrCl values for dose adjustments of DOACs.5
Methods
Study design of the J-RHYTHM Registry
The J-RHYTHM Registry was conducted as a prospective observational study to investigate the optimal anticoagulation therapy with warfarin in Japanese patients with AF.16 The study design and baseline patient characteristics have been reported elsewhere.16,17 Briefly, the study protocol conformed to the Declaration of Helsinki and was approved by the ethics committee of each participating institution. A consecutive series of outpatients with AF of any type were enrolled from 158 institutions without any exclusion criterion regarding renal function. All participants gave written informed consent at the time of enrolment. All treatment strategies including the selection of an oral anticoagulant were determined at the discretion of the treating cardiologists. Patients with valvular AF (mechanical valve replacement and mitral stenosis) were excluded from this subanalysis. Patients were followed up for 2 years or until the occurrence of an event, whichever occurred first. Primary endpoints were defined as thromboembolism including symptomatic ischaemic stroke, transient ischaemic attack (TIA), and systemic embolic events; major haemorrhage including intracranial haemorrhage, gastrointestinal haemorrhage, and other haemorrhages requiring hospitalization; or all-cause and cardiovascular death. The composite of thromboembolism, major haemorrhage, and all-cause death, whichever occurred first was also evaluated. The diagnostic criteria for each event have been described elsewhere.16,17
Anticoagulation intensity was determined using the international normalized ratio (INR) of prothrombin time in patients receiving warfarin, and the time in therapeutic range (TTR) was determined using the method developed by Rosendaal et al.18 The target INR level was set at 1.6–2.6 for elderly patients aged ≥70 years and at 2.0–3.0 for patients aged <70 years according to Japanese guidelines.19
Using the data of age, gender, body weight, and serum creatinine value at the time of enrolment, CrCl was calculated by the Cockcroft–Gault formula,20 i.e. CrCl (mL/min) = (140 − age) × (body weight in kg) × (0.85 if female)/(72 × serum creatinine in mg/dL). Patients were divided into four groups based on CrCl values following previous phase III trials of DOACs;21,22 CrCl <30 mL/min, 30–49.9 mL/min, 50–79.9 mL/min, and ≥80 mL/min.
Statistical analysis
Data are presented as mean ± one standard deviation. The statistical significance of differences in mean values was analysed using Student’s t-test or analysis of variance, as appropriate. Frequencies of parameters or events were compared using the χ2 test or Fisher’s exact test, as appropriate. Kaplan–Meier curves were used to compare time to events with log-rank tests. A Cox proportional hazards model was used to investigate the influence of renal function on events. Hazard ratios (HRs) and 95% confidence interval (CI) of the groups with CrCl <80 mL/min were calculated with CrCl ≥80 mL/min as a reference. Explanatory variables for multivariate analysis were adopted from well-known risk factors, i.e. the components of the CHA2DS2-VASc score [congestive heart failure, hypertension, age ≥75 years, diabetes mellitus, and history of stroke or TIA, vascular disease (coronary artery disease), age 65–74 years, and female sex]23 plus the use of warfarin and antiplatelet medication. HRs for each end point and composite events were also determined using CrCl values as a continuous variable. The predictive ability of CrCl for each event was evaluated with the c-index. The sensitivity and specificity of cut-off CrCl points for each event were also obtained from the receiver operating characteristic curves. Two-tailed P-values of <0.05 were considered statistically significant. All statistical analyses were performed with SPSS software version 23.0 (IBM Corporation, Armonk, NY, USA).
Results
Among the 7937 patients with AF who were enrolled in the J-RHYTHM Registry,17 421 (5.3%) patients with valvular AF were excluded and 110 (1.5%) patients were lost to follow-up. Of the remaining 7406 patients with NVAF, 1354 patients without baseline CrCl data were excluded due to missing of serum creatinine in 828 and/or body weight in 974 patients. Ultimately, a total of 6052 patients with CrCl values at baseline constituted the study group.
Baseline patient characteristics and medications
Baseline patient characteristics and medications of the four CrCl groups are shown in Table 1. Prevalence of cardiomyopathy and diabetes mellitus, and systolic blood pressure were comparable, but other variables showed significant differences among the groups. In particular, age and prevalence of a history of stroke or TIA were higher in the groups with CrCl <30 and 30–49.9 mL/min. There were significant trends for CrCl values among the four groups by the study design. Risk scores for both thromboembolism (CHADS224 and CHA2DS2-VASc scores23) and bleeding (HAS-BLED score25) were the highest in the CrCl <30 mL/min group (Table 1).
Baseline patient characteristics and medications
| Creatinine clearance values (mL/min) | |||||
|---|---|---|---|---|---|
| <30 | 30–49.9 | 50–79.9 | ≥80 | P for trend | |
| (n = 356) | (n = 1201) | (n = 2686) | (n = 1809) | ||
| Age, years | 79.8 ± 7.9 | 77.7 ± 6.4 | 70.7 ± 7.0 | 61.1 ± 9.1 | <0.001 |
| Female | 181 (50.8) | 481 (40.0) | 764 (28.4) | 320 (17.7) | <0.001 |
| Body weight, kg | 49.6 ± 10.6 | 54.2 ± 9.4 | 61.5 ± 9.3 | 71.5 ± 13.5 | <0.001 |
| Renal function | |||||
| Serum creatinine, mg/dL | 2.2 ± 1.9 | 1.1 ± 0.3 | 0.9 ± 0.2 | 0.8 ± 0.2 | <0.001 |
| CrCl, mL/min | 21.8 ± 6.6 | 41.3 ± 5.6 | 64.7 ± 8.3 | 100.8 ± 21.4 | <0.001 |
| Type of atrial fibrillation | |||||
| Paroxysmal | 117 (32.9) | 400 (33.3) | 1036 (38.6) | 729 (40.3) | <0.001 |
| Persistent | 40 (11.2) | 144 (12.0) | 375 (14.0) | 287 (15.9) | |
| Permanent | 199 (55.9) | 657 (54.7) | 1275 (47.4) | 793 (43.8) | |
| Comorbidities | |||||
| Coronary artery disease | 77 (21.6) | 180 (15.0) | 276 (10.3) | 143 (7.9) | <0.001 |
| Cardiomyopathy | 45 (12.6) | 100 (8.3) | 230 (8.6) | 172 (9.5) | 0.652 |
| HCM | 20 (5.6) | 46 (3.8) | 107 (4.0) | 58 (3.2) | 0.060 |
| DCM | 25 (7.0) | 54 (4.5) | 123 (4.6) | 114 (6.3) | 0.298 |
| COPD | 5 (1.4) | 43 (3.6) | 53 (2.0) | 15 (0.8) | <0.001 |
| Hyperthyroidism | 7 (2.0) | 14 (1.2) | 36 (1.3) | 45 (2.5) | 0.029 |
| Risk factors for stroke | |||||
| Heart failure | 223 (62.6) | 482 (40.1) | 666 (24.8) | 163 (9.0) | <0.001 |
| Hypertension | 234 (65.7) | 785 (65.4) | 1650 (61.4) | 1020 (56.4) | <0.001 |
| Age (≥75 years) | 282 (79.2) | 866 (72.1) | 841 (31.3) | 98 (5.4) | <0.001 |
| Diabetes mellitus | 81 (22.8) | 242 (20.1) | 492 (18.3) | 64 (3.5) | 0.147 |
| Stroke/TIA | 65 (18.3) | 218 (18.2) | 385 (14.3) | 68 (3.8) | <0.001 |
| CHADS2 score | 2.7 ± 1.2 | 2.3 ± 1.2 | 1.7 ± 1.2 | 1.2 ± 1.1 | <0.001 |
| CHA2DS2-VASc score | 4.4 ± 1.4 | 3.9 ± 1.4 | 2.9 ± 1.6 | 3.0 ± 1.5 | <0.001 |
| HAS-BLED score | 2.2 ± 1.0 | 1.9 ± 0.9 | 1.6 ± 0.9 | 1.0 ± 1.0 | <0.001 |
| Heart rate, /min | 72.8 ± 12.8 | 72.9 ± 13.4 | 72.0 ± 13.0 | 74.3 ± 13.3 | 0.694 |
| Systolic BP, mmHg | 123.4 ± 19.5 | 125.3 ± 17.3 | 126.7 ± 15.9 | 125.4 ± 18.1 | 0.105 |
| Diastolic BP, mmHg | 67.5 ± 12.3 | 70.8 ± 11.6 | 73.9 ± 19.2 | 68.2 ± 12.1 | <0.001 |
| Warfarin | 322 (90.4) | 1064 (88.6) | 2364 (88.0) | 1538 (85.0) | <0.001 |
| Dosage, mg/day | 2.1 ± 0.9 | 2.4 ± 1.0 | 2.9 ± 1.1 | 3.3 ± 1.2 | <0.001 |
| INR | 1.89 ± 0.52 | 1.92 ± 0.53 | 1.90 ± 0.47 | 1.90 ± 0.49 | 0.003 |
| TTRa, % | 61.7 ± 26.5 | 69.8 ± 24.8 | 61.9 ± 28.3 | 47.5 ± 29.5 | <0.001 |
| (n = 299) | (n = 997) | (n = 2251) | (n = 1449) | ||
| Antiplatelet | 123 (34.6) | 387 (32.2) | 700 (26.1) | 400 (22.1) | <0.001 |
| Aspirin | 100 (28.1) | 320 (26.6) | 609 (22.7) | 364 (20.1) | <0.001 |
| Others | 35 (9.8) | 106 (8.8) | 162 (6.0) | 58 (3.2) | <0.001 |
| Warfarin + antiplatelet | 99 (27.8) | 298 (24.8) | 500 (18.6) | 257 (14.2) | <0.001 |
Data are number of patients (%) or mean ± SD.
CrCl, creatinine clearance; HCM, hypertrophic cardiomyopathy; DCM, dilated cardiomyopathy; COPD, chronic obstructive pulmonary disease; CHADS2, congestive heart failure, hypertension, age ≥75 years, diabetes mellitus, and history of stroke or TIA; CHA2DS2-VASc, CHADS2 components plus vascular disease (coronary artery disease), age 65–74 years, and female sex; HAS-BLED, hypertension (systolic BP ≥140 mmHg), abnormal renal/liver function, stroke, bleeding history or predisposition, labile INR (episodes of INR ≥3.5), elderly (age >65 years), drugs (use of antiplatelets)/alcohol concomitantly; TIA, transient ischaemic attack; BP, blood pressure; INR, international normalized ratio of prothrombin time; TTR, time in therapeutic range.
aTarget INR was 2.0–3.0 (<70 years) or 1.6–2.6 (≥70 years).
There were significant differences in some baseline characteristics between patients with and without CrCl data; however, age, body weight, baseline INR values, or TTR did not differ between the four groups (see Supplementary material online, Table S1). Baseline characteristics of patients stratified by CrCl and warfarin use at baseline are shown in Supplementary material online, Table S2.
Event rates and renal function
Two-year event rates in the four groups are shown in Table 2. There was a significant trend for the four events, and consequently, for composite events among the four CrCl groups (P < 0.001 for trend). The CrCl <30 mL/min group showed the highest event rates among the four CrCl groups except for thromboembolic events. The Kaplan–Meier curves for each endpoint are shown in Figure 1. Significant differences in the event-free rates of thromboembolism, major haemorrhage, all-cause death, and cardiovascular death among the four groups were revealed by the log-tank test (Figure 1). This was also true for composite events (Figure 2). The CrCl <30 mL/min group showed the lowest event-free rate for composite events. There were no significant differences in the 2-year event rates of all events between patients with and without CrCl data (see Supplementary material online, Table S3).
Two-year event rates in creatinine clearance groups
| Creatinine clearance values (mL/min) | |||||
|---|---|---|---|---|---|
| <30 | 30–49.9 | 50–79.9 | ≥80 | P for trend | |
| (n = 356) | (n = 1201) | (n = 2686) | (n = 1809) | ||
| Thromboembolism | 7 (2.0%) | 33 (2.7%) | 53 (2.0%) | 16 (0.9%) | 0.001 |
| Cerebral infarction | 5 | 26 | 42 | 15 | |
| Transient ischaemic attack | 1 | 4 | 2 | 1 | |
| Systemic embolism | 1 | 3 | 9 | 0 | |
| Major haemorrhage | 13 (3.7%) | 35 (2.9%) | 48 (1.8%) | 24 (1.3%) | <0.001 |
| Intracranial | 5 | 14 | 20 | 7 | |
| Gastrointestinal | 6 | 10 | 15 | 9 | |
| Others | 2 | 11 | 13 | 8 | |
| All-cause death | 41 (11.5%) | 59 (4.9%) | 47 (1.7%) | 13 (0.7%) | <0.001 |
| Cardiovascular death | 15 (4.2%) | 23 (1.9%) | 10 (0.4%) | 7 (0.4%) | <0.001 |
| Composite eventsa | 61 (17.1%) | 126 (10.5%) | 147 (5.5%) | 53 (2.9%) | <0.001 |
Data are number of patients (%).
aThromboembolism, major haemorrhage, and all-cause death.
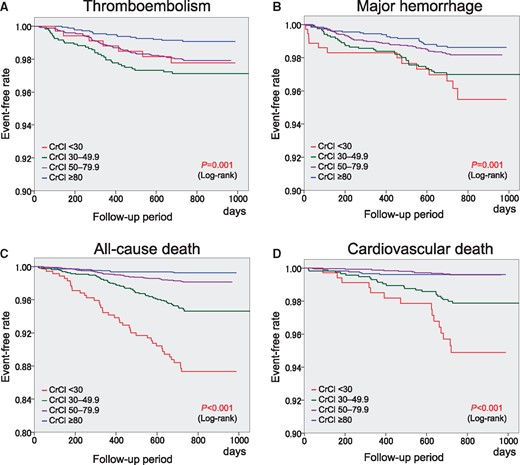
Kaplan–Meier curves for thromboembolism (A), major haemorrhage (B), all-cause death (C), and cardiovascular death (D). CrCl, creatinine clearance (mL/min).
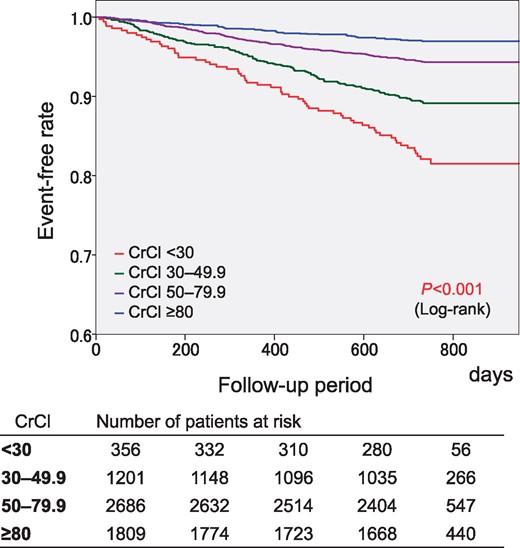
Kaplan–Meier curves for the composite of thromboembolism, major haemorrhage, and all-cause death. CrCl, creatinine clearance (mL/min).
A comparison of the 2-year event rates between patients with and without warfarin treatment at the time of events or at the end of the follow-up period is shown for each CrCl group in Supplementary material online, Table S4. The Kaplan–Meier curves for composite events were compared between patients with and without warfarin treatment (Figure 3). The event-free rate was higher in patients with warfarin than in those without warfarin for each CrCl group, except for the CrCl ≥80 mL/min group.
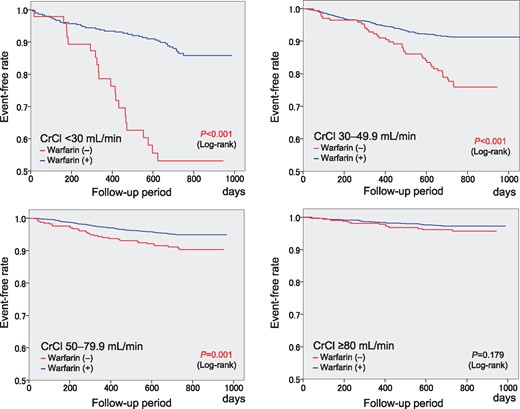
Kaplan–Meier curves for the composite of thromboembolism, major haemorrhage, and all-cause death with the status of warfarin use at the time of events or at the end of the follow-up period in the four CrCl groups. CrCl, creatinine clearance (mL/min).
Multivariate analysis of the influence of renal function on events
When unadjusted, lower CrCl values were associated with adverse clinical events (Table 3). When adjusted for possible confounders, this was also true except for major haemorrhage (Table 4). As expected, warfarin use was associated with as increased risk of major haemorrhage, and with a decreased risk of thromboembolism, all-cause death, and composite events (Table 4). P-values for interaction between warfarin use and CrCl were 0.407 for thromboembolism, 0.863 for major haemorrhage, 0.157 for all-cause death, 0.869 for cardiovascular death, and 0.630 for composite events, indicating no interaction between warfarin use and CrCl for any event. When baseline CrCl values were used as a continuous variable, adjusted risk of thromboembolism (HR 1.011, 95% CI 1.000–1.021, P = 0.040), all-cause death (HR 1.028, 95% CI 1.019–1.037, P < 0.001), cardiovascular death (HR 1.030, 95% CI 1.014–1.045, P < 0.001), and composite events (HR 1.014, 95% CI 1.009–1.020, P < 0.001) increased significantly for every 1-mL/min decrease in CrCl. Although the risk of major haemorrhage increased significantly for every 1-mL/min decrease in CrCl values (HR 1.013, 95% CI 1.006–1.021, P = 0.001) in unadjusted model, it became insignificant after adjustment for confounding factors (HR 1.002, 95% CI 0.993–1.011, P = 0.669).
Univariate analysis of influence of creatinine clearance on events
| Thromboembolism | Major haemorrhage | All-cause death | Cardiovascular death | Composite eventsa | ||||||
|---|---|---|---|---|---|---|---|---|---|---|
| HR | P-value | HR | P-value | HR | P-value | HR | P-value | HR | P-value | |
| (95% CI) | (95% CI) | (95% CI) | (95% CI) | (95% CI) | ||||||
| CrCl <30 mL/min | 2.41 | 0.052 | 3.00 | 0.001 | 17.77 | <0.001 | 12.19 | <0.001 | 6.41 | <0.001 |
| (0.99–5.86) | (1.53–5.90) | (9.52–33.2) | ||||||||
| (4.44–9.27) | ||||||||||
| (4.97–29.9) | ||||||||||
| CrCl 30–49.9 mL/min | 3.22 | <0.001 | 2.22 | 0.003 | 7.15 | <0.001 | 5.20 | <0.001 | 3.73 | <0.001 |
| (1.77–5.85) | (1.31–3.74) | (3.92–13.0) | (2.23–12.1) | (2.71–5.14) | ||||||
| CrCl 50–79.9 mL/min | 2.66 | 0.004 | 1.34 | 0.246 | 2.48 | <0.001 | 0.98 | 0.968 | 1.90 | <0.001 |
| (1.29–3.95) | (0.82–2.19) | (1.34–4.58) | (0.37–2.58) | (1.39–2.60) | ||||||
| CrCl ≥80 mL/min | Reference | — | Reference | — | Reference | — | Reference | — | Reference | — |
CrCl, creatinine clearance; HR, hazard ratio; CI, confidence interval; TIA, transient ischaemic attack.
aThromboembolism, major haemorrhage, and all-cause death.
Multivariate analysis for variables associated with clinical events
| Thromboembolism | Major haemorrhage | All-cause death | Cardiovascular death | Composite eventsa | ||||||
|---|---|---|---|---|---|---|---|---|---|---|
| HR | P-value | HR | P-value | HR | P-value | HR | P-value | HR | P-value | |
| (95% CI) | (95% CI) | (95% CI) | (95% CI) | (95% CI) | ||||||
| CrCl <30 mL/minb | 1.69 | 0.309 | 1.37 | 0.441 | 6.44 | <0.001 | 3.99 | 0.017 | 2.99 | <0.001 |
| (0.62–4.62) | (0.62–3.03) | (3.03–13.7) | (1.28–12.4) | (1.91–4.67) | ||||||
| CrCl 30–49.9 mL/minb | 2.27 | 0.029 | 1.10 | 0.775 | 3.14 | 0.002 | 2.29 | 0.126 | 1.94 | 0.001 |
| (1.09–4.72) | (0.58–2.09) | (1.54–6.41) | (0.79–6.61) | (1.31–2.88) | ||||||
| CrCl 50–79.9 mL/minb | 1.99 | 0.030 | 0.91 | 0.747 | 1.73 | 0.111 | 0.71 | 0.523 | 1.40 | 0.058 |
| (1.07–3.72) | (0.53–1.58) | (0.88–3.38) | (0.25–2.04) | (0.99–1.99) | ||||||
| Heart failure | 1.14 | 0.545 | 1.44 | 0.063 | 2.90 | <0.001 | 5.98 | <0.001 | 1.80 | <0.001 |
| (0.75–1.73) | (0.98–2.12) | (2.06–4.08) | (3.06–11.71) | (1.46–2.22) | ||||||
| Hypertension | 1.04 | 0.309 | 1.46 | 0.070 | 0.66 | 0.011 | 0.54 | 0.024 | 0.95 | 0.602 |
| (0.70–1.54) | (0.97–2.19) | (0.48–0.91) | (0.31–0.92) | (0.77–1.17) | ||||||
| Age ≥75 years | 1.67 | 0.113 | 2.65 | 0.004 | 2.80 | 0.002 | 2.03 | 0.201 | 2.37 | <0.001 |
| (0.88–3.16) | (1.36–5.17) | (1.44–5.44) | (0.69–6.03) | (1.62–3.45) | ||||||
| Diabetes mellitus | 2.00 | 0.444 | 1.12 | 0.602 | 1.17 | 0.397 | 1.57 | 0.135 | 1.15 | 0.241 |
| (0.75–1.90) | (0.73–1.72) | (0.81–1.69) | (0.87–2.83) | (0.91–1.47) | ||||||
| Stroke/TIA | 1.56 | 0.064 | 1.60 | 0.030 | 1.52 | 0.029 | 1.18 | 0.645 | 1.55 | <0.001 |
| (0.97–2.50) | (1.05–2.46) | (1.04–2.20) | (0.59–2.36) | (1.22–1.97) | ||||||
| Vascular diseases | 0.92 | 0.791 | 1.14 | 0.622 | 1.76 | 0.005 | 1.58 | 0.185 | 1.34 | 0.036 |
| (0.50–1.71) | (0.68–1.91) | (1.19–2.61) | (0.80–3.10) | (1.02–1.77) | ||||||
| Age 65–74 years | 0.99 | 0.961 | 1.59 | 0.144 | 1.39 | 0.331 | 1.41 | 0.521 | 1.31 | 0.143 |
| (0.53–1.82) | (0.85–2.98) | (0.72–2.70) | (0.49–4.06) | (0.91–1.89) | ||||||
| Female | 0.80 | 0.303 | 0.60 | 0.026 | 0.48 | <0.001 | 0.80 | 0.448 | 0.59 | <0.001 |
| (0.52–1.23) | (0.38–0.94) | (0.33–0.71) | (0.44–1.44) | (0.47–0.76) | ||||||
| Warfarin at baseline | 0.45 | 0.001 | 2.54 | 0.030 | 0.57 | 0.013 | 0.58 | 0.175 | 0.73 | 0.037 |
| (0.27–0.73) | (1.10–5.90) | (0.36–0.89) | (0.26–1.28) | (0.54–0.98) | ||||||
| Antiplatelet use | 0.98 | 0.943 | 1.44 | 0.089 | 1.05 | 0.778 | 1.31 | 0.395 | 1.14 | 0.281 |
| (0.62–1.55) | (0.95–2.20) | (0.73–1.52) | (0.71–2.42) | (0.90–1.44) | ||||||
Vascular disease = coronary artery disease.
CrCl, creatinine clearance; HR, hazard ratio; CI, confidence interval; TIA, transient ischaemic attack.
aThromboembolism, major haemorrhage, and all-cause death.
bVersus CrCl ≥80 mL/min.
Predictive ability of renal function for events
The c-indices of CrCl values were 0.61 (95% CI 0.56–0.66, P < 0.001) for thromboembolism, 0.60 (95% CI 0.55–0.65, P < 0.001) for major haemorrhage, 0.75 (95% CI 0.71–0.79, P < 0.001) for all-cause death, 0.76 (95% CI 0.69–0.83, P < 0.001) for cardiovascular death, and 0.67 (95% CI 0.64–0.70, P < 0.001) for composite events. The sensitivity and specificity of cut-off CrCl points for events are shown in Supplementary material online, Table S5. Although the sensitivity of CrCl <30 mL/min was less than 30%, the specificity was more than 90% for all events except for major haemorrhage. The sensitivity of CrCl <50 mL/min ranged from 37% to 69%, but the specificity was around 75% for all events (see Supplementary material online, Table S5).
Discussion
The major findings of the present study were as follows. First, since patients with renal impairment were characterized as high risk for both thromboembolism and major haemorrhage, there were significant trends of incidence of clinical events and composite events among the four CrCl groups. Event rates increased along with a decrease in CrCl values, with the exception of thromboembolism. Second, after adjustment for possible confounders, lower CrCl values were independently associated with clinical adverse events and composite events, but not with major haemorrhage. Finally, warfarin use was associated with a lower risk of composite events with CrCl values <80 mL/min.
Renal impairment and thromboembolism
Although renal dysfunction is not included in well-known risk scores for thromboembolism in patients with NVAF such as the or CHA2DS2-VASc scores,23 it appears to be a potent risk factor for stroke in patients with AF6–9 as well as in the general population.10,11 Several mechanisms have been proposed to underlie the increased thromboembolic event rates in patients with AF and renal dysfunction, including impaired function of the left atrial appendage, endothelial damage, coagulation abnormalities, activation of the renin-angiotensin-aldosterone system, chronic inflammation, and others.9 Previously, incorporation of renal dysfunction was proposed to enable improved risk stratification of thromboembolism in patients with AF, i.e. the R2CHADS2 score,26 however, renal dysfunction is not always detected as a risk factor for thromboembolism.27–30
In a Japanese cohort study, the Fushimi AF Registry,14 CrCl <30 mL/min was associated with the highest HR for stroke/systemic embolic events. However, this was not the case in the present study, in which the HR of CrCl values of <30 mL/min showed only marginal significance for thromboembolic events in the univariate analysis (P = 0.052, Table 3), though the P-value exceeded 0.30 in the multivariate analysis (Table 4). Nevertheless, CrCl values of 30–49.9 mL/min and 50–79.9 mL/min were independently associated with thromboembolic events in our cohort. The sample size, CHADS2 score, and CHA2DS2-VASc score of patients with CrCl <30 mL/min were comparable between the Fushimi AF registry14 and the present study. Some of the patients with CrCl <30 mL/min in our cohort died before thromboembolic events occurred.
Previous studies7,31,32 showed that warfarin was effective in reducing rates of stroke and thromboembolism in patients with AF and chronic kidney disease. This was also true for CrCl values of 30–49.9 mL/min and 50–79.9 mL/min in the present study (see Supplementary material online, Table S4). In the Fushimi AF Registry,14 however, oral anticoagulants, mainly warfarin, were not associated with lower event rates of thromboembolism as a whole, and the effects of oral anticoagulants were not determined for each CrCl group. In our cohort, anticoagulation therapy with warfarin was performed frequently in more than 85% of patients and TTR was approximately 60%. Consequently, the preventive effect of warfarin for thromboembolism was evident as we previously reported.33 In the Fushimi AF Registry, anticoagulants were prescribed in only half of patients with AF and anticoagulation intensity was suboptimal.34 These differences in anticoagulant use might explain inconsistent results between the Fushimi AF Registry and the present registry, although both registries were conducted in the same country Japan.
Renal impairment and major haemorrhage
Since renal impairment is known as a potent risk factor for bleeding complications in both patients with AF7,12,30,35 and the general population,29 it is included in the HAS-BLED score.25 Causes of the increased risk of haemorrhagic events in patients with renal impairment include platelet dysfunction, altered von Willebrand factor, and others.9 However, in the present study, renal impairment was not an independent predictor for major haemorrhage (Table 4), although the event-free rate of major haemorrhage differed among the four CrCl groups according to the log-rank test for the Kaplan–Meier curves (Figure 1), and the unadjusted HRs for major haemorrhage in patients with renal impairment were significantly high (Table 3). It was also true when CrCl values were used as a continuous variable. This finding also differed from that in the Fushimi AF Registry,14 in which CrCl values of <30 mL/min were independently associated with major haemorrhage. This is possibly attributable to differences in study design, patient characteristics, and the frequency and control status of anticoagulation therapy between our cohort and that of the Fushimi AF Registry.14 Haemorrhagic complications could have been strongly associated with other confounding factors such as age, a history of stroke or TIA, sex, and warfarin use in our cohort (Table 4).
Anticoagulation therapy with warfarin in patients with renal impairment has also shown to increase the risk of major haemorrhage,7 especially in older adults.12,35 However, conflicting results have been reported.8,31 In our cohort, although the incidence rate of major haemorrhage increased in tandem with a decrease in CrCl values, it did not differ significantly between patients with and without warfarin treatment for each CrCl value group (see Supplementary material online, Table S4).
Renal impairment and composite events
Renal impairment is also an established risk factor of all-cause and cardiovascular mortality in Japanese patients with AF13,14 and in the general population.10,11 In the present study, this association was confirmed, and even moderate renal impairment, i.e. CrCl 30–49.9 mL/min, was shown to be an independent predictor for all-cause mortality. The c-indices of CrCl for all-cause and cardiovascular death were higher than those for thromboembolism and major haemorrhage, indicating that the predictive ability of CrCl for mortality was superior to that for thromboembolism and major haemorrhage.
Previous studies showed that warfarin treatment was associated with a decreased rate of all-cause death in patients with AF and chronic kidney disease.31,36 In our cohort, warfarin treatment was associated with lower all-cause mortality in groups with CrCl <80 mL/min.
Higher rates of all-cause death contributed to the higher rates of composite events in the CrCl <30 mL/min and 30–49.9 mL/min groups in the present study, in accordance with a previous finding.8 Warfarin treatment was associated with a higher event-free rate for composite events as compared with no warfarin treatment for patients with CrCl <80 mL/min, particularly for those with CrCl <30 mi/min (Figure 3), a finding consistent with a previous finding.27 However, this specific benefit of warfarin treatment was not observed in the CrCl ≥80 mL/min group in our cohort; this could be due to the lower overall event rates in that CrCl group even without warfarin treatment.
Limitation
The present study had several limitations. First, this study was a post hoc analysis of an observational study and was therefore hypothesis-generating in nature. Mechanisms underlying the increased event rates among patients with lower CrCl values could not be determined. Second, the participants were recruited from only 158 institutions in Japan. Most of the participating physicians specialized in cardiology and in the management of cardiac arrhythmias. Therefore, these results cannot necessarily be extrapolated to the general Japanese population with NVAF. Third, for determination of renal function, CrCl was not directly measured using 24-h urine creatinine excretion but was estimated by the Cockcroft–Gault formula at baseline.20 Owing to missing data on serum creatinine, body weight, or both, 1354 (18.3%) patients were excluded from the present analysis. In addition, neither urinary protein concentration nor the aetiologies of renal impairment were determined in the present study. The serial changes in CrCl values over the follow-up period also went undetermined. Fourth, TTR values differed significantly among the four CrCl groups with the CrCl ≥80 mL/min group showing the lowest TTR value. However, the event rates were lowest in the CrCl ≥80 mL/min group; therefore, the variable TTR values could not have affected the present results. The efficacy of warfarin was determined by the status of its use at the time of events or at the end of the follow-up period, as in our previous subanalysis.37 Finally, when the J-RHYTHM Registry was started in 2009, DOACs were not approved for clinical use in Japan. Therefore, the effects of DOACs on the relationship between renal function and adverse clinical events were not clarified in the present analysis.
Conclusions
Lower CrCl values were independently associated with thromboembolism, all-cause death, and cardiovascular death, but not with major haemorrhage in Japanese patients with NVAF. Warfarin treatment was associated with lower rates of composite events among patients with lower CrCl values.
Supplementary material
Supplementary material is available at European Heart Journal—Quality of Care and Clinical Outcomes online.
Acknowledgements
We would like to thank all investigators of the J-RHYTHM Registry listed in references 16 and 17.
Funding
The J-RHYTHM Registry is registered at the University Hospital Medicine Information Network (UMIN) Clinical Trials Registry (UMIN000001569) and was supported by a grant from the Japan Heart Foundation (12080025). This research was partially supported by the Practical Research Project for Life-Style related Diseases including Cardiovascular Diseases and Diabetes Mellitus from the Japan Agency for Medical Research and Development (AMED) (15656344).
Conflict of interest: E.K. received remuneration from Ono Pharmaceutical. H.A. received remuneration from Daiichi-Sankyo. H.I. received remuneration from Daiichi-Sankyo, Bayer Healthcare, Boehringer Ingelheim, and Bristol-Myers Squibb. K.O. received research funding from Boehringer Ingelheim and Daiichi-Sankyo and remuneration from Boehringer Ingelheim, Bayer Healthcare, Daiichi-Sankyo, and Pfizer. T.Y. received research funding from Daiichi-Sankyo, Bayer Healthcare, Tanabe-Mitsubishi, Ono Pharmaceutical, and Bristol-Meyers Squibb and remuneration from Daiichi-Sankyo, Pfizer, Bayer Healthcare, Bristol-Myers Squibb, Boehringer Ingelheim, Eisai, and Ono Pharmaceutical. H.O. received remuneration from Daiichi-Sankyo.
References
